1. Introduction
Atomisation of liquid fuel jets into parent droplets and the secondary breakup of parent droplets into smaller fragments and droplets (Gorokhovski & Marcus Reference Gorokhovski and Marcus2008; Lebas et al. Reference Lebas, Menard, Beau, Berlemont and Demoulin2009; Duret et al. Reference Duret, Mansour, Sergei and Cyril2014; Jarrahbashi & Sirignano Reference Jarrahbashi and Sirignano2014; Jarrahbashi et al. Reference Jarrahbashi, Sirignano, Popov and Hussain2016; Zandian, Sirignano & Hussain Reference Zandian, Sirignano and Hussain2018; Gao et al. Reference Gao, Jianye, Yinan, Yue and Junlong2022; Xiong, Shao & Luo Reference Xiong, Changxiao and Kun2024) govern the fuel–air mixing and the consequent combustion behaviour in high-pressure propulsion systems (Zhong et al. Reference Zhong, Xuejun, Gong, Jianguo and Chih-Jen2009; Sun et al. Reference Sun, Yong, Oronzio and Gongnan2019; Bellan Reference Bellan2020; Jofre & Urzay Reference Jofre and Javier2021; Sharan & Bellan Reference Sharan and Josette2021). Droplet disintegration into smaller fragments due to the aerodynamic forces imposed by another fluid stream or shockwaves is commonly referred to as aerobreakup (Theofanous & Li Reference Theofanous and Li2008; Jain et al. Reference Jain, Neha, Surya Prakash, Ravikrishna and Gaurav2019; Marcotte & Zaleski Reference Marcotte and Stéphane2019; Rimbert et al. Reference Rimbert, Escobar, Meignen, Hadj-Achour and Gradeck2020; Ling & Mahmood Reference Ling and Mahmood2023). Aerobreakup has been extensively studied in the past (Nicholls & Ranger Reference Nicholls and Arthur1968; Theofanous, Li & Dinh Reference Theofanous, Li and Dinh2004; Theofanous & Li Reference Theofanous and Li2008b
; Guildenbecher, López-Rivera & Sojka Reference Guildenbecher, López-Rivera and Sojka2009; Chehroudi Reference Chehroudi2012; Xiong, Shao & Luo Reference Xiong, Changxiao and Kun2024). The observed mechanisms of droplet aerobreakup are classified into five categories as follows: vibrational breakup, bag breakup, bag-and-stamen breakup, sheet stripping (thinning) and wave crest stripping, followed by catastrophic breakup (Pilch & Erdman Reference Pilch and Erdman1987; Jain et al. Reference Jain, Neha, Surya Prakash, Ravikrishna and Gaurav2019). These mechanisms differ in forming bags, stamen, sheets and waves on the droplet’s surface, as well as the subsequent disintegration processes leading to the generation of small and large fragments (Pilch & Erdman Reference Pilch and Erdman1987; Theofanous & Li Reference Theofanous and Li2008). The shift between different breakup modes is reflected in the Weber number (
 ${\textit{We}}$
) (Hinze Reference Hinze1955), representing the ratio of inertial hydrodynamic forces to the surface tension force, defined based on the post-shock gas phase density (
 $\rho$
), the initial relative velocity between the flow field and the droplet (
 $u$
), the initial droplet diameter (
 $D$
) and the surface tension coefficient (
 $\sigma$
) as
 ${\textit{We}} ={\rho u^{2}D}/{\sigma }$
. Viscous effects on droplet breakup are correlated with the Ohnesorge number (
 ${\textit{Oh}}$
), which relates the viscous forces to the inertial and surface tension forces. The Ohnesorge number is calculated using the droplet dynamic viscosity (
 ${\mu}$
) and density (
 $\rho$
) as
 ${\textit{Oh}} ={{\unicode{x03BC}} }/{\sqrt{\rho \sigma D}}$
. The
 ${\textit{We}}{-}{\textit{Oh}}$
phase diagrams are commonly used to identify different breakup modes (Krzeczkowski Reference Krzeczkowski1980). Under low-Ohnesorge-number conditions, i.e.
 ${\textit{Oh}} \lt 0.1$
, a critical Weber number is defined as the primary independent variable to distinguish between the droplet breakup modes (Duan, Koshizuka & Oka Reference Duan, Seiichi and Yoshiaki2003; Guildenbecher, López-Rivera & Sojka Reference Guildenbecher, López-Rivera and Sojka2009; Khare et al. Reference Khare, Ma, Chen and Yang2014; Jain et al. Reference Jain, Surya Prakash, Gaurav and Ravikrishna2015; Jain et al. Reference Jain, Neha, Surya Prakash, Ravikrishna and Gaurav2019; Duke-Walker, Musick & McFarland Reference Duke-Walker, Benjamin and Jacob2023). The critical
 ${\textit{We}}$
indicating the transition from vibrational to bag breakup mode reported in the literature varies between 9 and 13 (Prandtl Reference Prandtl1952; Taylor Reference Taylor1963; Hsiang & Faeth Reference Hsiang and Faeth1995; Gelfand Reference Gelfand1996). More recently, Theofanous et al. (Reference Theofanous, Ng, Chih and Mitkin2012) revealed two distinct aerobreakup mechanisms observed in droplets interacting with shockwaves. These mechanisms include Rayleigh–Taylor piercing (RTP), occurring at lower Weber numbers (
 $44\lt {\textit{We}} \lt 1000$
), especially evident at lower Ohnesorge numbers where viscous effects are minimal. Additionally, the shear-induced entrainment (SIE) breakup mode is characterised by the peeling of the droplet’s outer surface, prevalent at higher Weber numbers, i.e.
 ${\textit{We}} \gt 1000$
(Theofanous et al. Reference Theofanous, Ng, Chih and Mitkin2012). Studies on droplet aerobreakup are mainly limited to atmospheric or near-atmospheric conditions and predominantly focus on isothermal conditions and constant density ratios between the droplet and the surrounding fluid. The influence of the liquid-to-gas density ratio on droplet breakup under impulsive acceleration, particularly in determining the fragmentation threshold and the critical Weber number under low-Ohnesorge-number conditions is highlighted in (Marcotte & Zaleski Reference Marcotte and Stéphane2019). Predicting droplet aerobreakup mechanisms becomes very challenging as systems approach supercritical conditions (Banuti Reference Banuti2015; Banuti et al. Reference Banuti, Raju and Ihme2016, Reference Banuti, Peter and Matthias2017; Ly & Ihme Reference Ly and Matthias2024). This phenomenon can occur in high-pressure liquid–fuel injection systems when the operating pressure and temperature exceed the nominal critical point of the fuel–air mixture. This behaviour can occur in scramjets (Zhong et al. Reference Zhong, Xuejun, Gong, Jianguo and Chih-Jen2009; Sun et al. Reference Sun, Yong, Oronzio and Gongnan2019), gas turbines (Jofre & Urzay Reference Jofre and Javier2021), liquid rockets (Hersch & Rice Reference Hersch and Edward1967; Harrje Reference Harrje1972; Miller, Harstad & Bellan Reference Miller, Harstad and Bellan1998; Mayer et al. Reference Mayer, Wolfgang, Axel, Bruno, Christian, Iskender, kalp and Rodger1998; Miller & Bellan Reference Miller and Bellan2000; Miller, Harstad & Bellan Reference Miller, Kenneth and Josette2001; Okong’, Harstad & Bellan Reference Okong, Kenneth and Josette2002; Talley & Coy Reference Talley and Coy2002; Oefelein Reference Oefelein2005; Davis & Chehroudi Reference Davis and Chehroudi2006; Zong & Yang Reference Zong and Vigor2006; Leyva, Chehroudi & Talley Reference Leyva, Bruce and Douglas2007; Chehroudi Reference Chehroudi2010; Chehroudi Reference Chehroudi2012) and direct-injection diesel engines (Kong, Senecal & Reitz Reference Kong, Senecal and Reitz1999; Barths, Hasse & Peters Reference Barths, Hasse and Peters2000; De Risi, Donateo & Laforgia Reference De Risi, Teresa and Domenico2003; Lacaze et al. Reference Lacaze, Antony, Anthony and Joseph2015). Further complexities arise in high-speed/pressure propulsion systems when the fuel spray interaction with shockwaves in a supercritical environment promotes secondary breakup, e.g. in pulsed/rotating detonation engines and scramjet, which is very challenging to resolve experimentally due to higher flow speeds (McFarland & Hagenmaier Reference McFarland and Mark2018; Duke-Walker et al. Reference Duke-Walker, Maxon, Almuhna and McFarland2021; Humble & Heister Reference Humble and Stephen2021; Prakash et al. Reference Prakash, Romain, Venkat, Jason and Kenneth2020). Operation of energy systems at supercritical conditions offers potential benefits, including enhanced fuel–air mixing, resulting in an increase in combustion efficiency (Chehroudi et al. Reference Chehroudi, Talley and Coy2002; Branam & Mayer Reference Branam and Wolfgang2003; Lin Reference Lin2011; Chehroudi Reference Chehroudi2012). This significant improvement is attributed to the dominance of supercritical gas-like (GL) diffusion mixing that replaces the classical atomisation and droplet evaporation occurring at subcritical conditions (Wu et al. Reference Wu, Tzong, Abdollah and Campbell1996; Chehroudi et al. Reference Chehroudi, Talley and Coy2002; Lin, Cox-Stouffer & Jackson Reference Lin, Cox-Stouffer and Jackson2006; Oschwald et al. Reference Oschwald, Smith, Branam, Hussong, Schik, Chehroudi and Talley2006; Chehroudi Reference Chehroudi2012; Manin et al. Reference Manin, Bardi, Pickett, Dahms and Oefelein2014a
; Falgout, Mattias Rahm & Mark Reference Falgout, Mattias Rahm and Mark2015; Crua, Manin & Pickett Reference Crua, Julien and Lyle2017; Poursadegh et al. Reference Poursadegh, Joshua, Michael and Robert2018). Realising the advantages of supercritical mixing and its impact on combustion efficiency necessitates a comprehensive understanding of fuel droplet breakup under supercritical conditions to enable controlling fuel–air mixing. The liquid fuel often at a subcritical temperature is introduced into an environment with pressures and temperatures exceeding the critical point of the individual components (Banuti Reference Banuti2015; Banuti et al. Reference Banuti, Raju and Ihme2016, Reference Banuti, Peter and Matthias2017). As a result, the droplet temperature increases from subcritical to supercritical temperatures. This behaviour is known as the ‘transcritical’ condition. On the phase diagram, the transcritical condition is characterised by crossing the pseudo-boiling (Widom) line (Banuti Reference Banuti2015; Banuti et al. Reference Banuti, Raju and Ihme2016, Reference Banuti, Peter and Matthias2017; Banuti Reference Banuti, Raju and Ihme2017; Raju et al. Reference Raju, Daniel, Peter and Matthias2017; Banuti 2020; Ly and Ihme Reference Ly and Matthias2024) that divides the supercritical region into liquid-like (LL) and GL states. The transition from LL to GL behaviour involves dramatic changes in transport and thermophysical properties, e.g. density drops and heat capacity rises, and surface tension reduces substantially (Brazhkin et al. Reference Brazhkin, Fomin, Ryzhov, Tsiok and Trachenko2018). Resolving transcritical behaviour is very challenging under high-pressure and high-speed conditions encountered in combustors due to the significant scale discrepancies that impede capturing the breakup and evaporation of microscopic droplets (Miller, Harstad & Bellan Reference Miller, Kenneth and Josette2001). Until recently, research on transcritical droplets has primarily focused on low-speed convective environments, where droplet vaporisation is influenced by viscous effects and heat conduction (Yang & Shuen Reference Yang, Nienchuan and Jian-Shun1994; Delplanque & Sirignano Reference Delplanque and Sirignano1995; Nomura et al. Reference Nomura, Ujiie, Rath, Sato and Kono1996; Zhang Reference Zhang2003; Chae, Yang & Yoon Reference Chae, Yang and Yoon2008; Zheng-Tao Deng Reference Zheng-Tao, Ron, Shenghun and San-Mou2012; Yang et al. Reference Yang, Yanfei, Yaoguang, Yue and Zhuoran2014; Gao et al. Reference Gao, Shichun, Cheng, Bin, Fenzhu and Yongling2015). Various studies have explored the behaviour of supercritical droplets, such as liquid oxygen in a supercritical hydrogen environment (Yang & Shuen Reference Yang, Nienchuan and Jian-Shun1994; Hsieh Reference Hsieh1996; Yang Reference Yang2000; Chae et al. Reference Chae, Yang and Yoon2008). A limited number of studies have considered transcritical droplet aerobreakup under high-speed conditions that involve the interaction of the droplet with a shockwave in a supercritical environment (Tudisco & Menon Reference Tudisco and Suresh2020; Boyd & Jarrahbashi Reference Boyd and Jarrahbashi2021a
; Zhang Reference Zhang and Yang2022; Zhang, Srinivasan, & Yang Reference Zhang, Navneeth and Suo2024). The authors’ prior research was pioneering in identifying the shock dynamics in transcritical shock-driven droplet breakup following a direct numerical simulation (DNS) approach (Boyd & Jarrahbashi Reference Boyd and Jarrahbashi2021a
,Reference Boyd and Jarrahbashi
b
). The authors have shown that transcritical droplet–shock interaction differs significantly from classical subcritical droplet–shock interaction (e.g. water droplet) and subcritical bubble–shock interaction mechanisms (e.g. helium or R22 bubble).
This shift in shock dynamics from diverging to converging and the consequent changes in droplet morphology observed in their simulation of transcritical droplet–shock interaction are attributed to the substantial changes in fluid properties. These include the speed of sound and density, transitioning from a LL to a GL state. Despite these recent attempts, the aerobreakup mechanisms and the breakup modes at transcritical conditions have remained unexplored.
One major complexity in modelling transcritical flows that have not been fully addressed to date is the surface tension effects that modify Weber and Ohnesorge numbers, two major controlling parameters of the breakup behaviour. Until very recently, the surface tension effects were commonly neglected in modelling transcritical jets, droplets and mixing layers by assuming surface tension vanishes near the critical point (Delplanque & Sirignano Reference Delplanque and Sirignano1995; Okong’o & Bellan Reference Okongo and Josette2004; Aggarwal, Yan, & Zhu Reference Aggarwal, Changlin and Guangsheng2002; Okong’o & Bellan Reference Okongo and Josette2010; Schmitt et al. Reference Schmitt, Laurent, Anthony and Bénédicte2010; Anitescu Reference Anitescu, Bruno and Tavlarides2012; Oefelein, Dahms, & Lacaze Reference Oefelein, Rainer and Guilhem2012; Dahms Reference Dahms and Oefelein2013; Oefelein et al. Reference Oefelein, Guilhem, Rainer, Anthony and Antony2014; Salimi Reference Salimi and Bahramian2014; Dahms Reference Dahms and Oefelein2015; Ruiz et al. Reference Ruiz, Lacaze, Oefelein, Mari, Cuenot, Selle and Poinsot2015; Qiu Reference Qiu and Reitz2015; Desantes Reference Desantes, García-Oliver, Pastor, Pandal, Baldwin and Schmidt2016; Matheis et al. Reference Matheis, Müller, Hickel and Pfitzner2020; Müller et al. Reference Müller, Christoph, Jan, Michael and Stefan2016; Banuti, Ma, & Ihme Reference Banuti, Peter and Matthias2017; Ma, Lv, & Ihme Reference Ma, Yu and Matthias2017; Poursadegh et al. Reference Poursadegh, Joshua, Michael and Robert2017; Ihme Reference Ihme, Ma and Bravo2018; Matheis & Hickel Reference Matheis and Hickel2018; Matheis Reference Matheis and Hickel2018; Agarwal Reference Agarwal and Trujillo2019; Kaario Reference Kaario, Vuorinen, Kahila, Im and Larmi2019; Ma PC Reference Ma, Wu, Banuti and Ihme2019; Ma, Wu, Jaravel, et al. Reference Ma, Hao, Daniel and Matthias2019; Rodriguez Reference Rodriguez, Rokni, Koukouvinis, Gupta and Gavaises2019; Wei et al. Reference Wei, Hongsheng, Maozhao, Ming and Meng2019; Phoevos Koukouvinisa Reference Phoevos, Alvaro, Carlos, Manolis and Lyle2020; Yang Reference Yang, Yi and Habchi2020). However, evidence from recent experiments (Manin et al. Reference Manin, Michele, Lyle, Dahms and Oefelein2014b ; Falgout et al. Reference Falgout, Mattias Rahm and Mark2015) and molecular dynamics (MD) simulations (Kaltz et al. Reference Kaltz, Lyle, Michael and Little1998; Kaltz Reference Kaltz1998; Micci and Long Reference Micci and Lyle2000; Micci, Kaltz, & Long Reference Micci, Kaltz and Lyle2001; Kaltz & Long Reference Kaltz and Lyle2001; Consolini, Aggarwal, & Murad 2003; Shin, Suh, & Yoon Reference Shin, Donguk and Woong-sup2008; Weathers et al. Reference Weathers, Aleksey, Yee and Ashvin2019) have shown that surface tension forces persist in multicomponent systems (e.g. fuel and air) above the critical pressure (Guiyuan Mo Reference Guiyuan and Li2017; Poursadegh et al. Reference Poursadegh, Joshua, Michael and Robert2017; Poursadegh et al. Reference Poursadegh, Joshua, Michael and Robert2018; Suman Chakraborty Reference Suman and Li2019), while in mono-component systems, surface tension effects completely disappear beyond the critical point (Raju et al. Reference Raju, Daniel, Peter and Matthias2017). Microscopic imaging of liquid hydrocarbon jets injected into supercritical nitrogen (Crua, Manin, and Pickett Reference Crua, Julien and Lyle2017) exhibits well-defined droplets with a sharp interface that morphs into a backward bag at moderately high pressure and temperatures (Crua, Manin, and Pickett Reference Crua, Julien and Lyle2017), exceeding the critical point of the components. This behaviour is linked to the persistence of surface tension forces at supercritical conditions. These droplets ranging between a 50–100-micron diameter remained visible for a few hundred microseconds under low relative flow speed (1–5 ms−1) after the end of the injection. Despite such evidence of the dominance of surface tension, only a limited number of studies (Poblador-Ibanez and Sirignano Reference Poblador-Ibanez and William2022; Poblador-Ibanez, Sirignano, and Hussain Reference Poblador-Ibanez, William and Fazle2024) have considered surface tension effects in modelling transcritical jets and mixing layers. This overlook is mainly due to the lack of theories and models that can accurately predict the surface tension behaviour at transcritical conditions. Recent studies have attempted to develop surface tension closure models for transcritical flows (Van der Waals Reference Van der and Johannes1979; Pecenko, Kuerten & van der Geld Reference Pecenko, Kuerten and van der Geld2010; Ly & Ihme Reference Ly and Matthias2024), which are subject to a complex implementation of the van der Waals diffuse interface theory into continuum simulations (Jofre and Urzay Reference Jofre and Javier2021). Alternatively, MD simulation emerges as a unique tool to determine the link between phase change and surface tension in transcritical flows as no prior assumption except for potential models of intermolecular forces are needed (Kaltz Reference Kaltz1998; Kaltz et al. Reference Kaltz, Lyle, Michael and Little1998; Micci & Long Reference Micci and Lyle2000; Kaltz & Long Reference Kaltz and Lyle2001; Micci, Kaltz, & Long Reference Micci, Kaltz and Lyle2001; Consolini, Aggarwal, & Murad Reference Consolini, Suresh and Sohail2003; Shin, Suh, & Yoon Reference Shin, Donguk and Woong-sup2008; Weathers et al. Reference Weathers, Aleksey, Yee and Ashvin2019). However, the implementation of surface tension coefficient calculated based on MD simulations that are constrained to nanoscale droplets, raises concerns when applied to microscale simulations.
The critical lack of understanding of droplet aerobreakup mechanisms and dominant breakup modes at transcritical conditions, key phenomena in predicting and controlling fuel–air mixing in high-pressure liquid–fuel injection, has motivated this study. In particular, this study delves into a comparative analysis of droplet aerobreakup modes at transcritical conditions by considering the surface tension effects at transcritical conditions that have been mainly neglected in modelling transcritical flows until very recently. The authors have shown that the surface tension coefficient calculated from MD simulations is weakly correlated with the droplet size and the MD-driven calculations are consistent with experimental measurements of surface tension coefficient (Jangale et al. Reference Jangale, Ehsan, Mohammad and Dorrin2024). This behaviour motivated the use of the MD-driven surface tension coefficient in modelling microscale droplets in this study. The surface tension coefficient is derived from a series of separate MD simulations of a transcritical n-dodecane droplet evaporating in a supercritical nitrogen environment conducted by authors (Jangale et al. Reference Jangale, Ehsan, Mohammad and Dorrin2024) and detailed in Appendix C. To this end, a single isolated microscopic n-dodecane droplet at a subcritical temperature is subjected to a planar shockwave passing through a supercritical nitrogen environment, representing transcritical conditions. It is noted that shockwaves are commonly used in the study of droplet aerobreakup to mimic the conditions at which the droplet is exposed to an accelerating stream (Goossens et al. Reference Goossens, Cleijne, Smolders and Van Dongen1988; Terashima & Tryggvason Reference Terashima and Grétar2009; Garrick, Hagen, & Regele Reference Garrick, Wyatt and Jonathan2017; Meng & Colonius Reference Meng and Tim2018). By controlling the shock strength, the post-shock conditions can create a wide range of flow speeds from subsonic to supersonic conditions. In this study we control the shockwave strength to create a subsonic flow passing over the droplets. We consider a constant surface tension by assuming that the droplet breakup occurs prior to droplet transition to a supercritical GL state under which surface tension fully vanishes. This assumption is supported by experiments that showed transition to GL diffusion occurs at a much higher pressure and temperature (Crua, Manin, and Pickett Reference Crua, Julien and Lyle2017). We focus on n-dodecane for the droplet material as it is commonly used as a surrogate fuel for kerosene and diesel fuel in the combustion community (Honnet et al. Reference Honnet, Kalyanasundaram, Ulrich and Norbert2009; Zhong and Peng Reference Zhong and Hui-Sheng2019). The present study employs a diffuse interface method (DIM) in a two-dimensional (2-D) axisymmetric framework (Anderson, McFadden, & Wheeler Reference Anderson, Geoffrey and Adam1998; Jamet et al. Reference Jamet, Lebaigue, Coutris and Delhaye2001), which treats the interface as a thin fluid layer with continuous variation in fluid properties using a standard four-equation model closed by Peng-Robinson equation of state (PR-EoS) to capture the real-gas effects (Boyd & Jarrahbashi Reference Boyd and Jarrahbashi2021b ). Surface tension force are implemented into the governing equations following the model proposed by Garrick et al. (Reference Garrick, Wyatt and Jonathan2017), with surface tension coefficient obtained from MD simulations. The flow solver has been developed in-house and validated against several test cases at transcritical conditions as detailed in the authors’ earlier studies (Boyd & Jarrahbashi Reference Boyd and Jarrahbashi2021a ,Reference Boyd and Jarrahbashi b ). A new hybrid scheme that switches from a FC to a double-flux (DF) method developed by the authors is used to limit the spurious pressure oscillations common in modelling transcritical flows. The major outcome of this analysis is identifying the aerobreakup mechanisms of transcritical droplets under surface tension effects, proposing the first aerobreakup regime map for transcritical droplets considering a wide range of supercritical conditions. The breakup behaviour is compared with the subcritical aerobreakup modes.
The paper is structured as follows: numerical modelling including the surface tension effects with PR-EoS and stiffened equation of state (ST-EoS) are discussed in § 2. Section 3 presents the computational set-up with the simulation domain and the controlling parameters for a wide range of density ratios and Weber numbers. The findings are elaborated upon in § 4. Emphasis is placed on the disparities observed between transcritical and subcritical droplet aerobreakup. Additionally, the impact of surface tension on transcritical droplets is explored in comparison to scenarios where surface tension effects are disregarded. The differences observed in breakup behaviour using PR-EoS as compared with the ST-EoS are illustrated. The transcritical breakup modes are discussed and a breakup regime map for droplet aerobreakup modes is presented. Finally, a quantitative analysis of the droplet deformation rate and breakup time is conducted to complement our understanding of the aerobreakup behaviour observed at different transcritical conditions. § 5 presents the summary and conclusions.
2. Numerical modelling
2.1. Governing equations
An interface-capturing DIM (Anderson, McFadden, and Wheeler 1998; Jamet et al. Reference Jamet, Lebaigue, Coutris and Delhaye2001) is employed in this study by combining a multicomponent flow model with a shock-capturing finite-volume method. These techniques are referred to as DIMs, as they do not explicitly track sharp interfaces, allowing for numerical diffusion at the interface. The DIM has been commonly used for modelling transcritical flows as it aligns well with observations that the interface thickness increases near the critical point (Ma, Lv, and Ihme Reference Ma, Yu and Matthias2017; Bravo et al. Reference Bravo, Peter, Matthias and Kevin2018; Ma Reference Ma, Wu, Banuti and Ihme2019; Ma, Wu, Banuti et al. Reference Ma, Wu, Banuti and Ihme2019). This approach ensures conservation, and thermodynamic consistency in mixture cells, and handles dynamically appearing or disappearing interfaces. The DIM offers several advantages over sharp-interface methods (SIMs) such as volume-of-fluid (VOF, Li, Renardy, and Renardy Reference Li, Yuriko and Michael2000; Sun & Tao Reference Sun and Tao2010), front-tracking (Unverdi & Tryggvason Reference Unverdi and Grétar1992; Tryggvason et al. Reference Tryggvason, Bernard, Asghar, Damir, Al-Rawahi, Tauber, Han, Nas and Jan2001; Terashima & Tryggvason Reference Terashima and Grétar2009) and level-set methods (Chang et al. Reference Chang, Hou, Merriman and Osher1996; Sussman & Puckett Reference Sussman and Elbridge2000). The SIM often involves loss of mass conservation and requires implementing complex interfacial boundary conditions. In addition, adapting the SIM to compressible supercritical flows involving phase change proves highly complex (Fuster Reference Fuster2019). Moreover, the DIM typically offers higher efficiency compared with its interface-tracking counterparts, which is crucial for addressing multiscale problems. In this study, a 2-D compressible, multiphase and multicomponent model of immiscible fluids in mechanical equilibrium is developed to consider the effects of surface tension and viscosity on transcritical breakup. The governing equations for a diffuse interface two-species system are as follows:
 \begin{align} \frac{\partial \rho }{\partial t} &+\boldsymbol{\nabla }\boldsymbol{\cdot }\left(\rho \boldsymbol{u}\right)=0, \end{align}
 \begin{align} \frac{\partial \left(\alpha _{D}\rho \right)}{\partial t} &+\boldsymbol{\nabla }\boldsymbol{\cdot }\left(\alpha _{D}\rho \boldsymbol{u}\right)=0, \end{align}
 \begin{align} \frac{\partial \left(\rho \boldsymbol{u}\right)}{\partial t}+\boldsymbol{\nabla }\boldsymbol{\cdot } & \left(\rho \boldsymbol{u}\otimes \boldsymbol{u}+p\boldsymbol{I}-\boldsymbol{T}\right)=\sigma \kappa \boldsymbol{\nabla }\alpha _{D}, \end{align}
 \begin{align} \frac{\partial E}{\partial t}+\boldsymbol{\nabla }\boldsymbol{\cdot } & \left(\boldsymbol{u}\left(E+p\right)-\boldsymbol{T}\boldsymbol{\cdot }\boldsymbol{u}\right)=\sigma \kappa \boldsymbol{u}\boldsymbol{\cdot }\boldsymbol{\nabla }\alpha _{D}, \end{align}
where
 $\alpha _{D}$
and
 $\alpha _{s}$
are the volume fraction of the droplet fluid species and the surroundings, respectively. Here
 $\rho$
is the density,
 $\boldsymbol{u}$
is the velocity vector,
 $p$
is the pressure,
 $\boldsymbol{T}$
is the viscous stress tensor,
 $E$
is the total energy defined as
 $E=\rho (e+({| \boldsymbol{u}| ^{2}}/{2}))$
, where
 $e$
is the internal energy,
 $\sigma$
is the surface tension coefficient,
 $\kappa$
is the local interface curvature and
 $\boldsymbol{I}$
is the identity matrix. The viscous stress tensor is given as
 $\boldsymbol{T}=2\mu (\boldsymbol{D}-({1}/{3})(\boldsymbol{\nabla }\boldsymbol{\cdot }\boldsymbol{u})\boldsymbol{I})$
, where
 $\mu$
is the viscosity and
 $\boldsymbol{D}=({1}/{2})(\boldsymbol{\nabla }\boldsymbol{u}+(\boldsymbol{\nabla }\boldsymbol{u})^{T})$
is the deformation rate tensor. The second (bulk) viscosity is not considered. The mass fraction of the second species of the two-component system (D and S representing the droplet and the surrounding fluids, respectively) is given by the mixture rule
 $\alpha _{S}=1-\alpha _{D}$
. Two different systems of equations are employed to close the system for which the mixing rules are described in Appendices A1–A3. The surface tension is implemented as a volume force through the continuum surface force (CSF) model following the method suggested by Garrick et al. (Reference Garrick, Mark and Jonathan2017). The source terms on the right-hand side of (2.3) and (2.4) consider the surface tension effects (Perigaud and Saurel Reference Perigaud and Richard2005; Garrick, Owkes, and Regele Reference Garrick, Mark and Jonathan2017) with an induced pressure jump calculated as
 ${\Delta} p_{k}=\sigma \kappa {\Delta} \alpha _{D}$
. The local interface curvature (
 $\kappa$
) is determined using the interface normal that is described as a function of the mass fraction as
 $\kappa =-\boldsymbol{\nabla }\boldsymbol{\cdot }\boldsymbol{n}=-\boldsymbol{\nabla }\boldsymbol{\cdot }({\boldsymbol{\nabla }\alpha _{D}}/{| \boldsymbol{\nabla }\alpha _{D}| })$
. The curvature is calculated by computing the normal vector (
 $\boldsymbol{n}$
) using the fourth-order central difference method. A second-order central difference scheme is employed to determine the curvature. Finally, the curvature is extended outwards from the interface centre (
 $\alpha _{D}=0.5$
) using 10 iterations of the filtering procedure (Garrick, Owkes, and Regele Reference Garrick, Mark and Jonathan2017). Additionally, the Harten–Lax–van Leer-contact (HLLC) flux is modified to include the pressure jump due to the capillary force following the procedure outlined in Garrick, Owkes, and Regele (Reference Garrick, Mark and Jonathan2017). Prior studies have used compressible flow models with both conservative and non-conservative models for surface force (Perigaud and Saurel Reference Perigaud and Richard2005; Braconnier and Nkonga Reference Braconnier and Boniface2009; Le Martelot, Saurel & Nkonga Reference Le Martelot, Saurel and Nkonga2014; Shukla Reference Shukla2014). It is noted that in this study, the non-conservative form of the CSF model is chosen, which enables flexible treatment of the curvature term without a loss in accuracy. This formulation computes the surface tension as a volumetric force based on the gradient of the volume fraction
 $\alpha _{D}$
. The normal vector and curvature at the interface are calculated directly from
 $\alpha _{D}$
, making the uniformity of
 $\alpha _{D}$
crucial for accurate results. To mitigate the distortions in the
 $\alpha _{D}$
field and ensure accurate curvature computation, we incorporated the tangent of hyperbola interface-capturing (THINC) method (Garrick, Hagen, and Regele Reference Garrick, Wyatt and Jonathan2017). This method sharpens the interface and reduces numerical diffusion, thereby improving the representation of
 $\alpha _{D}$
gradients. The curvature calculation utilises a four-point quadrature formulation introduced by Garrick, Owkes, and Regele (Reference Garrick, Mark and Jonathan2017), which has been shown to improve accuracy by considering higher-order variations in
 $\alpha _{D}.$
As we will show in this study, the choice of
 $\alpha _{D}$
imposes minimal impact on the detected breakup modes.
The ST-EoS is given in (2.5) as follows:
 \begin{equation}\varGamma p+\varPi =E-\frac{1}{2}\rho \left| \boldsymbol{u}\right| ^{2}.\end{equation}
Here
 $\varGamma ={1}/{\gamma -1}$
,
 $\varPi ={\gamma \pi _{\infty }}/{\gamma -1}$
,
 $\gamma$
and
 $\pi _{\infty }$
are fluids properties.
The PR-EoS (Peng and Robinson Reference Peng and Donald1976) is as follows:
 \begin{equation}p=\frac{R_{U}T}{V_{m}-b}-\frac{a}{V_{m}^{2}+2bV_{m}-b^{2}}.\end{equation}
Here
 $T$
is the temperature,
 $R_{U}$
is the universal gas constant,
 $V_{m}$
is the molar volume defined as
 $V_{m}={M}/{\rho }$
,
 $M$
is the molar mass and
 $a$
and
 $b$
are coefficients that depend on the state and composition of the fluid. The mixing rules are selected based on the suggestions given by Ma et al. (Reference Ma, Yu and Matthias2017). The coefficients
 $a$
and
 $b$
in (2.6) are evaluated as
 $a=\sum_{D=1}^{2}\,\sum _{S=1}^{2}\,\alpha _{D}\alpha _{S}a_{\textit{DS}} \text{ and }b=\sum _{D=1}^{2}\,\alpha _{D}b_{D}$
, where the coefficients
 $a_{\textit{DS}}$
and
 $b_{D}$
are calculated using the following equations (D and S representing the droplet and surrounding fluids, respectively):
 \begin{align} a_{\textit{DS}} &=0.457236\frac{\left(RT_{\textit{c,DS}}\right)^{2}}{p_{\textit{c,DS}}}\left(1+c_{\textit{DS}}\left(1-\sqrt{\frac{T}{T_{\textit{c,DS}}}}\right)\right)^{2}, \qquad b_{D}=0.077796\frac{RT_{\textit{c,D}}}{p_{\textit{c,D}}}; \end{align}
 \begin{align} c_{\textit{DS}} &=0.37464+1.54226\omega _{\textit{DS}}-0.26992\omega _{\textit{DS}}^{2}. \end{align}
The critical mixture conditions for temperature, pressure, molar volume, compressibility and acentric factors are determined as
 \begin{align} T_{\textit{c,DS}} &=\sqrt{T_{\textit{c,D}}T_{c,S}}\left(1-k_{\textit{DS}}\right), \qquad \!\!\!\! p_{\textit{c,DS}}=Z_{\textit{c,DS}}\frac{RT_{\textit{c,DS}}}{v_{\textit{c,DS}}},\qquad \!\!\!\! v_{\textit{c,DS}}=\frac{1}{8}\left(v_{\textit{c,D}}^{\tfrac{1}{3}}+v_{c,S}^{\tfrac{1}{3}}\right)^{3}; \end{align}
 \begin{align} Z_{\textit{c,DS}} &=\frac{1}{2}\left(Z_{\textit{c,D}}+Z_{c,S}\right),\qquad \omega _{\textit{DS}}=\frac{1}{2}\left(\omega _{D}+\omega _{S}\right), \end{align}
where R is the universal gas constant,
 $T_{c}$
is the critical temperature,
 $p_{c}$
is the critical pressure,
 $v_{c}$
is the critical molar volume,
 $Z_{c}$
is the critical compressibility factor,
 $k_{\textit{DS}}$
is the binary interaction parameter and
 $\omega$
is the acentric factor. The parameters for the NASA polynomials used to determine the internal energy, enthalpy and entropy are adopted from McBride (Reference McBride1993). The PR-EoS is modified to approximate the state of the fluid in the vapour dome region to increase the robustness of the numerical method following a method suggested by Knudsen et al. (Reference Knudsen, Doran, Mittal, Meng and Spurlock2017) and outlined in Appendix A2. Phase separation can occur at the interface; however, the approximation has an insignificant influence on the shock transmission across the fluid interface as these regions are small. At such conditions, if the temperature becomes relatively low, the equation of state returns negative pressures and the speed of sound may become complex valued in the vapour dome for certain density values. To remedy these problems, the pressure is given by an approximate saturation pressure of the mixture that limits the speed of sound to 1 ms−1. The modified PR-EoS approach is an alternative approach to the vapour–liquid equilibrium method commonly used to account for phase separation that poses significant complexities and additional computational costs (Matheis & Hickel Reference Matheis and Hickel2018; Rodriguez Reference Rodriguez, Rokni, Koukouvinis, Gupta and Gavaises2019). The modified PR-EoS approach employed in our earlier study (Boyd & Dorrin Reference Boyd and Jarrahbashi2021b
) deemed effective in remedying the common problem of spurious pressure oscillations emerging at transcritical conditions.
2.2. Numerical approach
This study uses the DIMP code, which is an in-house, density-based, finite-volume solver in C++ parallelised using domain decomposition and message passing interface (MPI) (Boyd & Dorrin Reference Boyd and Jarrahbashi2021b ). The solver has been validated and verified in various configurations including classical bubble–shock and droplet–shock interaction and liquid–gas shock tube problems (Boyd & Dorrin Reference Boyd and Jarrahbashi2021b ). Therefore, we do not provide validation cases here for brevity. In our earlier study (Boyd & Dorrin Reference Boyd and Jarrahbashi2021b ), we introduced a hybrid numerical approach (HY), which switches between the fully conservative (FC) method and the DF techniques based on the changes in the effective specific heat ratio and the effective reference internal energy. The HY model was shown to effectively reduce the loss of energy conservation inherited in the DF method while controlling the spurious pressure oscillations and reducing the high computational costs associated with the FC method. We have shown that the HY method provides more accurate results for transcritical shock tube problems, transcritical jets and droplet–shock interaction. In this study we opt for the HY method due to its demonstrated ability to reduce pressure oscillations and preserve energy conservation during shock interactions with the nitrogen-n-dodecane interface. To enhance the solver stability and robustness and prevent characteristic field interactions, we perform primitive variable reconstruction in the characteristic space, employing characteristic-wise reconstruction as detailed in our earlier study (Boyd & Jarrahbashi Reference Boyd and Jarrahbashi2021a ).
The temporal discretisation of (2.1)–(2.4) uses the third-order total-variation-diminishing Runge–Kutta scheme (RK3-TVD) (Gottlieb and Shu Reference Gottlieb and Chi-Wang1998) in explicit form with a Courant–Friedrichs–Lewy (CFL) number equal to 0.8. The HLLC approximate Riemann flux is used to determine the Godunov flux at the cell interfaces as detailed in Appendices A4–A8 (Johnsen and Colonius Reference Johnsen and Tim2006; Boyd and Becker Reference Boyd and Sid2018, Reference Boyd and Sid2019). Additionally, the maximum-principle-satisfying and positivity-preserving flux limiter is used to ensure the boundness of the mass fraction and the positivity of density and pressure (Zhang and Shu Reference Zhang and Chi-Wang2011; Boyd and Becker Reference Boyd and Sid2018, Reference Boyd and Sid2019). The present model neglects thermal conduction and chemical reactions. The molecular diffusion is expected to be negligible as it has been shown in earlier studies (Ma, Wu, Banuti et al. Reference Ma, Wu, Banuti and Ihme2019) that the diffuse effects are typically less than the numerical diffusion of the numerical model, and thus, no additional insight is gained by the inclusion of the diffuse terms. In the absence of molecular viscosity and given the shock- and interface-capturing nature of the numerical method, numerical viscosity is present in all simulation results. The magnitude of the numerical viscosity is dependent on the spatial resolution. It is generally accepted that inviscid simulations, i.e. those performed without considering molecular viscosity using shock- and interface-capturing schemes, inherently include numerical viscosity (Garrick, Owkes, & Regele Reference Garrick, Mark and Jonathan2017; Meng & Colonius Reference Meng and Tim2018; Ma, Wu, Banuti, et al. Reference Ma, Hao, Daniel and Matthias2019). However, to ensure that the exclusion of thermal conduction does not influence the breakup dynamics, viscosity is included in the simulations, and the potential impacts of thermal conduction are thoroughly examined in Appendix F. The interfaces are allowed to numerically diffuse, resulting in an interface region of small, but finite thickness. For numerical stability purposes, material interfaces are not initialised as sharp discontinuities but are smeared over a few grid cells that have negligible impact on the computation. Following our earlier study (Boyd & Becker Reference Boyd and Sid2019), artificial interface thickening is added to the initial state of the droplet interface in axisymmetric cylindrical coordinates with a value of
 $ \beta $
= 1, where
 $ \beta $
represents the number of finite-volume cells over which the interface is initially spread. The thickening of the interface diminishes the discontinuity in properties across cells, resulting in decreased pressure oscillations and enhanced numerical stability. Furthermore, interface thickening reduces the extent of energy conservation loss when employed alongside a quasi-conservative method such as the HY method used in this study. As the droplet is defined on a uniform mesh, the interfacial thickening also aids in smoothening the initial curvature of the droplet. For the reconstruction of the primitive variables, a second-order-accurate MUSCL (monotonic upstream-centred scheme for conservation law) scheme in conjunction with the THINC method (
 $\rho -\text{THINC}$
) (Garrick, Hagen, and Regele Reference Garrick, Mark and Jonathan2017) interface-sharpening technique is employed to minimise interface diffusion. The interface shape parameter for the THINC method is set to
 $\beta =1$
, which is consistent with the initial smoothing function. Appendix B shows that the interface is sharply captured as a result of the THINC interface-sharpening method.
2.3. Implementing surface tension effects
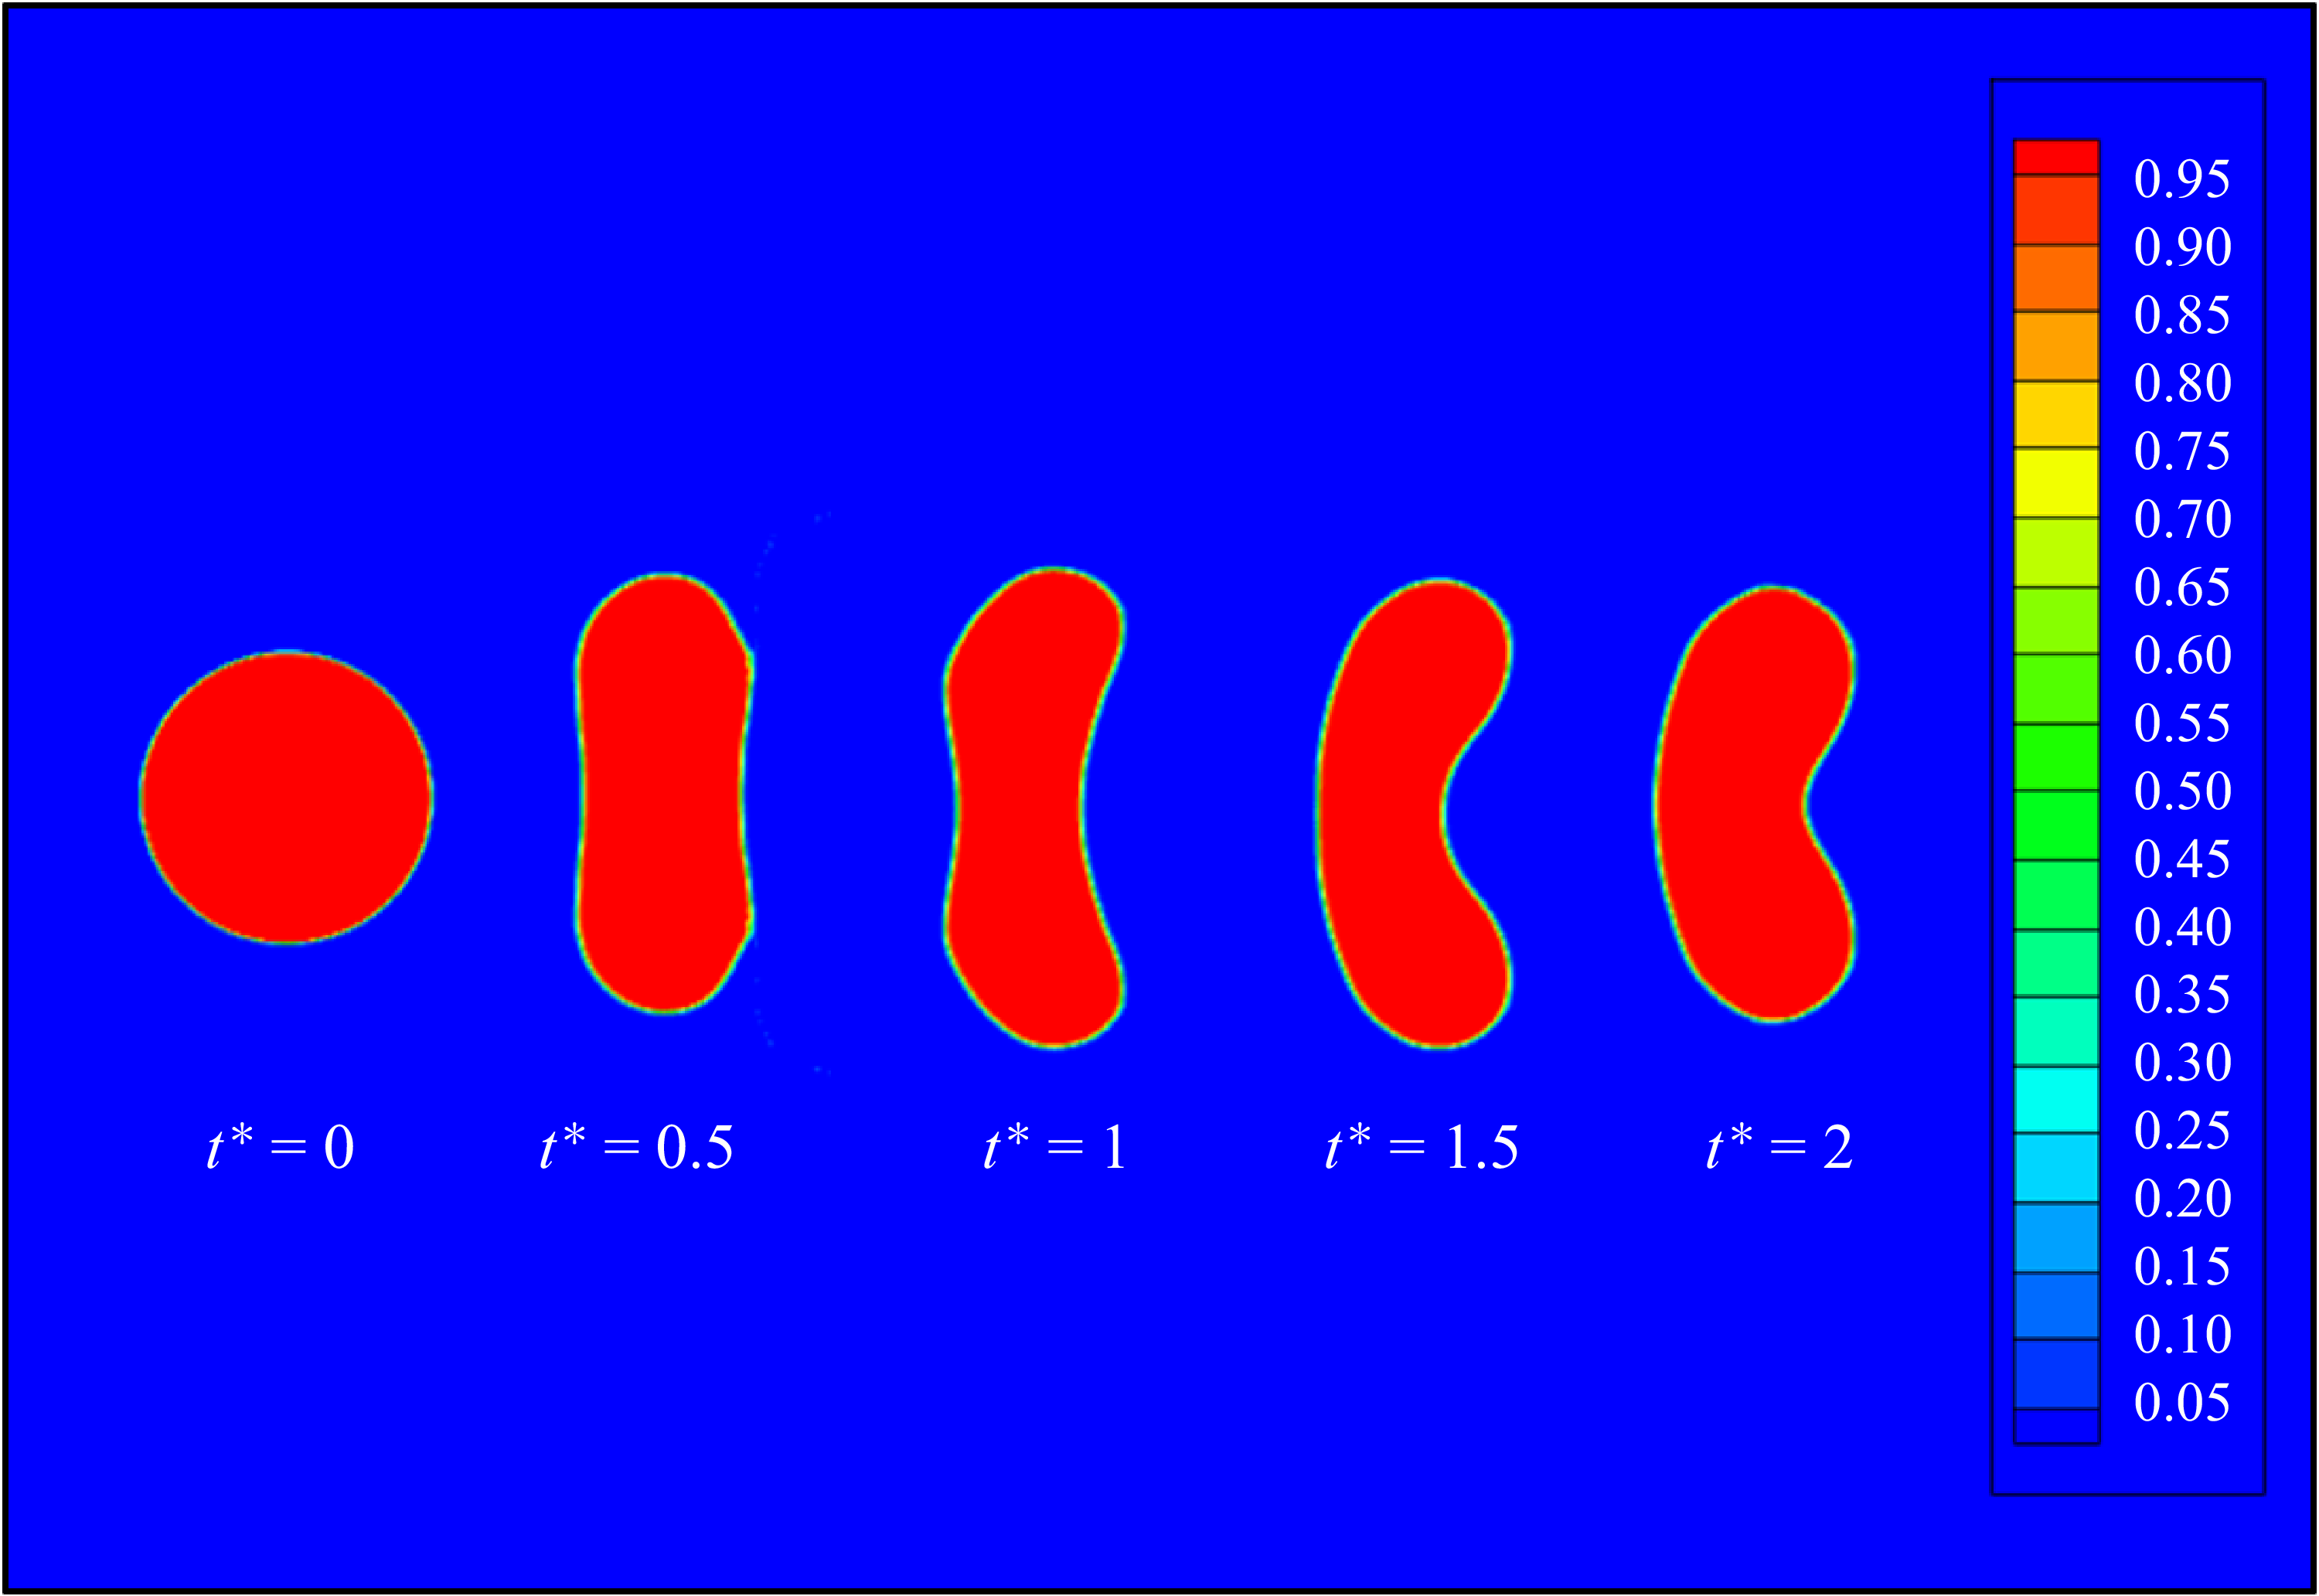
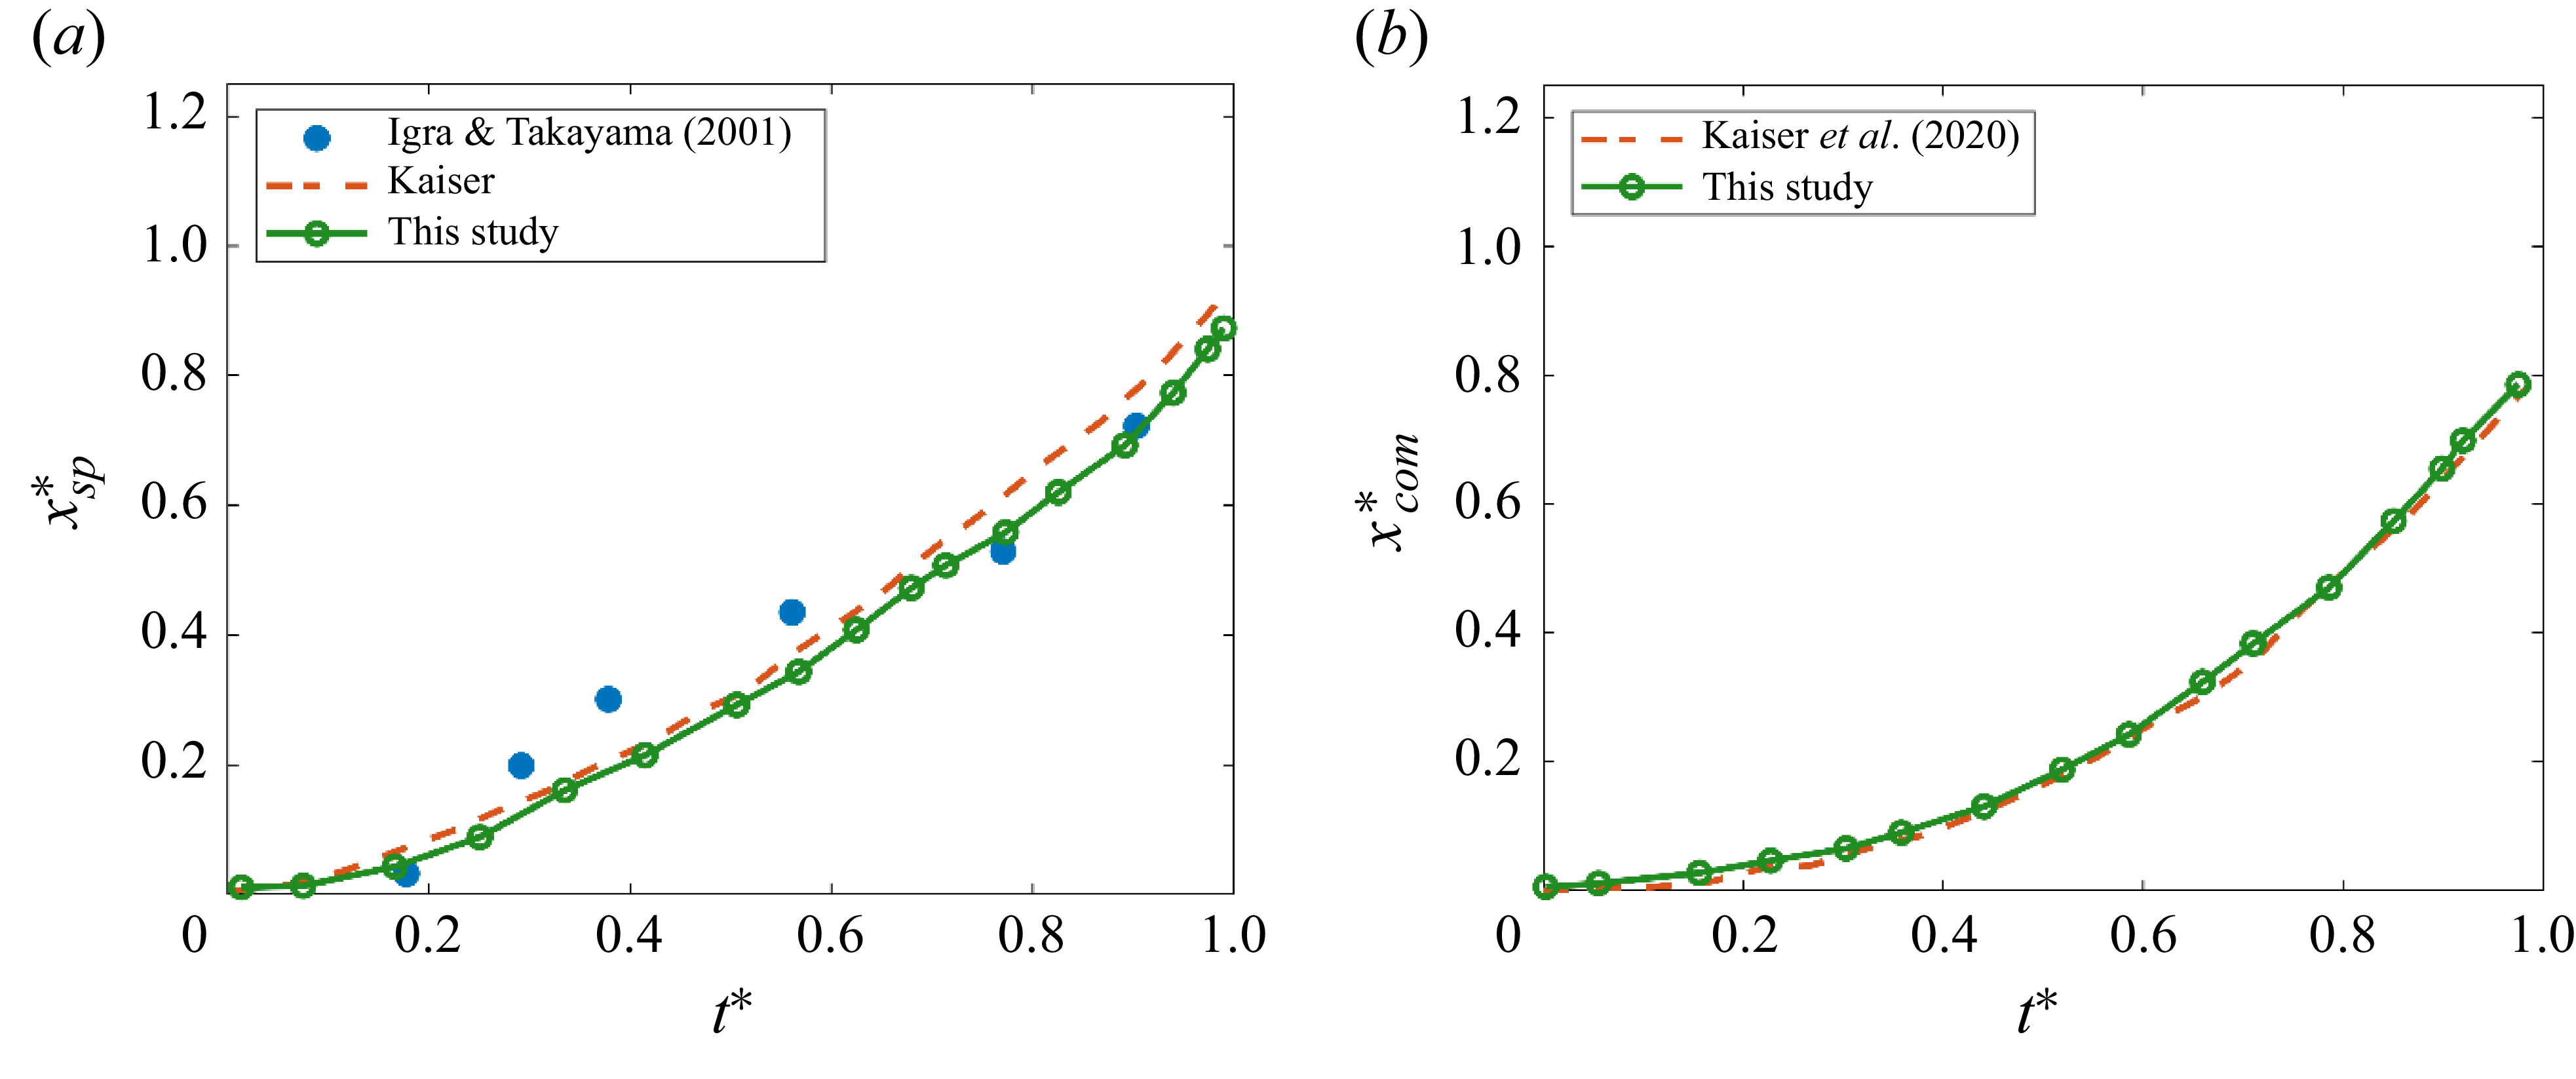
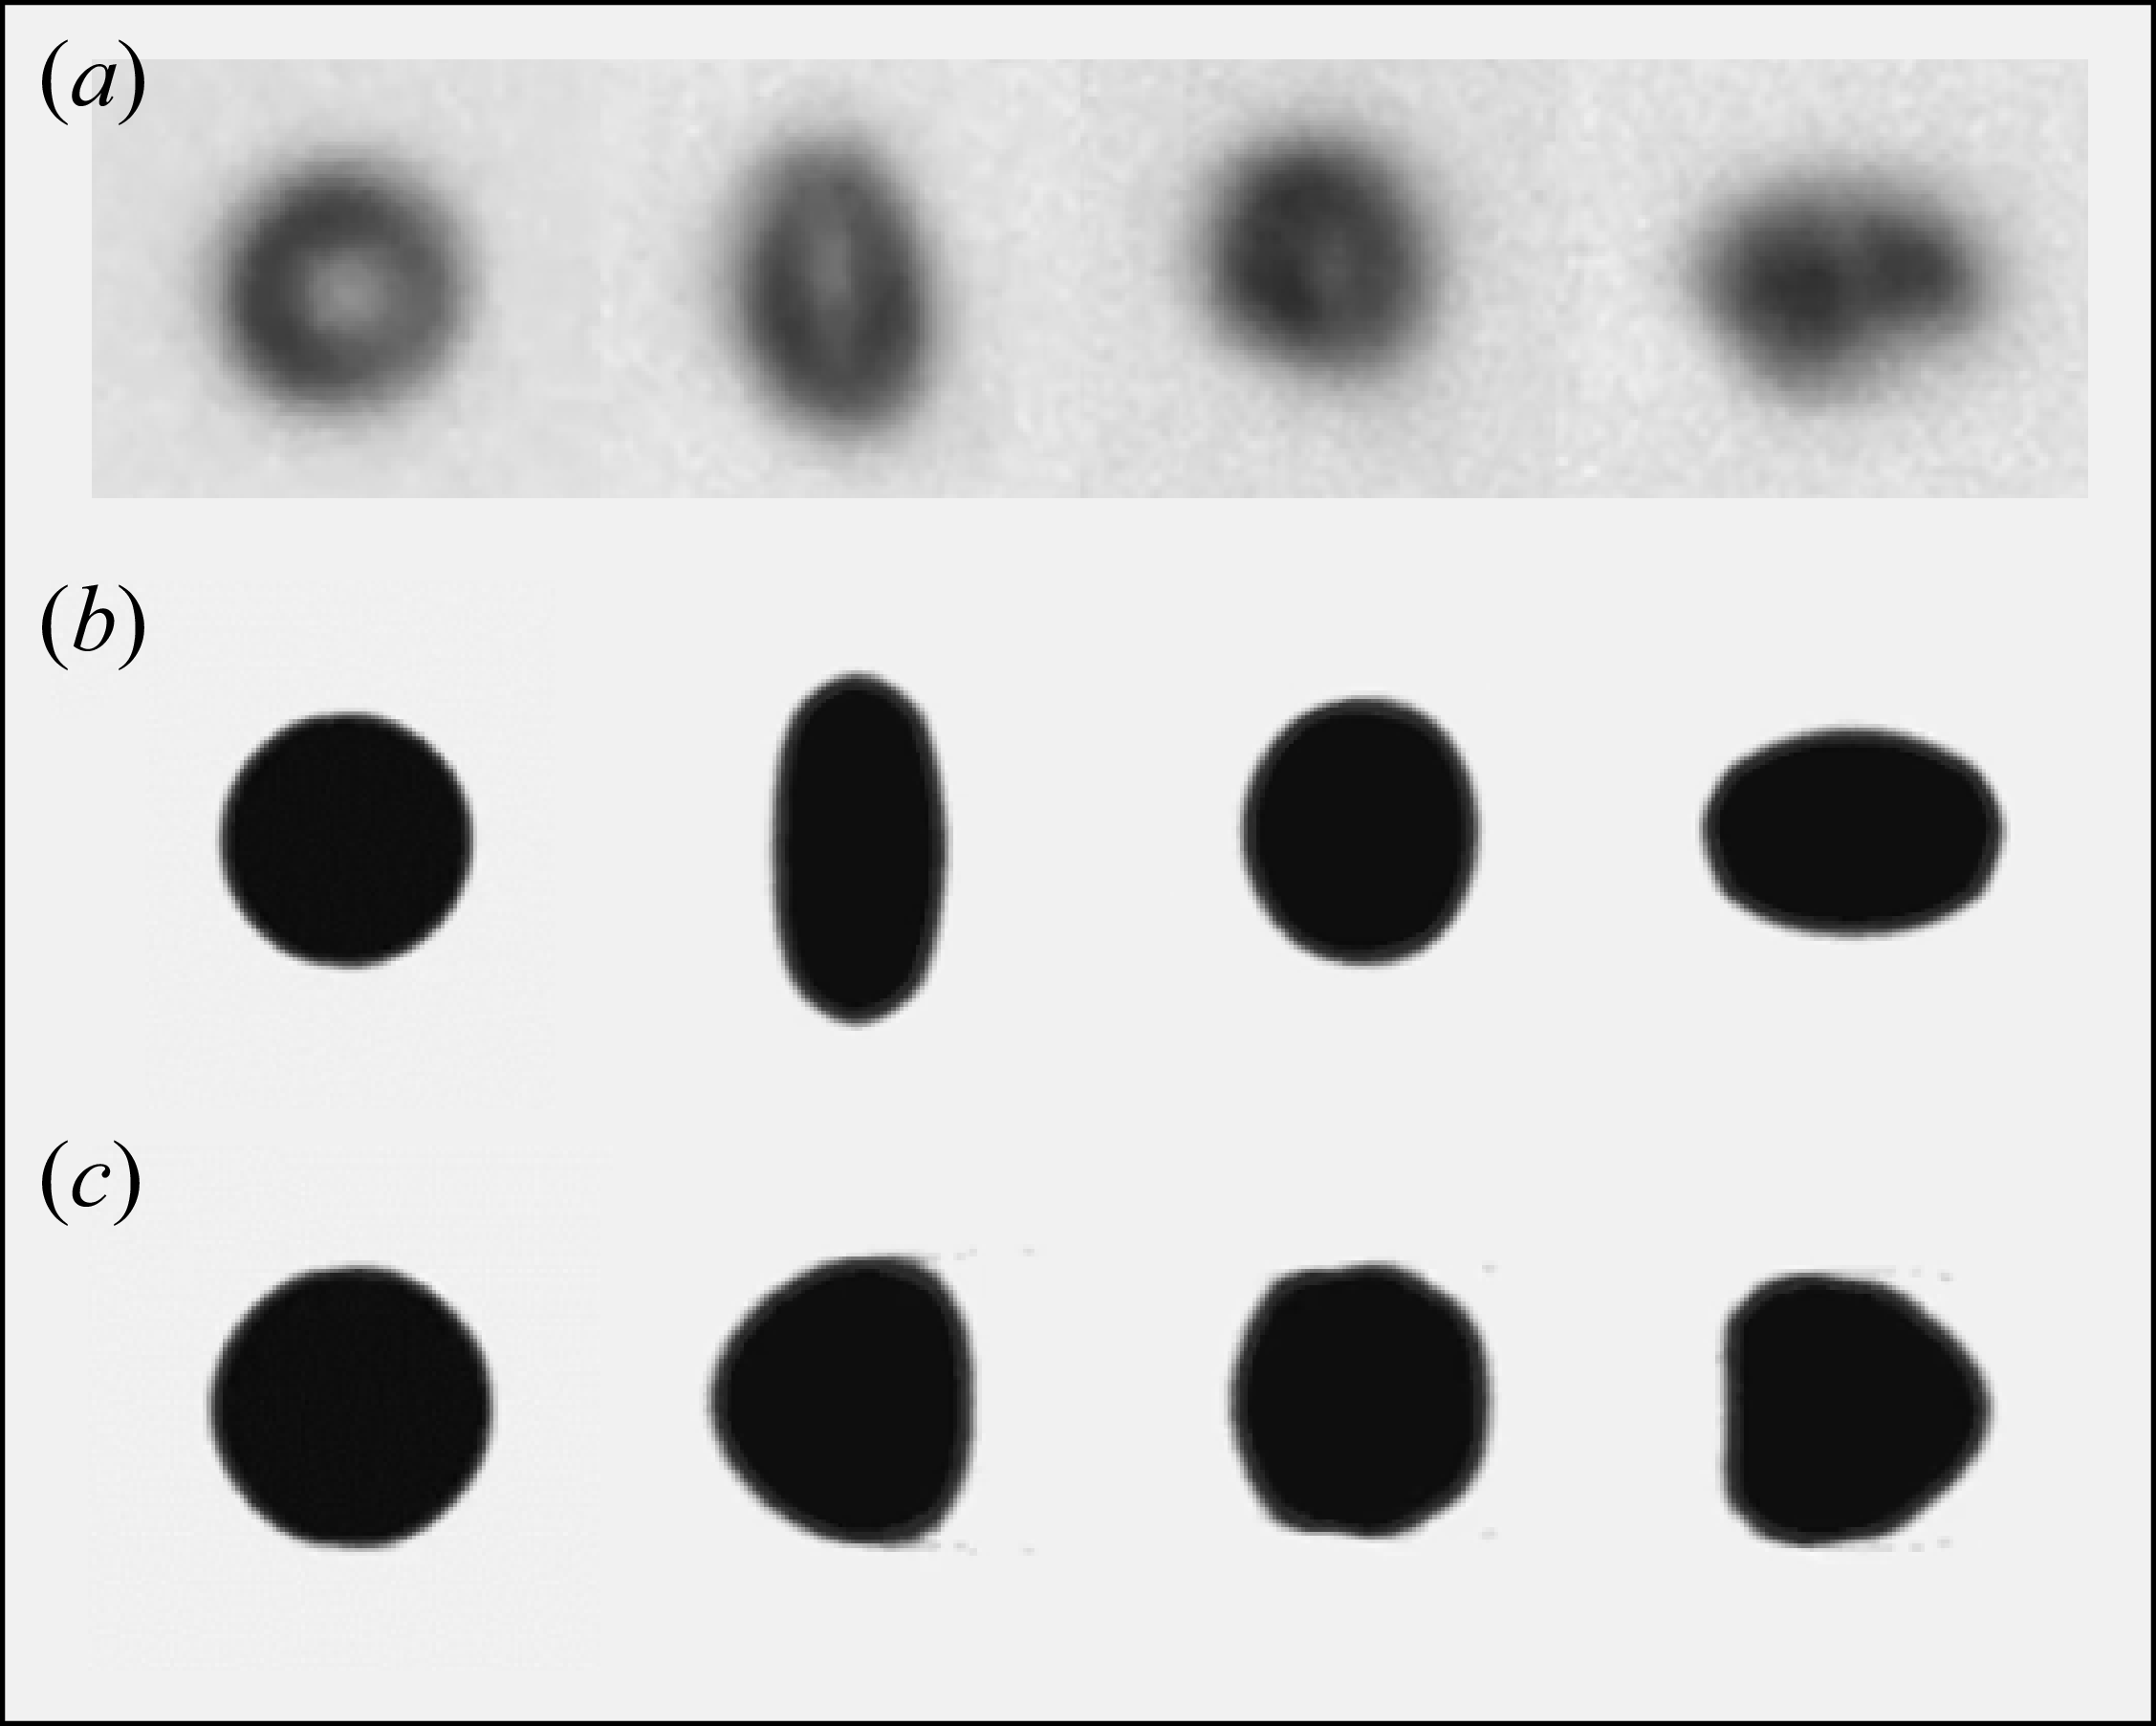
The surface tension coefficient is adopted from separate MD simulations conducted by the authors, which represents the behaviour of a nanoscale n-dodecane droplet exposed to a quiescent supercritical nitrogen environment considering different initial conditions (Jangale et al. Reference Jangale, Ehsan, Mohammad and Dorrin2024). The details of surface tension calculation using MD simulations are described in Appendix C and detailed in Jangale et al. (Reference Jangale, Ehsan, Mohammad and Dorrin2024). In this study the surface tension is calculated based on the initial conditions, i.e. background nitrogen pressure and temperature that vary among different cases, keeping the droplet temperature constant at 363 K for all cases detailed in table 1. We assume a constant surface tension, calculated based on the initial conditions, with the assumption that the droplet breakup occurs more rapidly than the transition to a fully supercritical state. This implies that the transition to the GL supercritical phase, where surface tension vanishes, is never reached during the breakup process. This is consistent with Crua et al. (Reference Crua, Julien and Lyle2017) experiments that showed droplets remained under the control of surface tension for a finite time except for very high pressures and temperatures at which the droplet transitions to a supercritical GL diffusion regime. Therefore, the simulations assume that the droplet breaks up due to the passage of the shockwave through the interface before the droplet is fully transitioned to a supercritical GL state. This assumption is further justified based on the simulation results (refer to Appendix B) that indicate the variation of density inside the droplet during the shock passage is not significant and the droplet remains in a LL state throughout the breakup process. We have shown in Appendix C that surface tension coefficient at transcritical conditions is strongly correlated with the background temperature and is not dependent on the droplet size. This behaviour justifies the use of the MD-driven surface tension coefficient in modelling microscale droplets. The surface tension effects are included in the momentum and energy equation source terms ((2.3) and (2.4)) as discussed in § 2.1. The oscillation behaviour of an initial ellipsoidal droplet (Perigaud and Saurel Reference Perigaud and Richard2005) subject to surface tension forces is used to validate the surface tension modelling procedure. The predicted droplet oscillations are validated against the global kinetic energy and theoretical period of oscillation as detailed in Appendix D. In addition, two validation cases are discussed in Appendix H: (i) water droplet–shock interaction at Mach 1.47 compared with experiments of Igra & Takayama (Reference Igra and Takayama2001) , and (ii) transcritical droplet morphology exposed to a low-speed convective flow compared with the experiments conducted by Crua et al. (Reference Crua, Julien and Lyle2017). Simulations show reasonable agreement with the experiments.
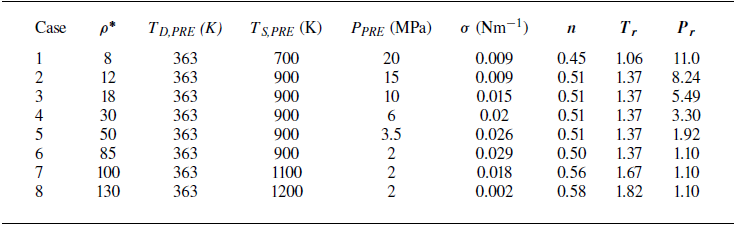
Operating conditions including n-dodecane droplet and nitrogen surrounding temperature and pressure, density ratio (ρ
* =
 ${\rho _{D}}/{\rho _{\textit{POST}}}$
), surface tension coefficient (σ), the speed of sound ratio (n), reduced pressure (
 $P_{r}$
) and reduced temperature (
 $T_{r}$
).

3. Computational set-up
The secondary atomisation of a liquid droplet, also known as aerobreakup, occurs when a liquid droplet is subject to a high-velocity gas stream. To create such conditions, a planar shockwave is commonly utilised due to its simplicity, reliability and repeatability in both experimental set-ups and simulations. In this study, a normal shockwave travels from left to right in a nitrogen environment impacting an initially at-rest n-dodecane droplet with a droplet diameter of D = 50 µm. The incident shockwave is initiated as a discontinuity in fluid properties at z = −150 µm. The shockwave travels to the right towards the droplet. A 2-D axisymmetric cylindrical coordinate is adopted to reduce the high computational costs of three-dimensional (3-D) models. As we are focusing on detecting the early stages of droplet breakup to identify the breakup modes, the 2-D analysis would suffice; however, a full 3-D framework is required to capture the later stages of droplet breakup including the ligament formation and ligament breakup, particularly at higher Weber numbers pertaining to the SIE breakup regime (Dorschner et al. Reference Dorschner, Luc, Kevin, Hazem and Tim2020), which is beyond the scope of this study. The computational domain is extended in the axial and radial directions as [−5D, 5D] × [−4D, 4D], as shown in figure 1. The selection of the domain size is determined through sensitivity analyses to ensure the size of the computational domain is sufficiently large to avoid the interaction of potential erroneous reflections from the non-reflective boundaries with the droplet throughout the simulations. The computational domain consists of a uniform mesh from [−3D, 3D] and from the axis of symmetry to [−3D, 3D] to increase the computational speed of the simulation, whereas the grid size grows at a rate of 10 % in the z and r directions to the outer boundaries. A grid sensitivity analysis is outlined in Appendix E. Due to the axis of symmetry boundary condition, only the top half of the depicted computational domain is required for the simulation. A transmissive boundary condition is used at left, right and outer boundaries. The initial state of the three regions, (i) pre-shock, (ii) post-shock, and (iii) the n-dodecane droplet are as
 \begin{equation}\left(Y_{D},\, u_{z},\, p,\, T,\rho \right)=\begin{cases} \left(0,\, 0,\, p_{\textit{PRE}},\, {\textrm{T}}_{\textit{PRE}},\, \rho _{\textit{PRE}}\right) & \text{(pre-shock)},\\\left(0,\, u_{z,\textit{POST}},\, p_{\textit{POST}},\, {\textrm{T}}_{\textit{POST}},\, \rho _{\textit{POST}}\right) & \text{(post-shock)},\\\left(1,0,p_{\textit{PRE}},\, {\textrm{T}}_{\textit{PRE}},\, \rho _{D}\right) & \text{(droplet)} .\end{cases}\end{equation}
Initial set-up of the droplet–shock interaction indicating the grid distribution and the applied boundary conditions.

It is noted that
 $u_{z}$
is the velocity component in the z direction and the initial velocity in the r direction
 $(u_{r})$
is zero everywhere.
Phase diagram for n-dodecane–nitrogen system showing the initial conditions for all the simulation cases. The droplet is at 363 K initially exposed to supercritical pressure varying from 2 to 20 MPa. Case 4 indicates the ECN spray A conditions for n-dodecane (Bruneaux et al. Reference Bruneaux, Louis-Marie, Laurent, Caspar, Jesper, Lyle and Caroline2010).

3.1. Non-dimensional parameters
A non-dimensional breakup time derived from the analysis of droplet–shock interaction (Hinze Reference Hinze1955; Nicholls & Ranger Reference Nicholls and Arthur1968; Guildenbecher, López-Rivera, & Sojka Reference Guildenbecher, López-Rivera and Sojka2009; Meng & Colonius Reference Meng and Tim2018), considering the droplet displacement and assuming a constant acceleration due to the drag force, is defined as
 \begin{equation} t^{*} = t\frac{u_{z,\textit{POST}}}{D_{0}}\sqrt{\frac{\rho _{\textit{POST}}}{\rho _{D}}}.\end{equation}
The instant that the shockwave first impacts the droplet interface at z = −125 µm is considered as t = 0. This non-dimensional breakup time is useful for comparing the development of droplet deformation at later times when the shockwave has fully passed through the droplet. The Weber number
 $(We)$
is defined based on the post-shock gas phase density (
 $\rho _{\textit{POST}}$
), post-shock velocity (
 $u_{\textit{POST}}$
), initial droplet diameter (
 $D_{0}$
) and surface tension coefficient (
 $\sigma$
) defined as
 ${\textit{We}} ={\rho _{\textit{POST}}u_{\textit{POST}}^{2}D_{0}}/{\sigma }.$
The engine combustion network (ECN) standard n-dodecane spray A conditions (Bruneaux et al. Reference Bruneaux, Louis-Marie, Laurent, Caspar, Jesper, Lyle and Caroline2010), commonly employed for validating computational studies that represents the transcritical conditions, serve as the primary test case. Case 4 marked in table 1 and figure 2 represents the ECN spray A conditions with the density ratio of 30 and surface tension coefficient of 0.02 N m−1. Additional test cases are chosen to encompass a range of conditions outlined in table 1. The initial conditions for eight different cases considered in this study are marked in figure 2. It is noted that the critical temperature and critical pressure of pure n-dodecane are
 $T_{c}$
= 658.1 K and
 $p_{c}$
= 1.82 MPa, respectively, while the critical properties of pure nitrogen are
 $T_{c}$
= 126.2 K and
 $p_{c}$
= 3.369 MPa, respectively. The initial temperature of n-dodecane, the pressure and temperature of the surrounding nitrogen, density ratio and surface tension coefficients (calculated from MD simulations) are outlined in table 1. In this study the surface tension is calculated based on the initial conditions, which are the background nitrogen pressure and temperature, keeping the droplet temperature constant at 363 K for all cases. Furthermore, we consider a constant surface tension by assuming that the transition to the supercritical GL state at which surface tension vanishment occurs is never reached and the droplet breakup occurs faster than the transition to a fully supercritical state as discussed in § 2.3. All cases presented in table 1 represent transcritical behaviour with the initial temperature of n-dodecane (T
D,PRE
) set at 363 K, which is subcritical with respect to the nominal critical point of n-dodecane while the droplet surrounding pressure and temperature are higher than the nominal critical point of n-dodecane. The pressure varies from 2 to 20 MPa and the nitrogen temperature changes from 700 to 1200 K to represent a wide range of conditions from trans- to supercritical, representing
 $T_{r}={T_{S,\textit{PRE}}}/{T_{c}}$
varying from 1.06 to 1.82 and
 $P_{r}={P_{\textit{PRE}}}/{p_{c}}$
varying from 1.1 to 11.0, as outlined in table 1. The reduced pressure and temperature are calculated with respect to the nominal critical point of n-dodecane. In this study we focus on lower droplet temperatures that more accurately represent the initial conditions when a cold fuel is introduced into a high-pressure combustor. Accordingly, the range of nitrogen temperature and pressure considered in this study are relevant to the liquid–fuel injection experiments in high-pressure vessels (Crua, Manin, and Pickett Reference Crua, Julien and Lyle2017). The effect of higher initial droplet temperature on droplet deformation was studied in our previous work (Boyd & Jarrahbashi Reference Boyd and Jarrahbashi2021a
,Reference Boyd and Jarrahbashi
b
). As table 1 outlines, a range of density ratios (
 $\rho ^{*}={\rho _{D}}/{\rho _{\textit{POST}}}$
) varying from 8 to 130 is expected by changing the surrounding temperature (T
S,PRE
) and pressure (P
PRE
), which results in changes in the surface tension coefficient (
 $\sigma$
). The details of surface tension calculation for all cases shown in table 1 is discussed in Appendix C.
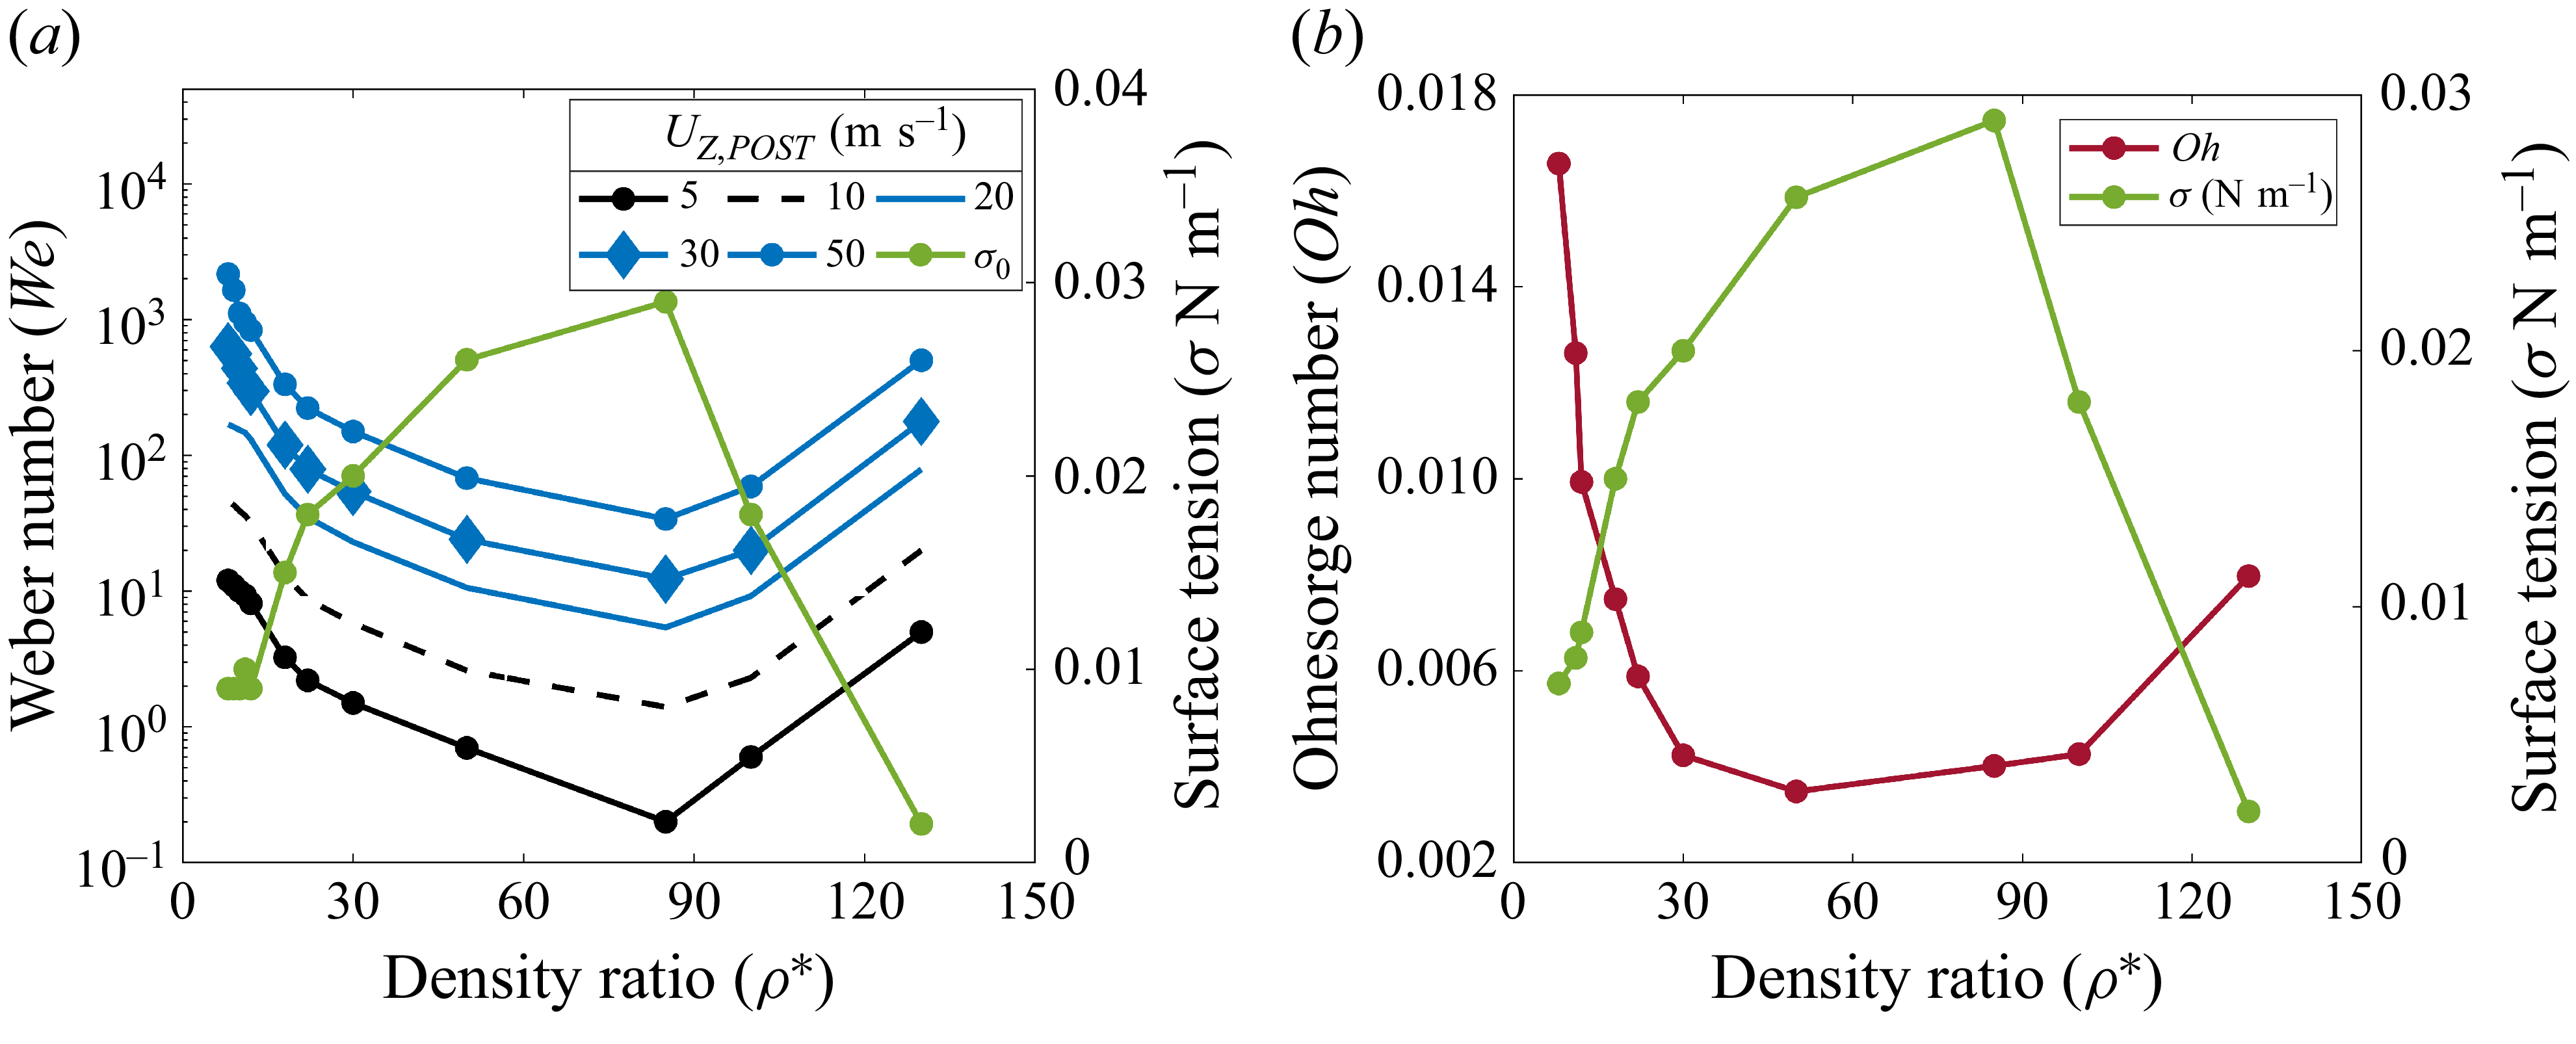
The surface tension coefficient at transcritical conditions obtained from MD simulations (Jangale et al. Reference Jangale, Ehsan, Mohammad and Dorrin2024) varies from 9 to 29 mN/m by varying the temperature from 700 to 1100 K and pressure from 2 to 20 MPa. The changes in surface tension coefficient at the transcritical condition is unique and follows the trend that the surface tension reduces drastically near the nominal critical temperature of n-dodecane. This is consistent with table 1 that shows a minimum value of 0.009 N m−1 for a temperature of 700 K and 20 MPa. By fixing the temperature at 900 K and decreasing the pressure from 20 to 2 MPa, surface tension increases. By setting the pressure to 2 MPa and increasing the temperature to 1100 and 1200 K, surface tension decreases again. To better show this trend, the changes in surface tension coefficient are plotted against the density ratio that is unique for each case in table 1. Figure 3(a) illustrates the variation of the surface tension coefficient with density ratio, revealing a peak in the surface tension coefficient at a density ratio of 85, followed by a decline beyond that specific density ratio. The trend in Ohnesorge number variation with density ratio mirrors that of the Weber number, exhibiting a minimum at a density ratio of 85 as shown in figure 3(b). The Ohnesorge number is calculated along with the Weber number to reflect the range of governing non-dimensional parameters encountered in this study. The Ohnesorge number is defined as
 ${\textit{Oh}} =\mu _{l}/{\sqrt{\rho _{\textit{POST}}D_{0}\sigma }},$
where the droplet viscosity (
 ${\mu}_{l})$
is adapted from the nominal viscosity of n-dodecane at 363 K. The outcomes presented in figure 3 suggest that variation of the surface tension coefficient with density ratio results in a broader range of Weber and Ohnesorge numbers for each flow speed. This distinctive phenomenon is specific to transcritical droplets as opposed to water droplets at subcritical conditions (Pilch & Erdman Reference Pilch and Erdman1987), where various breakup modes are less affected by density ratio while the surface tension coefficient remains constant. Thus, the breakup modes identified under subcritical conditions primarily hinge on the Weber number whilst considering exceedingly low Ohnesorge numbers (i.e.
 ${\textit{Oh}}$
< 0.01), whereas for transcritical droplets, the changes in density ratio simultaneously affect Weber and Ohnesorge numbers as surface tension highly varies with density ratio. It is generally accepted that inviscid simulations – those conducted without explicitly accounting for molecular viscosity – using shock- and interface-capturing schemes naturally include numerical viscosity (Garrick, Owkes, & Regele Reference Garrick, Mark and Jonathan2017; Meng & Colonius Reference Meng and Tim2018; Ma, Wu, Banuti et al. Reference Ma, Wu, Banuti and Ihme2019). In addition, studies (e.g. Lee and Reitz Reference Lee and Rolf2001) have shown that the droplet aerobreakup process across all three regimes (bag breakup, shear-stripping and catastrophic) are primarily governed by the Weber number. These studies have defied the validity of the commonly used ‘shear’ or ‘boundary-layer stripping’ theories, which attribute aerobreakup to viscous stresses and boundary layer effects at the gas–liquid interface. Instead, the breakup is driven by droplet distortion, leading to the formation of thin liquid sheets at the edges, which are stretched into ligaments by airflow and eventually break into smaller droplets. However, to ensure that neglecting viscosity and thermal conduction do not affect the identification of breakup modes, this study incorporates the viscous effects from additional test in which thermal conduction is considered (see Appendix F), showing that there is no significant impact on the droplet morphology. It is crucial to note that numerical viscosity is inherently present in all simulation results. The magnitude of this numerical viscosity is directly related to the spatial resolution of the simulation.
(a) Weber number variation with density ratio for varying post-shock flow speed (
 $u_{z,\textit{POST}})$
; (b) variation of Ohnesorge number with density ratio and surface tension. The secondary plot (green line) shows the surface tension coefficient variation with density ratio.

The transcritical conditions in our study differ from conventional atmospheric aerobreakup by accounting for lower flow speeds, higher gas densities due to supercritical pressure and the fact that the surface tension is constant but varies among cases 1−8. It is noted that the surface tension coefficient is not zero, resulting in a finite Weber number, as the post-shock gas density is significantly higher than atmospheric conditions. Nonetheless, the density ratio and Weber number are instrumental in determining various aerobreakup modes, a point that will be elucidated further in this study.
Another non-dimensional parameter of interest is the ratio of the speed of sound between the droplet and the surrounding fluid defined as
 $n={c_{S}}/{c_{D}}$
, where c is the speed of sound and subscript D and S denote the droplet and surrounding fluid, respectively. We have shown in our earlier study that
 $n$
is a critical parameter that affects the shockwave dynamics interacting with transcritical droplets (Boyd & Jarrahbashi Reference Boyd and Jarrahbashi2021b
). If the speed of sound within the droplet is greater than the surrounding fluid
 $(n\lt 1)$
, it represents a ‘divergent’ case as the refracted shockwave within the droplet moves ahead of the incident shockwave. In contrast, if the speed of sound within the droplet is less than the surrounding fluid
 $(n\gt 1)$
, a ‘convergent’ case emerges as the refracted shock within the droplet lags the incident shockwave. As a result, the incident shockwave focuses on the downstream pole of the droplet leading to a noticeable jump in pressure and creating an outward axial jet in that location. As the droplet temperature is constant in this study, the speed of sound ratio varies from 0.45 to 0.58 for the cases represented in figure 2 based on the changes in the nitrogen speed of sound, and thus, all cases are associated with a divergent shock dynamics behaviour.
This study focuses on lower-Weber-number regimes and subsonic post-shock flow speeds to explore the differences in breakup modes compared with subcritical aerobreakup, which is more distinct for Weber numbers varying between 1 and 100. By altering the post-shock speed within the range between 5–50 ms−1, which exposes the droplet to a subsonic flow, a diverse spectrum of Weber numbers from 0.1 to 700 is expected, which corresponds to the RTP breakup regime identified for subcritical conditions (Theofanous et al. Reference Theofanous, Ng, Chih and Mitkin2012). The density ratio is calculated based on the post-shock gas density and temperature that varies among different cases (1-8) while the droplet density at 363 K is considered constant. The changes in surface tension coefficient and post-shock density are reflected in the Weber number as depicted in figure 3(a). For a constant post-shock speed, there exists a minimum Weber number at a density ratio of 85 as the surface tension reaches its peak.
4. Results and discussion
In this study we resort to 2-D axisymmetric simulations due to the high computational costs of 3-D simulations. While it is acknowledged that 2-D axisymmetric simulations may not entirely depict the entirety of droplet fragmentation and bag rupture into smaller sheets and droplets, they remain valuable for capturing the initial droplet deformation. This early deformation phase plays a pivotal role in determining the subsequent breakup mode. This study does not focus on capturing the size distribution of child droplets, which occurs at later stages of breakup and requires a 3-D simulation (Dorschner et al. Reference Dorschner, Luc, Kevin, Hazem and Tim2020). The validity of the axisymmetric assumption has been outlined in Appendix G by comparing the droplet aerobreakup modes and droplet transverse extension predicted by 2-D axisymmetric with 3-D cylindrical simulations. A grid resolution study considering 50, 100, 150, 300 and 500 cells in one droplet diameter is presented in Appendix E. A quantitative comparison of the droplet centroid velocity and the rim velocity in the z direction (see Appendix E) shows that the errors remain within 1.5 % even with a resolution of 100 cells per diameter. Although the vortical structures in the leeward side of the droplet become more detailed as the grid is refined, comparing the time history of the droplet morphology and density distribution shows insignificant differences between 100 and 150 cells. Therefore, 100 cells per droplet diameter is adopted as the optimum grid resolution in this study to compromise between the accuracy and computational costs. The breakup behaviour of transcritical droplets with their subcritical counterpart are compared and the effect of surface tension on determining the breakup behaviour is discussed in § 4.1. The effects of surface tension on droplet aerobreakup are demonstrated by comparing the vorticity magnitude and numerical schlieren images showing the variation in density with and without surface tension effects as outlined in § 4.2. Further comparison is made for the droplet shape and density gradient predicted by PR-EoS and ST-EoS in § 4.3. Transcritical breakup modes are identified in § 4.4 for a range of density ratios varying from 8 to 130. Accordingly, a breakup regime map is created as a function of the density ratio and Weber number. The critical Weber number is identified for varying density ratios along with temporal changes in droplet morphology. Lastly, a thorough quantitative analysis of the breakup time scales and growth rate of droplet deformation is presented in § 4.5 to link the mechanism governing transcritical breakup to the droplet morphological changes undergoing aerobreakup.
4.1. Subcritical versus transcritical droplet aerobreakup
In this section we demonstrate the differences observed in aerobreakup modes for two 50 µm n-dodecane droplets, initially at 363 K exposed to subcritical and supercritical nitrogen environments. The nitrogen pressure for the subcritical case is set as 1 MPa and its temperature is 363 K, which is the same as the n-dodecane droplet temperature. For the supercritical case, the nitrogen pressure is 2.5 MPa and its temperature is 900 K, which are both considered supercritical with respect to the nominal critical point of n-dodecane. These conditions are set such that both cases represent the same density ratio of 68. The surface tension coefficient calculated based on the MD simulations is 0.038 N m−1 for the subcritical case and 0.023 N m−1 for the supercritical case. The post-shock velocity in these two cases has been selected such that both cases represent a Weber number of 19. Accordingly, the subcritical and supercritical cases are exposed to 8 ms−1 and 18 ms−1 post-shock speed, respectively. Figure 4(a–c) shows the computational schlieren images (top half) and density contours (bottom half) for the subcritical case and figure 4(d–f) represents the same for the supercritical case. The computational schlieren images are generated using a shading function
 $(\phi )$
defined as
 $\phi =\exp (-k({| {\Delta} \rho | }/{| {\Delta} \rho | _{\max }}))$
, where the parameter
 $k$
is assigned to the droplet and nitrogen to highlight the compressible flow features. The parameter
 $k$
for n-dodecane and nitrogen is selected as 120 and 600, respectively. The droplet morphology is indicated by the isolines of the droplet volume fraction (
 $\alpha _{D}=$
0.25, 0.5, 0.75, 0.95), which shows an insignificant difference between the droplet morphology and the resultant breakup mode. The time stamp indicates both the time elapsed after the start of the simulations and the non-dimensional time represented as
 $t^{*}$
calculated according to (3.1).
Comparison of the n-dodecane droplet deformation in subcritical (a–c: Movie1.mp4) and supercritical nitrogen (d–f: Movie2.mp4) (Supplementary movies are available at https://doi.org/10.1017/jfm.2026.11223). Both cases represent
 $\rho ^{*}$
= 68 and at
 ${\textit{We}} = 1$
9. For each subfigure, the top half represents the numerical schlieren images and the bottom half exhibits the density contours. The isolines indicate the droplet volume fraction of
 $\alpha _{D}$
.

Comparing the results shows that the droplet in a subcritical environment undergoes deformation from a circular to a muffin shape structure after 95 µs without undergoing further breakup at comparable times. In contrast, the supercritical droplet case (figure 4
d–f) turns into a thin arc-shaped structure with a wider radial expansion in the transverse direction at comparable times and exhibits a faster breakup behaviour overall. At
 $t^{*}$
= 1, the differences between the subcritical (figure 4
c) and supercritical (figure 4
f) cases are significant. The supercritical case undergoes a backward bag breakup and the droplet turns into a very thin sheet at 40 µs. The definition of backward bag in this study refers to a case where the rims of the bag are elongated in the direction of the relative flow with respect to the bag (i.e. from left to right). As the density ratio and Weber number are the same for both cases, the major difference observed between the cases is due to the post-shock speed, the speed of sound, surface tension, the density of nitrogen, and consequently, the speed of sound ratio. The speed of sound ratio is 0.32 for the subcritical and 0.51 for the transcritical case, which both represent a diverging case. This means that the speed of sound in the droplet is greater than the surrounding fluid and the refracted shockwave moves ahead of the incident shock approaching the downstream pole of the droplet. As discussed in our earlier study (Boyd & Jarrahbashi Reference Boyd and Jarrahbashi2021b
), as the refracted shock passes across the downstream droplet interface, a transmitted shock and the reflection of a rarefaction wave emitted as the acoustic impedance mismatch results in the internal reflection of a rarefaction wave. The rarefaction wave creates a low-pressure region inside the droplet on the downstream pole of the droplet that initiates the droplet deformation. As the speed of sound in nitrogen increases with pressure and temperature for the transcritical case and the post-shock speed is higher, the shockwave passes through the droplet faster, which leads to an earlier deformation of the droplet into a bag with a wider radial expansion compared with the subcritical case at comparable times. In addition, the lower surface tension effects at transcritical conditions facilitate the droplet deformation into a thin arc-shaped sheet. This analysis clearly shows that the droplet breakup behaviour at subcritical conditions vary when the droplet is exposed to a supercritical environment even at a comparable Weber number and density ratio.
Another case is examined here to illustrate the distinctions between droplet breakup in subcritical and supercritical environments when exposed to a higher post-shock speed replicated by initiating a Mach 1.2 shockwave impacting the droplet. The cases are meticulously chosen to maintain a consistent density ratio while varying in Weber number and shock dynamics. Specifically, distinctions are made between convergent and divergent cases. The numerical schlieren images of the droplet and the flow field at 2 µs are depicted in figure 5, with the green contour indicating the droplet shape at a volume fraction of 0.95. Unlike the previous case discussed in figure 4, the droplet temperature is set at 500 K and the density ratio for both cases is 81. For the subcritical case, the surrounding nitrogen temperature and pressure are 500 K and 1 MPa, respectively, with a post-shock gas velocity of 139 ms−1 and a Weber number of 302. Additionally, the speed of sound ratio is 0.9, indicating the diverging behaviour of shock reflections. On the other hand, the supercritical case shown in figure 5(b) considers the nitrogen at a temperature and pressure of 1200 K and 2.5 MPa, with a post-shock gas velocity of 216 ms−1. The Weber number is 755 and the speed of sound ratio is 1.2, which signifies a converging case (Boyd & Jarrahbashi Reference Boyd and Jarrahbashi2021b ). At 2 µs, the subcritical droplet (figure 5 a) is in a transitional stage, whereas the supercritical droplet has already transformed into a thin sheet with the flow field around the deformed droplet displaying well-developed vortices at the leeward side of the droplet. This observation further suggests that the density ratio does not solely dictate the breakup behaviour between subcritical and transcritical cases. The higher Weber number observed in the supercritical case, attributed to its lower surface tension and higher gas speed necessary to maintain the same density ratio as the subcritical case, accelerates the breakup process. This acceleration results in advancements in breakup occurring at comparable times between the two cases.
Comparison of an n-dodecane droplet deformation in (a: Movie3.mp4) subcritical nitrogen
 ${\textit{We}} = 302$
and (b: Movie4.mp4) supercritical nitrogen
 ${\textit{We}} = 755$
at 2 µs. Both cases represent
 $\rho ^{*}$
= 81 and a droplet temperature of 500 K. Each subfigure represents the numerical schlieren and the green isoline indicates the droplet volume fraction of
 $\alpha _{D}=$
0.95.

4.2. Effect of surface tension on transcritical aerobreakup
To demonstrate the impact of surface tension on droplet breakup at transcritical conditions, case 4 in table 1, which is based on the ECN spray A conditions at a density ratio of 30, is considered where the temperature of n-dodecane is 363 K and the temperature and pressure of nitrogen are 900 K and 6 MPa, respectively. Simulations are repeated with and without surface tension effects and the differences in the droplet deformation are shown using schlieren images (top half) and vorticity contours (bottom half) in figure 6. The post-shock velocity is 12 ms−1 for both cases. The isoline of the n-dodecane volume fraction equal to 0.95 is shown with a solid green line in figure 6. The case with surface tension effects corresponds to
 ${\textit{We}} =$
14. The major difference between the two cases is evident from the radial expansion of the deformed droplet at later stages of deformation. In the absence of surface tension, the deformed droplet exhibits less resistance to the incoming flow and the open ends of the bag at the wake of the droplets approach each other while, for the case with surface tension, the front of the bag remains vertical until later stages of the breakup. This behaviour affects the vorticity generation in the wake region. The counter-rotating vortex pairs extend further downstream for the case without surface tension. Comparing the two cases at 33 µs shows that the droplet becomes excessively thin on the front side in the absence of surface tension effects and eventually breaks off from the centre of the sheet. Other than the curvature of the deformed bag, differences are observed in the structure of the thinner sheets (rim) of the droplet at its aft. Surface tension leads to thinner rims in a process known as shear thinning. The differences discussed above were also observed for higher-Weber-number cases not shown here for brevity. Given that shear thinning acts as a precursor to droplet fragmentation, these findings underscore the importance of accounting for surface tension effects in transcritical conditions. Such considerations are pivotal for accurately predicting the time scales of breakup events and the resultant size distribution of child droplets in the later stages of fragmentation.
Comparison of the droplet morphology (a–c) with surface tension effects at
 ${\textit{We}} =$
14 and (d–f) without surface tension, i.e.
 ${\textit{We}} \rightarrow \infty$
. For each image, the top half presents the numerical schlieren images and the bottom half shows the vorticity contours. The green line indicates a droplet volume fraction of
 $\alpha _{D}=$
0.95.

4.3. Effects of equation of state on transcritical aerobreakup
The ST-EoS has been commonly used in the simulation of droplet–shock interaction due to its computational simplicity and stability. In contrast, implementing the cubic equation of state representing PR-EoS increases the computational costs and poses stability issues. Our simulations indicated that the total simulation time increased by a factor of two using PR-EOS. However, the ability of PR-EoS to accurately represent the real-fluid behaviour makes it a robust choice for the simulation of transcritical aerobreakup, particularly for heavy hydrocarbon fuels like n-dodecane.
To identify the differences between the breakup behaviour predicted using ST-EoS and PR-EoS, case 3 from table 1 at a Weber number equal to 14 and a density ratio of 18 is considered. The temperature of n-dodecane is 363 K and that of nitrogen is 900 K and the operating pressure is 10 MPa. The surface tension coefficient is 0.015 N/m for this case. The density gradient in the z direction is compared between the two cases in figure 7(a–d), where the bottom half is associated with PR-EoS and the top half shows the simulation results conducted using ST-EoS. The black isoline indicates the volume fraction of 0.95 to exhibit the droplet morphology. Figure 7 clearly shows that ST-EoS returns a lower density gradient at the interface (at least a factor of two) at
 $t^{*}$
= 1.5 (green and orange colours) than PR-EoS (blue and red colours). In addition, the droplet morphology predicted by PR-EoS exhibits a very different rim shape with two blobs of fluid at the far end of the arched-shape thin sheet at
 $t^{*}$
= 1.5, which is absent in the predictions returned by ST-EoS. The differences observed at the rims result in the differences seen in the vorticity field at the leeward side of the droplet. The baroclinic torque is calculated for both cases and identified as one of the key factors in explaining the differences observed between the two simulations. The baroclinic vorticity defined as
 ${1}/{\rho ^{2}}(\boldsymbol{\nabla }\rho \times \boldsymbol{\nabla }p),$
which represents a measure of misalignment of the local pressure and density gradients, further highlights the differences observed between PR-EoS and ST-EoS. The magnitude of baroclinic vorticity at the rims for PR-EoS and ST-EoS is
 $\omega =-5.1\times 10^{4}\,\textrm{s}^{-1}$
and
 $\omega =-3.2\times 10^{4}\,\textrm{s}^{-1}$
, respectively. This behaviour is consistent with the orientation of the rims and the blobs detected at the end of the rims. The blobs are tilted in the direction of the incoming flow (from left to right) for the PR-EoS case, while the blobs remain along the arc-shape rim for the ST-EoS case. These results show that the choice of the equation of state can affect the prediction of the later stages of transcritical aerobreakup. Therefore, the simulation results presented in the next section are conducted using PR-EoS to capture the real-gas behaviour more accurately.
Comparison of density gradient in the z direction between the equation of states (PR-EoS and ST-EoS) for case 3 at
 ${\textit{We}}$
= 14 and
 $\rho ^{*}$
= 18 at
 $t^{*}$
= 0.0, 0.6, 1.0, 1.5 in (a−d), respectively. For each image, the bottom half is the predictions using PR-EoS and the top half is associated with ST-EoS. The black line indicates the isoline of the volume fraction at 0.95 (
 $\alpha _{D}$
= 0.95).

4.4. Transcritical breakup mechanism
The temporal behaviour of a transcritical droplet deformation is illustrated in figure 8 for case 6 outlined in table 1. Case 6 represents a 50 µm-diameter n-dodecane droplet at 363 K exposed to nitrogen at 900 K temperature and 2 MPa pressure, corresponding to a density ratio of 85. This test case has been selected here as the surface tension exhibits a peak at a density ratio equal to 85, as shown in figure 3. The results are obtained by changing the post-shock speeds from 5 to 107 ms−1, which results in the variation of the Weber number from 1 to 336 as shown in figure 8. The droplet deformation is shown using the isoline of n-dodecane volume fraction equal to 0.95. It is noted that the distance shown between the droplet stages is not the actual displacement of the droplet. To ensure consistent comparison across all cases, the characteristic time scale denoted as
 $t^{*}$
given in (3.1) is normalised by the onset of breakup time resulting in a scale ranging from 0 to 1. The onset of the breakup time (
 ${T_{b}}^{*}$
) is defined as the start of droplet fragmentation (Jain et al. Reference Jain, Neha, Surya Prakash, Ravikrishna and Gaurav2019). For each of the cases with Weber numbers varying from 3 to 336, the initial spherical droplet undergoes a deformation with transitional stages shown at
 ${t^{*}}/{T_{b}}^{*}$
, varying from 0.1 to 0.9. The ultimate breakup mode is identified at
 ${t^{*}}/{T_{b}}^{*}=1$
, after which the droplet will further break up into child droplets. Figure 9 shows the different terminologies used in this study to describe the breakup process as follows: (i) sheet refers to the middle section of the droplet undergoing the shear-thinning process; (ii) rims represent the outer edge of the deformed droplet where notable stretching and thinning take place, usually preceding the eventual fragmentation or breakup of the droplet into a number of child droplets; and (iii) whiplash in a 2-D cut denotes the swift elongation and thinning of the droplet’s rim, resembling the motion of a whip, often occurring before the droplet fragments or breaks up.
Temporal development of a transcritical droplet for different
 ${\textit{We}}$
ranging from 3 to 150 for case 6 outlined in table 1 with a density ratio equal to 85. The time is normalised with the onset of breakup time (
 ${T_{b}}^{*}$
).

A schematic illustration of various terminologies utilised in the analysis regarding the deformed droplet before the completion of the breakup.

As figure 8 shows, the droplet does not break up at
 ${\textit{We}} =$
3 while at
 ${\textit{We}} =$
8 it gradually elongates and deforms into a crescent shape. This behaviour is consistent with the oscillation (vibrational) breakup mode where the droplet does not breakup as defined by Pilch & Erdman (Reference Pilch and Erdman1987). At lower
 ${\textit{We}}$
< 10, Rimbert et al. (Reference Rimbert, Escobar, Meignen, Hadj-Achour and Gradeck2020) have also shown a stable oscillation. At
 ${\textit{We}} =8$
, these oscillations indicate that the aerodynamic forces are not large enough to cause fragmentation. Thus,
 ${T_{b}}^{*}$
for these cases is the perceived characteristic breakup time at
 $t^{*}$
= 1. In the scenario of intensified aerodynamic forces, the droplet experiences sustained deformation until it eventually undergoes fragmentation through one of the modes once the Weber number surpasses a critical value, i.e.
 ${\textit{We}} \gt We_{\textit{cr}}$
. The critical Weber number (
 ${\textit{We}}_{\textit{cr}})$
is defined as the Weber number below which the droplet does not break up. The identified
 ${\textit{We}}_{\textit{cr}}$
is 18 for case 6, which is higher than the critical Weber number identified for subcritical droplets that varies between 9−13 in various studies irrespective of the density ratio (Xu, Wang & Che Reference Xu, Tianyou and Zhizhao2023; Guildenbecher, López-Rivera & Sojka Reference Guildenbecher, López-Rivera and Sojka2009; Zhao et al. Reference Zhao, Hai-Feng, Wei-Feng and Jian-Liang2010; Jain et al. Reference Jain, Neha, Surya Prakash, Ravikrishna and Gaurav2019). For 8
 $\lt {\textit{We}} \lt$
18, the droplet experiences a transitional breakup mode before the droplet ultimately breaks up from the end of the rims. The transitional breakup mode unfolds more slowly than other breakup modes. For 19
 $\lt {\textit{We}} \lt$
26, the backward bag breakup mode emerges with toroidal ring formations at the ends. In this study, a forward bag is referred to as a case where the open end of the bag is facing the flow stream from left to right whereas a backward bag is formed when the closed part of the bag is facing the flow stream as shown in figure 9. This phenomenon arises from an outward force exerted on the bag, propelling it towards the rim. This force is a consequence of the high-pressure stagnant flow within the droplet that builds up pressure inside the bag, causing it to expand outward towards the rims. This behaviour forms a concave disc formation pointing downstream with thicker ends/rims. The backward bag breakup mode exhibits different stages until full breakup. Initially, the droplet elongates in the radial direction followed by the formation of a concave disc and thickening of the rims, and finally, the droplet breaks up from the rims into two smaller blobs. At Weber number
 ${\textit{We}}$
= 26, two larger distinct blobs at the rim end become apparent, and the sheet becomes thinner compared with the scenario observed for
 ${\textit{We}}$
= 19. This breakup sub-mode is denoted as the ‘bag with sheet-thinning’, which differs from the typical bag breakup by featuring a slender sheet that separates from the centre into two elongated fragments, accompanied by thicker parts at the peripheries (Guildenbecher et al. Reference Guildenbecher, Jian, Jun and Paul2017). At
 ${\textit{We}}$
= 42, the sheet-thinning breakup mode is detected as the rims are elongated in the direction of the flow. This case exhibits a transition from bag breakup with thicker rims towards sheet-thinning with relatively thinner rims and small child droplet fragmentation initiated at the rim ends. The extended rim at the onset of breakup is the cumulation of smaller child droplets as they stick together for a brief time (Guildenbecher, López-Rivera & Sojka Reference Guildenbecher, López-Rivera and Sojka2009; Guildenbecher et al. Reference Guildenbecher, Jian, Jun and Paul2017). At
 ${\textit{We}}$
= 76 and 150, the sheet-thinning mode persists; however, the rims are not thick and a thin sheet is continuously drawn from the periphery of the deforming droplet with almost a constant thickness throughout. The sheet disintegrates a short distance downstream from the droplet, which is not shown here. The rim of the droplet elongates into a thin ligament, which progressively extends over time. While undergoing sheet thinning, this ligament separates from the middle of the droplet. Notably, a coherent ligament remains intact throughout the breakup process, without detaching from the droplet’s centre. Moreover, the curvature of the crescent formed during sheet thinning amplifies at higher Weber numbers. It is noted that a finer grid resolution (500 grid cells per droplet diameter) has been considered for high-Weber-number cases, i.e.
 ${\textit{We}}$
= 150 and 336, to better capture the deformation of extended ligaments observed at the later stages of droplet breakup. Differences in ligament shape were observed using a coarser grid (100 grid cells per droplet diameter); however, despite these discrepancies, the overall breakup mode does not change with mesh refinement. Both grids predict the same breakup mode for the Weber numbers considered in this study.
To isolate the effects of density ratio varying with the droplet morphology, the isoline of volume fraction equal to 0.95 is depicted in table 2 at a constant non-dimensional time of
 $t^{*}=1$
and at a constant Weber number, i.e.
 ${\textit{We}}$
= 24. The post-shock flow speed has been adjusted by varying the shock strength to ensure that all cases correspond to the same Weber number, determined based on the post-shock flow speed and density. Table 2 shows the droplet morphology for a density ratio varying from 8 to 130. For reference, the corresponding surface tension for each case is outlined in table 2.
Droplet morphology variation with density ratio (
 $\rho ^{*}$
varying from 8 to 130) for
 ${\textit{We}} =$
24 at
 $t^{*}=$
1. The critical Weber number variation with density ratio is given for each case.

The droplet shape for
 $\rho ^{*}=$
8 and 130 changes from its initial spherical shape into a thick disc-like structure, thicker in the centre and thinner at the rims. As observed from the droplet morphology, the thickness of the deformed droplet initially decreases while the deformed sheet extends radially for density ratios ranging between 8 and 50. However, beyond a density ratio of 50, the sheet thickness begins to increase and the sheet contracts radially. In addition to the observed variation in thickness, differences are notable in the curvature of the sheet, which reaches its peak at a density ratio of
 $\rho ^{*}=$
12. Subsequently, the curvature gradually diminishes with increasing density ratio and decreasing surface tension. As a result, the sheet changes from a crescent shape into a nearly flat disc, suggesting that the tendency to form a bag decreases with an increase in density ratio. However, as the surface tension decreases with an increase in density ratio, the droplet’s tendency toward forming a bag increases and a crescent shape is identified rather than a flat disc. In addition, differences are identified in the rims with a change in density ratio. The rims are aligned with the flow stream from left to right for cases 2–4, whereas the rims tend to pull away from the droplet centre transversely for cases 5–7. The comprehensive analysis of velocity and vorticity fields in § 4.5 will shed light on the observed differences in droplet morphological changes across varying density ratios.
The critical Weber number (
 ${\textit{We}}_{\textit{cr}}$
) for each case is shown in table 2. The critical Weber number for the transition from the vibrational breakup mode to bag breakup identified for subcritical conditions given in the literature varies between 10 and 12 (Pilch & Erdman Reference Pilch and Erdman1987; Guildenbecher, López-Rivera, & Sojka Reference Guildenbecher, López-Rivera and Sojka2009); however,
 ${\textit{We}}_{\textit{cr}}=$
12 is commonly accepted as the breakup threshold for subcritical conditions, which is independent of the density ratio. The correlation between the droplet morphology and critical Weber number in table 2 suggests that
 ${\textit{We}}_{\textit{cr}}$
decreases proportionally to the surface tension coefficient for all cases outlined in table 2. For instance,
 ${\textit{We}}_{\textit{cr}}$
is equal to 8 for
 $\rho ^{*}=$
8 and it decreases to 7 at
 $\rho ^{*}=$
130, which exhibits the lowest surface tension among all cases. Here
 ${\textit{We}}_{\textit{cr}}$
increases to 18 for
 $\rho ^{*}=$
85, which exhibits the highest surface tension among all cases shown in table 2. This analysis suggests that the critical Weber number varies with simultaneous changes in density ratio and surface tension at transcritical conditions with a minimum of 7 and maximum of 18, which highlights the differences observed between subcritical and transcritical aerobreakup.
The analysis of breakup modes is expanded across all cases detailed in table 1, encompassing a range of density ratios from 8 to 130. A breakup regime map is devised and juxtaposed with the critical Weber numbers identified for subcritical conditions according to Guildenbecher, López-Rivera, and Sojka (Reference Guildenbecher, López-Rivera and Sojka2009) to delineate the transition between breakup modes as depicted in figure 10. For
 ${\textit{We}} \lt$
4, no breakup is observed for all density ratios. The vibrational and transitional breakup modes are observed for 4
 $\lt {\textit{We}} \lt$
8 and 8
 $\lt \rho ^{*}\lt$
85. For
 $\rho ^{*}\gt $
100, a forward bag with sheet-thinning is identified as the primary breakup mode for 4
 $\lt {\textit{We}} \lt$
100. The backward bag breakup mode is observed for
 ${\textit{We}} \gt$
9, which further develops into a bag with sheet-thinning breakup for
 ${\textit{We}} \gt $
19 and 8
 $\lt \rho ^{*}\lt$
100. For
 ${\textit{We}} \gt $
26 and 12
 $\lt \rho ^{*}\lt$
30, a sheet-thinning breakup mode and, for 26
 $\lt {\textit{We}} \lt$
72 and 30
 $\lt \rho ^{*}\lt$
90, a whiplash with sheet-thinning breakup mode is identified. This breakup mode is referred to as whiplash as the rims oscillate like whiplash due to vortex shedding in the flow stream (see figure 8 and the supplementary materials). The breakup mode shifts into sheet-thinning for
 ${\textit{We}} \gt$
72 and 30
 $\lt \rho ^{*}\lt$
90. The intriguing phenomenon specific to transcritical breakup is the presence of five distinct breakup modes observed for 18
 $\lt {\textit{We}} \lt$
100, spanning density ratios from 8 to 130. These breakup modes include backward bag, bag with sheet-thinning, sheet-thinning, whiplash with sheet-thinning and forward bag with sheet-thinning.
Breakup regime map for a range of density ratios and Weber numbers for n-dodecane droplet aerobreakup under transcritical conditions. On the right-hand side of the plot, the blue arrows indicate the subcritical critical Weber numbers and droplet breakup modes varying with Weber number according to Guildenbecher, López-Rivera & Sojka (Reference Guildenbecher, López-Rivera and Sojka2009).

For subcritical cases, the effect of the density ratio is not significant and a singular breakup mode is observed as shown in figure 10 (Guildenbecher, López-Rivera, and Sojka Reference Guildenbecher, López-Rivera and Sojka2009). As mentioned earlier, the critical Weber number for transition from vibrational to bag breakup for the subcritical condition is 12 (Guildenbecher, López-Rivera, and Sojka Reference Guildenbecher, López-Rivera and Sojka2009), while the critical Weber number drops to 8 for transcritical conditions as shown in figure 10. In contrast to subcritical conditions where multimode bag breakup occurs for 18
 $\lt {\textit{We}} \lt$
45, and shear thinning (stripping) is observed for
 ${\textit{We}} \gt$
80, the transcritical breakup modes generally exhibit a lower critical Weber number for sheet-thinning and sheet-thinning with whiplash. Specifically, this occurs at
 ${\textit{We}} =$
25 for 13
 $\lt \rho ^{*}\lt$
130. Among the few studies exploring the influence of density ratio on breakup modes at subcritical conditions, Jain et al. (Reference Jain, Neha, Surya Prakash, Ravikrishna and Gaurav2019) demonstrated that for a comparable Weber number range, i.e. 20
 $\lt {\textit{We}} \lt$
100, a transition from backward bag to whiplash with sheet-thinning occurs as the density ratio increases from 10 to 100 for a water droplet. In their study, they observed a forward bag and a transient breakup mode for
 ${\textit{We}} \lt$
20 at lower density ratios (
 $\rho ^{*}\lt$
10), while for transcritical conditions, a forward bag is observed at a higher density ratio (
 $\rho ^{*}=$
130), as depicted in figure 10. Hence, the breakup modes observed under subcritical conditions, despite the variations in density ratios, diverge significantly from the transcritical breakup modes. This discrepancy arises from the combined effects of the speed of sound, changes in surface tension and density fluctuations unique to transcritical conditions, elements absent in subcritical scenarios.
(a) Droplet morphology showing different stages of deformation and breakup corresponding to the non-dimensional time scales used in the analysis as follows: initial deformation time scale (
 $T_{i}^{*}$
), onset of breakup time (
 $T_{b}^{*}$
); (b) initial deformation time scale; (c) onset of droplet breakup time versus density ratio varying with Weber number for all cases outlined in table 1.

4.5. Quantitative analysis of transcritical aerobreakup
4.5.1. Relationship between deformation time and breakup modes
The non-dimensional breakup time (
 $t^{*}$
) defined in (3.1) is employed to compare different stages of droplet deformation consistent with the existing literature (Pilch & Erdman Reference Pilch and Erdman1987; Theofanous & Li Reference Theofanous and Li2008; Guildenbecher, López-Rivera, and Sojka Reference Guildenbecher, López-Rivera and Sojka2009; Jain et al. Reference Jain, Neha, Surya Prakash, Ravikrishna and Gaurav2019). By examining the results shown in the previous section, it is observed that the initial deformation of the droplet into a bag or disc shape dictates the subsequent breakup mode and droplet fragmentation. Therefore, two non-dimensional time scales following the droplet deformation and breakup (annotated in figure 11
a) are employed in this analysis. (i) The initial deformation time scale is represented by the time it takes for the droplet to develop into a bag or disc (
 $T_{i}^{*}$
) (Pilch & Erdman Reference Pilch and Erdman1987; Guildenbecher, López-Rivera, and Sojka Reference Guildenbecher, López-Rivera and Sojka2009). (ii) The onset of the breakup time scale denoted by
 $T_{b}^{*}$
corresponds to the start of fragmentation from the rims of the droplet (Jain et al. Reference Jain, Neha, Surya Prakash, Ravikrishna and Gaurav2019). Variation of
 $T_{i}^{*}$
with Weber number and density ratio for the cases outlined in table 1 is shown in figure 11(b). The results are shown for
 ${\textit{We}}$
= 20, 35, 75 and 100 with a density ratio varying from 8 to 130. As
 ${\textit{We}}$
increases for a constant
 $\rho ^{*}$
, the initial deformation time (
 $T_{i}^{*}$
) decreases due to an increase in post-shock gas velocity leading to a faster droplet deformation into its final breakup mode. The deformation time is less affected by the changes in density ratio for higher
 ${\textit{We}}$
, while the deformation time increases at a higher rate at lower density ratios and lower
 ${\textit{We}}$
. As indicated in figure 11(b), the deformation time increases with an increase in density ratio from 8 to 85 where surface tension increases, and density decreases simultaneously. However, with a further increase in density ratio past 85, corresponding to a higher nitrogen temperature, the surface tension decreases and the droplet deformation time decreases. At
 $\rho ^{*}$
= 130, the deformation time decreases significantly, leading to a much lower
 ${\textit{We}}_{\textit{cr}}$
compared with other cases. The variation of critical Weber number with density ratio is shown in table 2, which is a result of simultaneous changes of density ratio and surface tension. This behaviour shows that surface tension effects and density ratio simultaneously dictate the deformation time and the ultimate breakup mode in transcritical droplets, particularly at lower density ratios. To further shed light on the breakup process at the later stages, the onset of the breakup time scale, i.e.
 $T_{b}^{*}$
, is plotted in figure 11(c) versus density ratio for the same conditions shown in figure 11(b). Figure 11(c) shows that
 $T_{b}^{*}$
is inversely proportional to
 ${\textit{We}}$
for a density ratio changing from 8 to 130. Here
 $T_{b}^{*}$
initially decreases with an increase in density ratio for a fixed Weber number until reaching
 $\rho ^{*}$
= 30. This phenomenon can be elucidated by referring to table 2. As the density ratio increases, the droplet undergoes a deformation from a thick disc into a bag with sheet thinning, exhibiting visible rims at the same non-dimensional time of t* = 1. This behaviour shows that at lower density ratios, it takes a shorter time for the droplet to deform into a disc consistent with a longer initial deformation time scale, i.e.
 $T_{i}^{*}$
. However, the onset of droplet fragmentation and sheet thinning is delayed compared with the higher density ratio cases at comparable
 ${\textit{We}} .$
As the surface tension peaks at
 $\rho ^{*}$
= 85, the total breakup time increases for all
 ${\textit{We}} .$
With a further increase in density ratio beyond 85, the breakup time decreases as lower surface tension effects facilitate the droplet fragmentation when the droplet deforms into a bag with thin rims, as depicted in figure 11(b–c). With an increase in density ratio to 130, the breakup time further decreases as surface tension decreases. At such conditions, the breakup time is less affected by the
 ${\textit{We}}$
.
In summary, different breakup time scales are detected based on all cases outlined in table 1 as follows: (i) shorter
 $T_{i}^{*}$
and longer
 $T_{b}^{*}$
are observed for lower density ratios (8−30) and lower surface tension cases as the breakup occurs due to the fragmentation of the main droplet sheet from the centre rather than fragmentation of the rim that occurs at higher density ratios, (ii) intermediate density ratios (
 $50\lt \rho ^{*}\lt 85$
) and higher surface tension leading to longer
 $T_{i}^{*}$
and longer
 $T_{b}^{*}$
, and finally, (iii) higher density ratios (
 $85\lt \rho ^{*}\lt 130$
) with lower surface tension effects leading to shorter
 $T_{i}^{*}$
and
 $T_{b}^{*}$
as the break up is mainly governed by the sheet-thinning process and fragmentation from the rims.
(a) A schematic of the droplet’s initial shape, droplet centroid displacement (
 $Z_{C}$
) and droplet velocity (
 $U_{C,Z})$
, rim velocity (
 $U_{Ri,Z};U_{Ri,R})$
, wake velocity at the leeward side of the droplet (
 $U_{V,Z};U_{V,R})$
and vorticity magnitude (ω). (b) Variation of droplet centroid displacement for post-shock speeds ranging from 5 to 50 ms−1.

4.5.2. Relationship between droplet motion and breakup modes
To further elucidate the combined influence of density ratio and surface tension on the breakup mechanisms, we define the distance travelled by the droplet centroid during deformation and before the initiation of breakup (
 $Z_{C}$
), normalised by the initial droplet diameter as droplet displacement
 $Z_{C}^{\textrm{*}}= {Z_{C}}/{d_{0}}$
. Moreover, the normalised droplet relative velocity is calculated as
 $U_{C,Z}^{*}={U_{Z,\textit{POST}}-U_{C,Z}}/{U_{Z,\textit{POST}}}$
, using droplet centroid velocity (
 $U_{C,Z}$
) and post-shock gas velocity (
 $U_{Z,\textit{POST}}$
). The normalised droplet rim velocity in the Z direction is defined as
 $U_{Ri,Z}^{*}={U_{Ri,Z}}/{U_{Z,\textit{POST}}}$
and the normalised droplet rim velocity in the R direction is defined as
 $U_{Ri,R}^{*}={U_{Ri,R}}/{U_{Z,\textit{POST}}}$
. As the droplet undergoes deformation, the flow field on the wake (leeward) side of the droplet, where counter-rotating vortices form, exhibits variations among different breakup modes. To capture the interplay between the breakup modes and wake vortex formation, the velocity at a location in the nitrogen on the leeward side of the droplet is considered. The velocities at the wake region in the Z and R directions, denoted as
 $U_{V,Z}$
and
 $U_{V,R}$
, are normalised with respect to the post-shock velocity as
 $U_{V,Z}^{*}={U_{V,Z}}/{U_{Z,\textit{POST}}}$
and
 $U_{V,R}^{*}={U_{V,R}}/{U_{Z,\textit{POST}}}$
, respectively. The vorticity magnitude at the same location (ω) is calculated as
 $\omega ={\partial U_{r}}/{\partial z}-{\partial U_{z}}/{\partial r}$
, where
 $U_{r}$
and
 $U_{z}$
are the velocity components in the R and Z directions, respectively. The vorticity magnitude is normalised with respect to the post-shock gas velocity and droplet diameter as
 $\omega ^{*}=\omega ({d_{0}}/{U_{Z,\textit{POST}}})$
. The centroid displacement, centroid velocity, rim velocity and the vorticity vectors are schematically shown in figure 12(a). As both the surface tension and density ratio vary concurrently, adjustments are made to the initial shock strength across different cases to maintain consistent Weber numbers despite variable density ratios. Consequently, the post-shock speed is augmented with higher density ratios to align with the Weber number. Figure 12(b) shows the variation of normalised droplet displacement plotted as a function of density ratio for a wide range of post-shock speeds for all cases outlined in table 1. An increase in normalised displacement with an increase in density ratio is observed for all post-shock speeds. The displacement of the droplet centroid at a constant density ratio and constant surface tension increases with the post-shock gas velocity, which is reflected in an increased Weber number. The droplet displacement (figure 12
b) is found to be higher at lower density ratios, typically in the range of 8–30, and gradually decreases as the density ratio increases further. This variation in droplet motion arises primarily from differences in droplet inertia, which dominate the influence of density ratio on deformation dynamics over the non-dimensional time scale. The momentum transferred to the droplet from the gas is inversely proportional to the density ratio considering a simple correlation between the liquid and gas phase momentum as
 $\rho _{l}U_{Z,D}^{2}\sim \rho _{g}U_{Z,\textit{POST}}^{2}$
, which implies that
 $U_{Z,D}\sim \sqrt{1/\rho ^{*}}U_{Z,\textit{POST}}$
. The droplet displacement has been shown to decrease with an increase in density ratio at a constant post-shock speed for subcritical water aerobreakup simulations with a density ratio varying from 10 to 1000 (Jain et al. Reference Jain, Neha, Surya Prakash, Ravikrishna and Gaurav2019). In contrast to water droplet–shock interactions, surface tension behaves differently at transcritical conditions. Initially, it increases with a rising density ratio before undergoing a significant decrease. Therefore, at comparable Weber numbers, the droplet displacement and relative velocity increase with an increase in density ratio. This unique behaviour further underscores the complex interplay between surface tension and density ratio in transcritical scenarios.
Figure 13 compares the ratio of the velocity components at the windward and leeward sides of the deformed droplet to shed light on different droplet morphologies observed in figure 10. The terminologies used for velocity components are defined in figure 12(a). Figure 13(a) plots the ratio of the rim velocity to the droplet centroid velocity (
 $U_{Ri,Z}/U_{C,Z}$
) in the Z direction at the windward side of the droplet. For density ratios spanning from 8 to 30, the rim velocity surpasses the droplet centroid velocity in the Z direction, leading to the crescent shape observed in table 2. Conversely, for density ratios between 50 and 130, the rim velocity and centroid velocity are comparable, supporting the observed flat disc formation as depicted in figure 10 and table 2. Interestingly, the trend observed in the rim-to-centroid velocity ratio in figure 13(a) is independent of the post-shock speed, while it is highly variable with the density ratio given by the correlation
 ${U_{Ri,Z}}/{U_{C,Z}}=2.51({\rho ^{*}})^{-0.174}$
with an R-squared equal to 0.967. Figure 13(b) depicts the ratio of the rim velocity in the Z direction to the velocity in the wake region at the leeward side of the droplet, i.e. (
 $U_{Ri,Z}/U_{V,Z}$
). For density ratios ranging from 85 to 130, this ratio is approximately 0.1, indicating that the rim velocity is lower than the velocity at the leeward side of the droplet, which leads to elongation and extension of the rims in the Z direction irrespective of the post-shock speed and is given by the exponential correlation
 ${U_{Ri,Z}}/{U_{V,Z}}=0.43e^{-0.02{\rho ^{*}}}$
with an R-squared equal to 0.984. Figure 13(c) illustrates the ratio of the rim velocity in the Z direction to the rim velocity in the R direction (
 $U_{Ri,Z}/U_{Ri,R}$
). At lower density ratios, the rim velocity in the Z direction exceeds the R direction rim velocity, resulting in droplet stretching along with the rim pointing towards the gas flow direction from left to right. Conversely, for higher density ratios, the rim points in the radial direction as the rim velocity in the radial and streamwise directions become comparable. The trend observed in the rim velocity further justifies the droplet morphological changes with density ratio. Finally, comparing the streamwise and radial components of the wake velocity, i.e. (
 $U_{V,Z}/U_{V,R}$
) presented in figure 13(d), indicates that the streamwise component of velocity increases consistently with an increase in density ratio as the Z-direction velocity significantly increases with gas speed. Therefore, the quantitative analysis of rim-to-centroid velocity clearly describes the changes observed in droplet morphology. A higher post-shock velocity leads to a higher radial velocity in the wake region. Additionally, figure 13(e) indicates exceptionally high vorticity for lower density ratios of 8–12, as the lower surface tension and higher rim velocity in the Z direction facilitate the droplet deformation, which leads to vorticity generation at the leeward side of the droplet.
Variation of (a) rim to the droplet centroid velocity in the Z direction (
 $U_{Ri,Z}/U_{C,Z})$
, (b) rim velocity to the velocity at the wake of the droplet in the Z direction (
 $U_{Ri,Z}/U_{V,Z})$
, (c) rim velocity in the Z direction to the rim velocity in the R direction (
 $U_{Ri,Z}/U_{Ri,R})$
, and (d) velocity at the wake of the droplet in the Z and R direction (
 $U_{V,Z}/U_{V,R})$
, (e) normalised rim vorticity (
 $\omega ^{*})$
with density ratio; variation with density ratio for post-shock speed varying from 10 to 50 ms−1.

(a) A schematic of the droplet thickness, transverse and normal rim expansion, and transverse and normal growth rate; (b) variation of normalised droplet thickness with density ratio with Weber number; (c) transverse rim expansion; (d) normal rim expansion varying versus density ratio for Weber numbers varying from 3 to 100; (e) transverse and (f) normal growth rate for the identified transcritical breakup modes.

4.5.3. Relationship between droplet deformation rate and breakup modes
As depicted in table 2, the deformed droplet not only exhibits a variation in curvature, transitioning from a crescent-shaped to a nearly flat disc but also demonstrates changes in thickness corresponding to the density ratio at a constant
 ${\textit{We}}$
. The thickness of the deformed droplet varies with density ratio and
 ${\textit{We}}$
. The total breakup time increases when breakup occurs due to the fragmentation of the extended rims on the wake of the droplet, whereas the breakup of the curved sheet into two or three blobs occurs over a shorter period of time. The thickness of the deformed droplet, represented as (
 $d_{t}$
) and depicted schematically in figure 14(a), is normalised by the initial droplet diameter (
 $d_{0}$
) denoted as
 $d^{*}$
. This parameter is calculated as the ratio of the instantaneous droplet thickness at the onset of breakup (i.e.
 $T_{b}^{*}$
) to the initial droplet thickness as
 $(d^{*}= {d_{t}}/{d_{0}})$
. The variation of normalised droplet thickness with density ratio changing from 8 to 130 for
 ${\textit{We}}$
= 20, 35, 75, 100 is shown in figure 14(b). The critical
 ${\textit{We}}$
for each case is denoted as a reference. Figure 14(b) illustrates that
 $d^{*}$
decreases as
 ${\textit{We}}$
increases. Here
 $d^{*}$
is notably higher at
 $\rho ^{*}$
= 8 and
 $\rho ^{*}$
= 130 compared with the droplet thickness observed for 12
 $\lt \rho ^{*}\lt$
100. It is noted that the changes in droplet thickness depend on the simultaneous effects of surface tension and post-shock density. The thickness of the deformed droplet decreases with an increase in
 ${\textit{We}}$
for a constant density ratio and constant surface tension coefficient. This behaviour is expected as
 ${\textit{We}}$
is correlated with post-shock speed, which facilitates the sheet-thinning process. Therefore, with an increase in density ratio from 8 to 35, which results in an increase in surface tension, the droplet thickness decreases more drastically as the post-shock speed is increased to maintain the same
 ${\textit{We}}$
among all cases. However, given the lower surface tension coefficient at
 $\rho ^{*}=$
8 and 130, the post-shock speed in these cases is also lower to maintain the same
 ${\textit{We}}$
. Therefore, at comparable
 ${\textit{We}}$
, these two cases exhibit a thicker deformed droplet and less lateral expansion.
Accurately capturing how the surface area of deformed droplets expands is key to understanding how their evaporation behaviour can shift with different breakup modes. Thus, a quantitative comparison of the transverse rim expansion (
 ${R_{t}}^{*}$
) and the normal rim expansion (
 ${R_{n}}^{*}$
) for all different cases considered in this study are compared in figure 14(c–d). Here
 $R_{t}$
refers to the radial expansion of the droplet, which is a critical parameter indicating the rate of droplet deformation. A higher rate of radial expansion typically suggests stronger aerodynamic loading, while limited expansion points to the stabilising influence of surface tension. Tracking
 $R_{t}$
provides insight into droplet stability, the onset of breakup and the dominant breakup mechanism (vibrational, bag or shear-induced). The rim expansion is defined as the extension of the rim in the normal and transverse directions normalised with respect to the initial droplet diameter as schematically depicted in figure 14(a). For lower
 ${\textit{We}}$
, i.e.
 ${\textit{We}} =$
3 and 8, the droplet retains its original shape and does not develop a rim structure. Thus, the normal expansion and the transverse expansion are represented with the droplet radius, i.e.
 ${R_{t}}^{*}=$
0.5. For
 ${\textit{We}}$
ranging between 12 and 100, the transverse expansion increases with
 ${\textit{We}}$
consistently for all density ratios shown in figure 14(c). However, the transverse expansion first increases and then decreases within the range of
 $1.3{\lt R_{t}}^{*}\lt 2$
with an increase in density ratio, consistent with the changes in surface tension. The normal expansion depicted in figure 14(d) is less affected by the density ratio and consistently increases with an increase in
 ${\textit{We}}$
as higher post-shock gas speeds promote deformation into a crescent shape with a considerable curvature. With an increase in density ratio beyond 30, there is a reduction in normal expansion due to the formation of flat discs as opposed to a curved sheet at comparable
 ${\textit{We}}$
. Furthermore, the normal rim expansion for
 ${\textit{We}}$
= 50 and 75 at density ratios of 50, 85 and 100 far surpasses that of
 ${\textit{We}}$
= 100. This is attributed to the whiplash with sheet-thinning breakup modes characterised by elongated ligament formations at the rims, which further extend the droplet’s normal growth rate.
To better understand the factors influencing various breakup modes and droplet surface exposed to evaporation, the deformed droplet’s growth in the horizontal and vertical directions across a range of
 ${\textit{We}}$
and density ratios is illustrated in figure 14(e–f). The normal and transversal growths are schematically shown in figure 14(a). This growth metric differs from rim expansion as it signifies the overall expansion of the droplet from its initial stage, contrasting with rim expansion, which only indicates the development of the droplet’s rims once they are formed. The normal growth (
 ${G_{n}}^{*}={G_{n}}/{d_{0}}$
) is calculated by measuring the relative distance along the axial direction between the droplet’s centre of mass and the end of the rims throughout the breakup period. Concurrently, the transversal growth (
 ${G_{t}}^{*}={G_{t}}/{d_{0}}$
), representing the increase in droplet width perpendicular to the axis of symmetry, is normalised by the initial droplet diameter. The results reveal a remarkable range of growth variation in the whiplash with the sheet-thinning mode, attributed to elongated fragments at the peripheries of the droplet. While the normal growth exhibited similarity among the backward bag, forward bag and backward bag with sheet-thinning modes, their differentiation became apparent through the transverse growth. Notably, distinct orientations of droplet edges were observed in forward and backward breakup modes. The backward bag with a sheet-thinning breakup mode exhibited a significantly reduced transverse growth compared with regular sheet-thinning and whiplash with sheet-thinning modes. As expected, the vibrational breakup mode is characterised by a lower transverse growth compared with all other modes as the droplet does not go through significant changes in shape.
The quantitative analysis reveals density ratio and surface tension impacts on the breakup, with several parameters including droplet displacement, velocity and rim kinematics showing the aerobreakup trends. Higher
 ${\textit{We}}$
result in faster initial deformation, whereas the deformation time scale initially rises with density ratio but subsequently decreases for higher density ratios. The onset of breakup inversely correlates with
 ${\textit{We}}$
and density ratio for a
 ${\textit{We}}$
lower than 85. Rim velocity relative to droplet centroid velocity explains the shift in the breakup mechanism with density ratio at constant
 ${\textit{We}}$
. Lower density ratios lead to higher rim velocities and crescent-shaped droplets, while higher density ratios result in flat disc formation. Curvature and thickness vary with density ratio and
 ${\textit{We}}$
, showing thinner droplets with increasing
 ${\textit{We}}$
. Rim expansion increases with
 ${\textit{We}}$
but fluctuates with the density ratio, decreasing at higher density ratios due to flat disc formation. Finally, the growth analysis provides a valuable method to capture shifts in breakup modes and predict the surface area exposed to evaporation.
5. Summary and conclusions
This study examines the intricate interplay of surface tension and density ratio on droplet breakup at transcritical conditions, elucidating disparities between subcritical aerobreakup and supercritical aerobreakup. The importance of considering surface tension, equation of state and density ratio in predicting droplet aerobreakup behaviour under transcritical conditions is shown. A 50-micron n-dodecane droplet at a subcritical temperature exposed to a planar shockwave traversing a supercritical nitrogen environment is considered to represent the aerobreakup behaviour at transcritical conditions. Employing a DIM within a 2-D axisymmetric framework, this study utilised a standard four-equation model that incorporated surface tension effects closed by the PR-EoS to capture the real-gas effects. The following conclusions are drawn from this study. The presence of surface tension inhibits excessive radial expansion, maintaining a more vertical orientation of the droplet’s leading edge during breakup, contrasting with the more pronounced deformation and convergence observed in its absence. This distinction impacts vorticity generation and the formation of thinner droplet sheets, particularly evident in the aft region. A comparative analysis of droplet breakup modes under subcritical and supercritical conditions shows that despite similar density ratios and Weber numbers, droplets in the supercritical environment exhibit a faster breakup, transforming into thin arc-shaped structures with well-developed vortices, compared with the subcritical environment still in the transitional phase. This discrepancy arises from disparities in post-shock speed, speed of sound, surface tension and nitrogen density, with the supercritical case showing a higher speed of sound ratio and increased gas velocity, facilitating earlier droplet deformation and breakup, accentuated by lower surface tension effects. The critical Weber number for transcritical conditions demonstrates a dynamic relationship with surface tension, ranging from a minimum of 7 to a maximum of 18 across density ratios, revealing the influence of density ratio and surface tension on droplet breakup dynamics. This behaviour distinguishes transcritical from subcritical aerobreakup (critical Weber number of 12) phenomena. An interesting observation specific to the transcritical breakup regime map is the coexistence of five distinct breakup modes for 18 <
 ${\textit{We}}$
< 100 spanning density ratios from 8 to 130, including backward bag, bag with sheet-thinning, sheet-thinning, whiplash with sheet-thinning and forward bag with sheet-thinning breakup modes. The duration for the droplet to adopt a bag or disc morphology (initial deformation), showcases an inverse relationship with the Weber number for a constant density ratio due to heightened post-shock gas velocities, particularly accentuated at lower density ratios. The onset of the breakup time scale (
 $T_{b}^{*}$
) exhibits an inverse proportionality to the Weber number across density ratios, with a notable delay in
 $T_{b}^{*}$
observed at lower density ratios, attributable to the transition from a thick disc to a bag with sheet-thinning, governed by surface tension effects. The lower Weber numbers entail breakup into separate droplets, which delays the breakup time, while higher Weber numbers induce rapid thinning and fragmentation, accelerating the breakup. A crescent-shaped formation for
 $\rho ^{*}$
< 30, contrasting with a flat disc configuration for ratios between 50 and 130, highlights the pivotal role of density ratio in shaping droplet morphology. The ratio of rim velocity to wake region velocity explains the elongation of rims in the Z direction observed for density ratios 85−130, indicative of downstream-oriented breakup. The droplet centroid velocity, rim velocity and the velocity in the wake region further describe the changes in breakup mechanisms at transcritical conditions. Finally, the variations in expansion patterns distinguish between different modes such as forward/backward bag, sheet-thinning and whiplash with sheet-thinning, providing valuable insights into the underlying physics governing droplet fragmentation and the surface area exposed to evaporation under transcritical conditions. Future work involves considering the role of decaying surface tension and heat transfer on droplet breakup over time and extending the simulations to a 3-D configuration.
Supplementary movies
Supplementary movies are available at https://doi.org/10.1017/jfm.2026.11223.
Acknowledgements
The support from the National Science Foundation, United States under Award No. #2237124 under the supervision of Dr Ron Joslin is greatly appreciated. The support from Texas A&M High-Performance Research Computing (HPRC) for conducting the simulations is acknowledged.
Declaration of interests
The authors report no conflict of interest.
Appendix A.
A.1. Mixture rules associated with the PR-EoS
Partial derivatives and thermodynamic quantities based on PR-EoS, used for evaluating other thermodynamic variables are listed in (A1)–(A6):
 \begin{align} \left(\frac{\partial p}{\partial T}\right)_{\nu ,{\alpha _{i}}} &=\frac{R}{v-b}-\frac{(\partial a/\partial T)\alpha _{i}}{v^{2}+2bv-b^{2}}, \end{align}
 \begin{align} \left(\frac{\partial p}{\partial v}\right)_{T,{\alpha _{i}}} &=-\frac{RT}{(v-b)^{2}}\left\{1-2a\left[RT(v+b)\left(\frac{v^{2}+2bv-b^{2}}{v^{2}-b^{2}}\right)^{2}\right]^{-1}\right\}, \end{align}
 \begin{align} \left(\frac{\partial a}{\partial T}\right)_{{\alpha _{i}}} &=-\frac{1}{T}\sum _{D=1}^{2}\,\sum _{S=1}^{2}\,\alpha _{D}\alpha _{S}a_{\textit{DS}}G_{\textit{DS}}, \end{align}
 \begin{align} \left(\frac{\partial ^{2}a}{\partial T^{2}}\right)_{{\alpha _{i}}} &=0.457236\frac{R^{2}}{2T}\sum _{D=1}^{2}\,\sum _{S=1}^{2}\,\alpha _{D}\alpha _{S}c_{\textit{DS}}\left(1+c_{\textit{DS}}\right)\frac{T_{\textit{c,DS}}}{p_{\textit{c,DS}}}\sqrt{\frac{T_{\textit{c,DS}}}{T}}, \end{align}
 \begin{align} G_{\textit{DS}} &=\frac{c_{\textit{DS}}\sqrt{\dfrac{T}{T_{\textit{c,DS}}}}}{1+c_{\textit{DS}}\left(1-\sqrt{\dfrac{T}{T_{\textit{c,DS}}}}\right)}, \end{align}
 \begin{align} K_{1}&=\int _{+{\infty }}^{v}\,\frac{1}{v^{2}+2bv-b^{2}}dv =\frac{1}{2\sqrt{2}b}\ln \left(\frac{v+(1-\sqrt{2})b}{v+(1+\sqrt{2})b}\right). \end{align}
The specific heat capacity at constant volume is evaluated as
 $c_{v}=({\partial e}/{\partial T})_{v,{\alpha _{i}}}=c_{v}^{0}-K_{1}T({\partial ^{2}c}/{\partial T^{2}})_{{\alpha _{i}}}$
, where
 $c_{v}^{0}$
is the specific heat at constant volume for an ideal gas. The specific heat capacity at constant pressure is evaluated as
 $c_{p}=({\partial h}/{\partial T})_{p,{\alpha _{i}}}=c_{p}^{0}-R-K_{1}T({\partial ^{2}a}/{\partial T^{2}})_{{\alpha _{i}}}-T({(\partial p/\partial T)_{v,\alpha _{i}}^{2}}/{(\partial p/\partial v)_{T,{\alpha _{i}}}})$
, where
 $c_{p}^{0}$
is the specific heat at constant pressure for an ideal gas and the last term is the difference between the two specific heat capacities.
The speed of sound for general real fluids can be evaluated as
 $c^{2}=({\partial p}/{\partial \rho })_{s,{\alpha _{i}}}={\gamma }/{\rho K_{T}}$
, where
 $\gamma$
is the specific heat ratio and
 $\kappa _{T}$
is the isothermal compressibility defined as
 $\kappa _{T}=-({1}/{v})({\partial v}/{\partial p})_{T,{\alpha _{i}}}$
.
A.2. Modified Peng-Robinson EoS
The algorithm for determining the pressure given the density, temperature and mass fraction is as follows (Boyd & Jarrahbashi Reference Boyd and Jarrahbashi2021a ).
-
(i) Compute the pressure from the PR-EoS given the density, temperature and mass fraction. If the pressure is less than zero then set the pressure to an arbitrarily low value, i.e. 1 Pa.
-
(ii) Compute the PR-EoS density from the temperature, mass fraction and PR-EoS pressure. From the PR-EOS density calculation, determine if there is more than one root.
-
(iii) If there is more than one root from the PR density calculation, then compute the saturation pressure; otherwise, the PR-EoS pressure is returned as the correct pressure. The saturation pressure is given by computing the root, ∂p/ ∂ρ = 0, of the PR-EoS. Typically, there are two roots; the root of interest is the one at the lower density value. The saturation pressure is then defined as the pressure corresponding to this root.
-
(iv) If the density that is given by the PR-EOS (lowest density root) is very similar to the density provided, then return the PR-EoS pressure; otherwise, return the saturation pressure.
A.3. Mixture rules associated with ST-EoS
The gas
 $({\textrm{g}})$
and liquid
 $(l)$
volume fractions are related by
 $\phi _{g}=1-\phi _{l}$
. The local density is given by
 $\rho =\rho _{l}\phi _{l}+\rho _{g}\phi _{g}$
with internal energy
 $\rho e=\rho _{l}\phi _{l}e_{l}+\rho _{g}\phi _{g}e_{g}$
and the mixture parameters
 $\Gamma$
and
 $\Pi$
are given by
 $\Gamma ={1}/{\gamma -1}-\Gamma _{g}\phi _{g}+\Gamma _{l}\phi _{l}, \Pi ={\gamma \pi _{{\infty }}}/{\gamma -1}-\Pi _{g}\phi _{g}+\Pi _{l}\phi _{l}$
, where
 $\Gamma _{g}=1/(\gamma _{g}-1)$
and
 $\Pi _{g}=\gamma _{g}\pi _{{\infty },g}/(\gamma _{g}-1)$
with
 $\Gamma _{l}$
and
 $\Pi _{\textrm{l}}$
defined similarly with the liquid parameters. The local energy can then be written as
 $E=\Gamma p+\Pi +({1}/{2})\rho \boldsymbol{u}\boldsymbol{\cdot }\boldsymbol{u}$
(Jangale, Boyd, and Jarrahbashi Reference Jangale, Bradley and Dorrin2024).
A.4. Spatial discretisation
This section outlines more details about special discretisation for multidimensional conservation. Equation (A7) is the conservation law where
 $\boldsymbol{U}=[\rho ,\alpha _{1}\rho ,\rho u_{r},\rho u_{z},E]^{T}$
are the state variables,
 $\boldsymbol{F}=[\rho u_{r},\alpha _{1}\rho u_{r},\rho u_{r}u_{r}+p,\rho u_{r}u_{z},u_{r}(E+p)]^{T}$
is the flux in the r direction,
 $\boldsymbol{G}=[\rho u_{z},\alpha _{1}\rho u_{z},\rho u_{r}u_{z},\rho u_{z}u_{z}+p,u_{z}(E+p)]^{T}$
is the flux in the z direction and
 $\boldsymbol{S}=[0,0,0,0,0]^{T}$
is the source term:
 \begin{equation}\frac{\partial \boldsymbol{U}(x,y,t)}{\partial t}+\frac{\partial \boldsymbol{F}(\boldsymbol{U}(x,y,t))}{\partial x}+\frac{\partial \boldsymbol{G}(\boldsymbol{U}(x,y,t))}{\partial y}=\boldsymbol{S}(\boldsymbol{U}(x,y,t)).\end{equation}
By integrating over the interval
 $I_{i,j}=[x_{i-1/2},x_{i+1/2}]\times [y_{j-1/2},y_{j+1/2}]$
, (A8) is derived where
 ${\boldsymbol{\hat{F}}}_{i-({1}/{2})}={\boldsymbol{H}}({\boldsymbol{U}}_{i-({1}/{2}),y_{j}+0.5{\Delta} y_{j}}^{L},{\boldsymbol{U}}_{i-({1}/{2}),y_{j}+0.5{\Delta} y_{j}}^{R})$
,
 ${\boldsymbol{\hat{G}}}_{i-({1}/{2})}= {\boldsymbol{H}}({{\boldsymbol{U}}}_{x_{i}+0.5{\Delta} x_{i},j-({1}/{2})}^{L}, {{\boldsymbol{U}}}_{x_{i}+0.5{\Delta} x_{i},j-({1}/{2})}^{R})$
and
 ${\boldsymbol{H}}$
is the HLLC Reimann flux with the conserved variables
 ${{\boldsymbol{U}}}^{\boldsymbol{L}}$
and
 ${{\boldsymbol{U}}}^{\boldsymbol{R}}$
at the quadrature points found using the weighted essentially non-oscillatory (WENO) reconstruction procedure:
 \begin{equation}\frac{{\textrm d}\overline{{{\boldsymbol{U}}}}_{i,j}(t)}{{\textrm d}t}=\frac{1}{{\Delta} x_{i}}\left({\boldsymbol{\hat{F}}}_{i-\tfrac{1}{2}}-{\boldsymbol{\hat{F}}}_{i+\tfrac{1}{2}}\right)+\frac{1}{{\Delta} y_{j}}\left({\boldsymbol{\hat{G}}}_{j-\tfrac{1}{2}}-{\boldsymbol{\hat{G}}}_{j+\tfrac{1}{2}}\right)+\frac{{\textrm d}\overline{\boldsymbol{S}}_{i,j}(t)}{{\textrm d}t}.\end{equation}
A.5. Temporal discretisation
The RK3-TVD scheme is used for the temporal discretisation of the
 ${{\textrm d}\overline{{{\boldsymbol{U}}}}(t)}/{{\textrm d}t}=\zeta (\overline{{{\boldsymbol{U}}}})$
conservation equation given by (A9), where (n) is the previous step and
 $({n}+1)$
is the current step:
 \begin{align}\overline{{{\boldsymbol{U}}}}_{1} &=\overline{{{\boldsymbol{U}}}}^{n}+{\Delta} t\zeta \left(\overline{{{\boldsymbol{U}}}}^{n}\right)\nonumber\\ \overline{{{\boldsymbol{U}}}}_{2} &=\left(\frac{3}{4}\right)\overline{{{\boldsymbol{U}}}}^{n}+\left(\frac{1}{4}\right)\overline{{{\boldsymbol{U}}}}_{1}+\left(\frac{1}{4}\right){\Delta} t\zeta \left(\overline{{{\boldsymbol{U}}}}_{1}\right)\nonumber\\ \overline{{{\boldsymbol{U}}}}^{n+1} &=\left(\frac{1}{3}\right)\overline{{{\boldsymbol{U}}}}^{n}+\left(\frac{2}{3}\right)\overline{{{\boldsymbol{U}}}}_{2}+\left(\frac{2}{3}\right){\Delta} t\zeta \left(\overline{{{\boldsymbol{U}}}}_{2}\right). \end{align}
The CFL condition for the axis-symmetric coordinates is given by
 \begin{equation}{\Delta} t=\frac{\text{ CFL }}{\max \left(\frac{\left| u_{r}\right| +c}{{\Delta} r}+\frac{\left| u_{z}\right| +c}{{\Delta} z}\right)}.\end{equation}
A.6. The WENO reconstruction
A higher-order accurate scheme is used for the reconstruction of the state variables
U
. A local characteristic decomposition of the primitive variables
V
is shown in (A11). First, we decompose the Jacobian in the x direction
 $\boldsymbol{A}=\boldsymbol{Q}_{\kern-1.5pt i}\boldsymbol{\varLambda }_{i}\boldsymbol{Q}_{\kern-1.5pt i}^{-1}$
, with
Q
as the eigen vectors and
 $\boldsymbol{\varLambda }$
as the eigen values; the characteristic variables
 $\boldsymbol{W}$
are obtained using the projection of the primitive variable onto the characteristic fields as
 $\boldsymbol{W}=\boldsymbol{Q}_{\kern-1.5pt i}^{-1}\boldsymbol{V}$
; then WENO reconstruction is performed, and finally, the characteristic variables are projected back to the physical space
 $\boldsymbol{V}=\boldsymbol{Q}_{\kern-1.5pt i}\boldsymbol{W}$
. This process is repeated for the ydirection with the Jacobian as
 $\boldsymbol{B}=\boldsymbol{Q}_{\kern-1.5pt j}\boldsymbol{\varLambda }_{\kern-1.5pt j}\boldsymbol{Q}_{\kern-1.5pt j}^{-1}$
; projection as
 $\boldsymbol{W}=\boldsymbol{Q}_{\kern-1.5pt j}^{-1}\boldsymbol{V}$
to perform WENO reconstruction and finally projected back into the physical space as
 $\boldsymbol{V}=\boldsymbol{Q}_{\kern-1.5pt j}\boldsymbol{W}$
.
The quasi-linear primitive-variable form of a hyperbolic system, where the Jacobians describe characteristic wave propagation in the
 $x$
and
 $y$
directions.
 \begin{equation} \boldsymbol{V}_{t}+\boldsymbol{A}(\boldsymbol{V})\boldsymbol{V}_{x}+\boldsymbol{B}(\boldsymbol{V})\boldsymbol{V}_{y}=\boldsymbol{0}.\end{equation}
A.7. The HLLC approximate Riemann solver
The Godunov-type schemes require solving the Riemann problem through the approximate HLLC method to reduce the computational costs of the exact method. The flux calculations are given by (A12) and (A13), where
K = R, L
the wave speeds are given by
 $s^{-}=\min (0,s^{L}),\, s^{+}=\max (0,s^{R})$
and
 $s^{L}=\min (\overline{u}_{x}-\overline{c},u_{x}^{L}-c^{L}),s^{R}=\max (\overline{u}_{x}+\overline{c},u_{x}^{R}+c^{R})$
. Also the intermediate wave speed is given by
 $s^{\textrm{*}}= ({p^{R}-p^{L}+\rho ^{L}u_{x}^{L}(s^{L}-u_{x}^{L})-\rho ^{R}u_{x}^{R}(s^{R}-u_{x}^{R})})/({\rho ^{L}_{L}(s^{L}-u_{x}^{L})-\rho ^{R}_{R}(s^{R}-u_{x}^{R})})$
.
The HLLC flux calculation is given by (A12) and intermediate flux at K = R, L is given by (A13)
 \begin{align} {\boldsymbol{H}}_{x}^{\textit{HLLC}} &=\frac{1-{\textrm{sgn}} (s^{\textrm{*}})}{2} \big[\boldsymbol{F}^{L}+s^{-}\! \big({{\boldsymbol{U}}}^{\textrm{*}L}-{{\boldsymbol{U}}}^{L} \big) \big]+\frac{1-{\textrm{sgn}} (s^{\textrm{*}})}{2}\big[\boldsymbol{F}^{R}+s^{+}\! \big({{\boldsymbol{U}}}^{\textrm{*}R}-{{\boldsymbol{U}}}^{R} \big) \big], \end{align}
 \begin{align} {{\boldsymbol{U}}}^{\textrm{*}K} &=\left(\frac{s^{K}-u_{x}^{K}}{s^{K}-s^{K}}\right)\left(\begin{array}{c} (\rho)^{K}\\ (\alpha _{1}\rho)^{K}\\ \rho ^{K}s^{K}\\ (\rho u_{y})^{K}\\ E^{K}+\left(s+-u_{x}^{K}\right)\left(\rho ^{K}s^{\textrm{*}}+\frac{p^{K}}{s^{K}-u_{x}^{K}}\right)\\ \end{array}\right). \end{align}
A.8. Post-shock property calculations
The normal shock wave relations (Staff Reference Staff1953) are used to approximate the post-shock Mach number, pressure and temperature as follows:
 \begin{align} M_{\textit{POST}} &=\sqrt{\frac{\left(\gamma ^{*}-1\right)M^{2}+2}{2\gamma M^{2}-\left(\gamma ^{*}-1\right)}}, \end{align}
 \begin{align} p_{\textit{POST}} &=p_{\textit{PRE}}\left(\frac{2\gamma ^{*}M^{2}-\left(\gamma ^{*}-1\right)}{\gamma ^{*}+1}\right), \end{align}
 \begin{align} T_{\textit{POST}} &=T_{\textit{PRE}}\frac{\left(2\gamma ^{*}M^{2}-\left(\gamma ^{*}-1\right)\right)\left(\left(\gamma ^{*}-1\right)M^{2}+2\right)}{\left(\gamma ^{*}+1\right)^{2}M^{2}}. \end{align}
Here the specific heat ratio
 $(\gamma ^{*})$
is approximated using the PR-EoS (Ma, Lv, & Ihme Reference Ma, Yu and Matthias2017; Boyd & Dorrin Reference Boyd and Jarrahbashi2021b
). We can then determine the post-shock density of nitrogen using the PR-EoS and the post-shock velocity given by
 \begin{equation}u_{\textit{POST}}=u_{S}\left(1-\frac{M_{\textit{POST}}}{M}\sqrt{\frac{T_{\textit{POST}}}{T_{\textit{PRE}}}}\right),\end{equation}
where
 $u_{S}$
is the shock velocity.
Appendix B. Variation of density and volume fraction inside the droplet
Consider case 3 from table 1 at a Weber number equal to 14 and a density ratio of 18. The temperature of n-dodecane is 363 K and that of nitrogen is 900 K and the operating pressure is 10 MPa. The surface tension coefficient is 0.015 N m−1 for this case. The density within the droplet is compared between the PR-EoS and ST-EoS in figure 15(a–d), where the bottom half is associated with PR-EoS and the top half shows the simulation results conducted using ST-EoS. The black isoline indicates the volume fraction of 0.95 to exhibit the droplet morphology. The variation of density inside the droplet, i.e. the black isoline, during shock passage varies between 500 and 650 kg m−3 (orange in colour). The changes in density suggest that the droplet remains in a LL state throughout the aerobreakup.
Comparison of density between equation of states (PR-EoS and ST-EoS) for case 3 at
 ${\textit{We}}$
= 14 and
 $\rho ^{*}$
= 18 at
 $t^{*}$
= 0.0, 0.6, 1.0, 1.5 in (a–d), respectively. For each image, the bottom half is simulated with PR-EoS and top half is associated with ST-EoS. The black line indicates the isoline of the volume fraction at 0.95 (
 $\alpha _{D}$
= 0.95).

A 50 µm n-dodecane droplet at an initial temperature of 363 K is exposed to nitrogen at 900 K and 3.5 MPa. Under these conditions, the liquid-to-gas density ratio is approximately 50, where the surface tension is 0.026 N m−1. The droplet is subject to post-shock flow velocity equal to 11 ms−1, corresponding to a Weber number equal to 12. Figure 16 shows the temporal deformation of the droplet, represented by discrete contours of n-dodecane volume fraction varying from 0.05 to 0.95. All levels of volume fraction overlap on the droplet surface. The results indicate that, despite the diffuse interface framework, the THINC reconstruction scheme preserves a sharp representation of the droplet boundary and no smearing or discrepancy between various volume fractions is detected. The deformation sequence illustrates the progressive stretching and bending of the droplet, consistent with the expected capillary–inertial balance closer to critical Weber numbers (i.e. We ∼ 10). These observations validate the suitability of the present diffuse interface implementation with the THINC sharpening method for capturing droplet deformation under transcritical thermodynamic conditions.
Volume fraction contour showing deformation of a 50 µm n-dodecane droplet at 363 K in nitrogen at 900 K and 3.5 MPa at t * = 0, 0.5, 1.0, 1.5, 2.0. The deformation sequence demonstrates a sharp-interface representation and consistent breakup morphology at We ≈ 12 at a density ratio of 50.

Appendix C. Surface tension calculation via MD simulations
To calculate the surface tension coefficient implemented in the DNS solver, a MD simulation is set up with 6−9 Lennard–Jones potential function
 $\varphi (r)$
for molecular interactions given by (C1), where
 $\epsilon$
is the depth of the potential well,
 $l$
is the finite distance at which the inter-particle potential is zero and
 $r$
indicates the distance between the atoms. The large-scale atomic/molecular massively parallel simulator (LAMMPS) (Thompson et al. Reference Thompson2022) software is used for conducting the simulations with a sample case set-up shown in figure 17(a). The diameter of the n-dodecane droplet ranges from between 2 and 20 nm, while the simulation system consists of a cubic box measuring 65 nm on each side, surrounded by nitrogen molecules under periodic boundary conditions. Initial equilibration of temperature and pressure is conducted using an NPT ensemble, maintaining the number of molecules, pressure and temperature. The N-dodecane molecules are set at 363 K and nitrogen molecules at 900 K, with a pressure of 6 MPa. Subsequently, the primary simulation employs an NVE ensemble to maintain the number of molecules, volume and energy, with a time step of 2 fs, simulating a duration of 2 ns. The surface tension decay with time for the binary fluid system is calculated using the Irving–Kirkwood method (Irving and Kirkwood Reference Irving and John1950) based on the pressure tensor given in (C2). The local normal and tangential components of pressure tensor, i.e.
 $p_{N}(k)$
and
 $p_{T}(k)$
, respectively, are calculated in
 $k$
’s slab within the computational domain where
 $k=1,\, \ldots ,\, N_{s}$
. More details on the set-up and calculations are given in Jangale et al. (Reference Jangale, Ehsan, Mohammad and Dorrin2024). A range of simulations is performed with variations in droplet size from 2 to 20 nm, background temperature from 300 to 1100 K and background pressure from 1 to 20 MPa. We have shown in figure 17(b) that surface tension coefficient agrees well with the experimental measurements of surface tension (Jasper Reference Jasper1972; Koller et al. Reference Koller, Tobias, Cédric, Jiaqi, Ahmad, van der Laan, Michael and Andreas2017). The correlation coefficient of the surface tension coefficient to the droplet size and background pressure and temperature (table 3) shows the lowest correlation with the droplet size. Therefore, the calculations of surface tension coefficient that have been conducted for nanoscale droplets using MD simulations can be used in modelling microscale droplets (Jangale et al. Reference Jangale, Ehsan, Mohammad and Dorrin2024). In this study we consider a constant surface tension coefficient by assuming that the deformation timescale is shorter than the undroplet time, i.e. the time under which surface tension fully vanishes.
Correlation coefficients for the surface tension coefficient
 $(\sigma )$
.

(a) Simulation set-up showing nitrogen and n-dodecane molecules as marked. (b) Validation of the initial surface tension with experimental data from Jasper (Reference Jasper1972) and Koller et al. (Reference Koller, Tobias, Cédric, Jiaqi, Ahmad, van der Laan, Michael and Andreas2017).

 \begin{align} \varphi \left(r\right) &=\epsilon \left(2\left(\frac{l}{r}\right)^{9}-3\left(\frac{l}{r}\right)^{6}\right), \end{align}
 \begin{align} \sigma &=\frac{1}{2}\int _{0}^{N_{s}}\left(p_{N}(k)-p_{T}(k)\right){\textrm d}k. \end{align}
Appendix D. Surface tension validation
D.1. Static validation
To validate the surface tension formulation, static equilibrium tests were performed using a 2-D cylindrical liquid column placed in air. The liquid density is set to 1000 kg m−3, the surrounding air density to 1 kg m−3 and the column radius to 0.15 m. The baseline case employed a surface tension coefficient of 800 Nm−1. At equilibrium, capillary effects generate a pressure jump across the interface that should satisfy the Laplace relation in two dimensions, i.e.
 ${\Delta} P = {\sigma} /R$
, giving a theoretical pressure jump of
 ${\Delta} P =$
5347 Pa. Figure 18(a) shows the converged pressure profiles for both the conservative and non-conservative surface tension force formulations, compared with the theoretical Laplace prediction. The results predicted by K. Schmidmayer et al. (Reference Schmidmayer, Fabien, Eric, Nicolas and Sergey2017) using the conservative CSF approach is in good agreement with the non-conservative surface force model followed in the current study and both approaches agree well with the theoretical pressure drop.
Static validation of the surface tension force model. (a) Pressure jump across a cylindrical liquid column with σ = 800 Nm−1 compared with a conservative (Schmidmayer et al. Reference Schmidmayer, Fabien, Eric, Nicolas and Sergey2017), non-conservative (present study) surface force model employed in the DIM, and theoretical Laplace law predictions. (b) Variation of equilibrium pressure jump with surface tension coefficient (σ = 400, 800, 1200 Nm−1) for the non-conservative formulation compared against Laplace’s law.

To further assess the model behaviour, the test was repeated with three different surface tension coefficients, i.e. 400, 800 and 1200 N m−1. As shown in figure 18(b), the non-conservative surface force model correctly reproduces the expected linear dependence of the equilibrium pressure jump due to surface tension. However, consistent with the theoretical case, small deviations from the analytical values remain, especially with a higher surface tension coefficient. This underprediction is attributed to curvature smoothing inherent in the diffuse interface treatment that is resolved with the interface sharpening method (THINC), as shown in Garrick et al. (Reference Garrick, Mark and Jonathan2017). This small deviation is also common in SIMs and the DIM with the conservative surface tension force model.
D.2. Dynamic validation: recovery of circular shape
A dynamic test is conducted to assess the capability of the surface tension model to recover equilibrium shapes from a perturbed square initial state, with results compared with those reported by Schmidmayer et al. (Reference Schmidmayer, Fabien, Eric, Nicolas and Sergey2017). A square liquid column of side length 0.2 m is placed in quiescent atmospheric air with a pressure equal to 0.1 MPa. The liquid–air interface is subject to capillary forces with a surface tension coefficient of 800 N m−1. Driven by surface energy minimisation, the initially square interface evolves toward a circular shape of equivalent volume. After reaching an equilibrium state, the final pressure inside the liquid satisfies the Laplace law,
 $P_{\textit{droplet}}=P_{\textit{air}}+{\sigma} /R$
, where
 $R$
is the radius of the recovered circular droplet. Figure 19 shows the time evolution interface deformation obtained using a 400×400 mesh in the DIM model. The initially sharp corners of the square column rapidly smooth out as the shape evolves toward circular symmetry, with pronounced curvature-driven oscillations in the early transients. Over time, the liquid interface converges toward a stable circular geometry and the internal pressure approaches the theoretical Laplace jump. This test demonstrates the robustness of the non-conservative method in handling strongly deformed initial conditions while recovering the correct equilibrium state dictated by surface tension. The results are in good agreement with Schmidmayer et al. (Reference Schmidmayer, Fabien, Eric, Nicolas and Sergey2017) obtained using a conservative surface force model.
Magnified schlieren images of dynamic recovery of a square liquid droplet placed in quiescent air with time back to a circle. Interface evolution at (a) t = 0, (b) t = 6, (c) t = 15, (d) t = 20, (e) t = 30, (f) t = 45, (g) t = 50 and (h) t = 105 ms. Comparison is shown between the current study and Schmidmayer et al. (Reference Schmidmayer, Fabien, Eric, Nicolas and Sergey2017) at comparable times. The results are taken with permission from Schmidmayer et al. (Reference Schmidmayer, Fabien, Eric, Nicolas and Sergey2017).

Advection of a cylindrical liquid droplet in a uniform flow by comparing the centroid displacement predicted by the conservative surface force formulation (Schmidmayer et al. Reference Schmidmayer, Fabien, Eric, Nicolas and Sergey2017), the non-conservative surface force formulation (present study) and the theoretical trajectory. Droplet shape represented by phasic density and its gradient is included at t = 0.01 and 0.03 s.

D.3. Dynamic validation: droplet advection in convective flow
Another dynamic validation test is performed to examine the ability of the non-conservative method for advection of a liquid droplet while preserving the correct capillary pressure jump. The set-up consists of a cylindrical liquid column of radius 0.15 m placed in air, subjected to a uniform flow with a velocity of 50 ms−1. Initially, the droplet is in equilibrium with the surrounding air, with the internal pressure balanced by surface tension. Figure 20 compares the displacement of the droplet centroid predicted by the conservative surface force formulation by Schmidmayer et al. (Reference Schmidmayer, Fabien, Eric, Nicolas and Sergey2017) and non-conservative surface force formulations (current study) against the theoretical trajectory. In all cases, the simulated droplet position closely matches the analytical solution, showing that both formulations preserve droplet integrity and accurately transport the interface. This demonstrates their robustness for moving-interface problems. The droplet shape represented by phasic density and its gradient is also included at selected times of 0.01 and 0.03 s to show that the droplet morphology is not changed as it is displaced.
D.4. Dynamic validation: oscillating ellipsoidal droplet
The behaviour of a deformed droplet subject to surface tension forces isolated in a quiescent environment is used to validate the surface tension modelling procedure. A deformed drop initially at rest begins to move under surface tension forces, briefly forming a circular shape as potential energy converts into kinetic energy. Since this equilibrium cannot be maintained, the drop deforms into an ellipse, where kinetic energy is minimal and potential energy is maximised. Capillary forces then restore the circular shape and the cycle repeats. These oscillations arise from the continuous exchange between kinetic and capillary potential energy. The response of the deformed drop to surface tension serves as a useful benchmark for evaluating the method’s capability to capture instability dynamics. The case considers the oscillation of an initially ellipsoidal droplet described by (D1) (Perigaud and Saurel Reference Perigaud and Richard2005) as shown in figure 21(a). Oscillations are validated against global kinetic energy:
 \begin{equation}\frac{\left(x-0.5\right)^{2}}{a^{2}}+\frac{\left(y-0.5\right)^{2}}{b^{2}}=1.\end{equation}
Here
 $a=0.2$
and
 $b=0.12$
. The computational domain is represented as
 $\varOmega =[0,1]\times [0,1]$
with
 $200\times 200$
mesh cells using a CFL number equal to 0.8. The liquid density is
 $\rho _{l}=100\text{ kg}\,{\textrm{m}}^{-3}$
and the surrounding gas density is
 $\rho _{g}=1\text{ kg}\,{\textrm{m}}^{-3}$
. The theoretical period of oscillations can be computed as
 $T=2\pi \sqrt{{(\rho _{l}+\rho _{g})R^{3}}/{6\sigma }}$
, where
 $R=\sqrt{ab}$
is the equivalent circular radius. The surface tension coefficient is set to
 $\sigma =350\text{ Pa}\boldsymbol{\cdot }s$
, resulting in a period of radius oscillation of
 $T=0.084{\textrm{s}}$
. Figure 21(b) compares the global kinetic energy oscillations with the results of Perigaud and Saurel (Reference Perigaud and Richard2005), showing good agreement in the oscillation period of the droplet radius.
(a) Droplet oscillating test and global kinetic energy. (b) Temporal evolution of global kinetic energy for the oscillating droplet and comparison of present non-conservative results with reference data from Perigaud and Saurel (Reference Perigaud and Richard2005).

Comparison of the droplet morphology at We = 23 for different grid sizes (50, 100, 150 cells per droplet diameter). For each image, the top half represents the numerical schlieren images and the bottom half is the density. The green line indicates a droplet fraction (
 $\alpha _{D}$
) of 0.95.

Comparison of the droplet morphology at We = 23 for different grid sizes (100, 300, 500 cells per droplet diameter). For each image, the top half represents the numerical schlieren images and the bottom half is the density. The green line indicates a droplet fraction (
 $\alpha _{D}$
) of 0.95.

Appendix E. Grid resolution study
Case 4 from table 1 is considered for the grid resolution study. The droplet temperature is 363 K and the surrounding temperature and pressure are 900 K and 6 MPa. The density ratio is 30 and the Weber number is 23. Five cases are compared with 50, 100, 150, 300 and 500 cells within one droplet diameter at 0, 8, 13, 20 µs as shown in figures 22 and 23. The top half shows the numerical schlieren images and the bottom half exhibits the density. The green isoline indicates a droplet fraction of 0.95. The results of this study show that even with significantly higher grid resolution, the breakup mode and the shape of the
 $ \alpha D$
= 0.95 contour (which corresponds to the droplet’s interface) remain consistent with the results obtained from the original grid of 100 cells. It is noted that a finer grid leads to resolving smaller-scale vortices in the leeward side of the droplets; however, the droplet morphology remains the same. This behaviour ensures grid independence and confirms that the qualitative aspects of droplet breakup – our primary focus – are not affected by the grid resolution. A quantitative comparison of droplet centroid velocity and rim velocity in the z direction is provided in table 4. This comparison indicates that even at a resolution of 100 cells per diameter, the errors are within 1.5 %. This further supports the fact that the chosen resolution is sufficient for accurately capturing both the qualitative and quantitative aspects of the droplet dynamics relevant to our study.
Parameters for comparison for different mesh sizes (cells per droplet diameter).

Comparison of the droplet morphology at We = 14 for studying the effect of viscosity and conduction. For each image, the top half represents the numerical schlieren images and the bottom half is the density. The green line indicates a droplet fraction (
 $\alpha _{D}$
) of 0.95.

Comparing droplet morphology, pressure, density and vorticity contour between 2-D simulation (a) and 3-D simulation (b) for case 2 in table 1 at Mach 1.2 shock.

Appendix F. Effect of viscosity and thermal conduction
To evaluate the impact of viscosity and thermal conductivity on droplet breakup under transcritical conditions, we consider case 4 from table 1, which adopts the ECN spray A conditions. In this case, n-dodecane is at a temperature of 363 K, while nitrogen is at 900 K and 6 MPa. We compare three scenarios: (i) no viscosity or thermal conduction, (ii) viscosity only, and (iii) both viscosity and thermal conduction considered. Surface tension is considered in all cases. The differences in droplet deformation are illustrated in figure 24, with schlieren images (top half) and density contours (bottom half). The post-shock velocity is 12 ms−1 for all cases. The solid green line in figure 24 represents the n-dodecane volume fraction isoline of 0.95. For all the cases, the Weber number is 14. The comparison indicates that, for moderate Weber numbers, the effects of viscosity and thermal conduction are not significant.
Appendix G. Comparison of 2-D and 3-D simulations
We simulated case 2 from table 1 in figure 25, which features a density ratio of 12. Nitrogen is at 15 MPa pressure and 900 K temperature, and an n-dodecane droplet is at 363 K with a diameter of 50 µm. The Mach number is 1.2 and a similar set-up is used for 2-D simulations. Both 2-D and 3-D simulations effectively capture the early stages of droplet deformation (1.322d0 vertical droplet expansion for both cases) and the governing breakup mode (backward bag), and no significant effects of morphology are missed in the 2-D analysis. In addition to the droplet morphology, we have compared the vorticity structures as the 3-D effects are mainly captured in vortex tilting/stretching terms. The comparison between pressure and density contours also shows consistent behaviour between 2-D and 3-D results. While 3-D flows may exhibit azimuthal instabilities that begin before surface instabilities or wrinkling become visible, these early 3-D effects do not change the breakup modes. Therefore, 2-D simulations are sufficient for identifying early stage breakup modes and offer the benefit of reduced computational time. However, to fully capture the later stages of droplet breakup, such as ligament formation and ligament breakup, a complete 3-D framework will be necessary as will be pursued in our future work.
Comparison of droplet deformation at We = 10.9: (a) present diffuse interface results (2-D) and (b) Ling et al. (Reference Ling and Mahmood2023) simulations (VOF, 3-D). The results are taken with permission from Ling & Mahmood (Reference Ling and Mahmood2023).

(a) Comparison of the numerical schlieren from the simulation (top half) with experimental holographic images of a water cylinder impacted by a Mach 1.47 shock wave. The experimental results are taken with permission from Igra & Takayama (Reference Igra and Takayama2001). (b) Conservative sharp-interface simulation from Kaiser et al. (Reference Kaiser, Winter, Adami and Adams2020) compared with the same experiment by Igra & Takayama (Reference Igra and Takayama2001). Figures are taken with permission from Kaiser et al. (Reference Kaiser, Winter, Adami and Adams2020).

Appendix H. Comparison with experiments and simulations
A comparison is made between the present diffuse interface approach and SIM simulations from Ling et al. (Reference Ling and Mahmood2023) (VOF method) for a 2-D water column of diameter 1.9 mm at 1 atm pressure subject to breakup (We = 10.9). The surface tension coefficient is 0.072 N m−1 and gas density is 1.2 kg m−3, and the liquid density is 1000 kg m−3 exposed to a uniform flow with a velocity of 18.7 ms−1. Figure 26 shows the evolution of the droplet interface morphology from both studies. Although the VOF result is based on a full 3-D simulation while our study simulates a 2-D water column, the overall breakup mode, characterised by the flattening of the droplet in the streamwise direction and curvatures are in very good agreement. Both methods predict the same breakup shape and orientation relative to the flow direction, confirming that the dominant physical mechanisms are well captured regardless of the interface treatment (DIM vs SIM) at low Weber numbers. Some differences are, however, observed in the radial deformation due to the VOF results of Ling et al. (Reference Ling and Mahmood2023), performed in three dimensions, which show more lateral spreading because axisymmetric and planar assumptions in two dimensions inherently restrict transverse momentum transfer and vortex shedding, which in three dimensions contribute significantly to lateral rim growth. Nonetheless, the close agreement in the main breakup pathway shows the robustness of the DIM for capturing droplet deformation and interface dynamics in surface tension-dominated flows.
The second validation case considered in this study targets a higher flow speed and Weber number. A water cylinder with a diameter of 4.8 mm and a density of 1000 kg m−3 is surrounded by air with a density of 1.204 kg m−3 subject to a Mach 1.47 shock wave (Igra & Takayama Reference Igra and Takayama2001). The simulation employs the same governing equation ((2.1)–(2.4)). The conditions are set to the standard atmospheric temperature and pressure with a surface tension coefficient of 0.072 N/m as reported in the original paper. The mesh is configured with a resolution of 100 cells per droplet diameter and a calculated Weber number of ∼6900. As shown in figure 27(a), the numerical schlieren images (top half) obtained from the simulation qualitatively match the holographic images from the experiment. The time referenced in Igra & Takayama (Reference Igra and Takayama2001) has been adjusted to account for the initial distance between the shock and the droplet. In addition, figure 27(b) shows the conservative sharp-interface simulations of Kaiser et al. (Reference Kaiser, Winter, Adami and Adams2020) compared against the same experimental data. Both sharp-interface and diffuse interface approaches provide excellent agreement with experiment, validating the robustness of the surface tension treatments under shock-induced breakup.
In addition to the qualitative comparison above, upstream stagnation point drift, i.e.
 $x_{sp}^{*}\hspace{0pt}$
, and the normalised centre-of-mass drift, i.e.
 $x_{\textit{com}}^{*}\hspace{0pt}$
, are quantitatively compared between the sharp-interface, the diffuse interface numerical method and the experiment in figure 28. The upstream stagnation point drift (figure 28
a) shows very good agreement with the conservative sharp-interface results reported in Kaiser et al. (Reference Kaiser, Winter, Adami and Adams2020) and the experimental measurements (Igra & Takayama Reference Igra and Takayama2001). Similarly, the normalised centre-of-mass drift (figure 28
b) agrees well with the sharp-interface results of Kaiser et al. (Reference Kaiser, Winter, Adami and Adams2020). This consistency highlights that both SIMs and DIMs, when properly resolved, converge to the same physical displacement metrics observed experimentally.
Quantitative comparison of integral displacement metrics for shock–cylinder interaction. (a) Normalised upstream stagnation point drift
 $x_{sp}^{*}$
. (b) Normalised centre-of-mass drift
 $x_{\textit{com}}^{*}\hspace{0pt}$
. Present diffuse interface results are compared with the conservative sharp-interface simulations of Kaiser et al. (Reference Kaiser, Winter, Adami and Adams2020) and experimental data from Igra & Takayama (Reference Igra and Takayama2001).

In addition, we compared the behaviour of an n-dodecane droplet under transcritical conditions with the experiments of Crua et al. (Reference Crua, Julien and Lyle2017) in a nitrogen environment with a temperature of 1000 K and a pressure of 8.8 MPa, representing transcritical conditions in figure 29. Two simulation cases were set up for comparison: case (b) in figure 29(b) we consider the case of a convective crossflow over a droplet with a lower velocity of 0.48 ms−1, resulting in droplet deformation. This case employs a higher velocity compared with the experiments to facilitate a qualitative comparison of the droplet morphology at lower flow speeds. These experiments show the persistence of surface tension during droplet evolution for a significant portion of the droplet’s lifetime and the resulting droplet morphology aligns well with the experimental observations. There is a 0.1 ms time interval between each figure. In figure 29(c) we consider the case of a crossflow with a lower velocity of 0.48 ms−1, as described in Crua et al. (Reference Crua, Julien and Lyle2017). The discrepancies observed between the simulation and experiments is more likely due to uncertainties in measuring the flow speeds in experiments. This approach has also been used by Ly and Ihme (Reference Ly and Matthias2024), where higher inlet velocities than those measured in experiments were employed to ensure more consistent droplet morphology with the same experiment.
Qualitative comparison of n-dodecane droplet morphology for (a) the experiment from Crua et al. (Reference Crua, Julien and Lyle2017); simulation results with a convective flow speed of (b) 4 ms−1 and (c) 0.48 ms−1. The experimental results are taken with permission from Crua, Manin, & Pickett (Reference Crua, Julien and Lyle2017).