Chinese economic reforms and the attendant rise in the standard of living across population groups – plus the remarkable decline in poverty in rural areas – have garnered a great deal of attention. And yet, concomitantly, the cities have seen an unaccustomed spurt of penury.Footnote 1 The emergence of destitution in the municipalities after 1997Footnote 2 was clearly spawned by the simultaneous officially mandated “restructuring” of state-owned enterprises, as the country's leaders positioned their nation to catch up with, or, in their words “get on the track with,” the developed world.Footnote 3
The term “restructuring” amounts to a euphemism which refers to the disappearance of tens of millions of jobs in the urban areas; it also obscures that a not inconsiderable, but unknown, percentage of those who once filled those posts were rapidly thrown into sudden and intractable impoverishment.Footnote 4 Besides, along with the jobs went the end of the welfare benefits that had been attached to the posts, so the situation of these rejected persons was grim indeed. The central government has made several attempts to address this externality; the results of this effort, however, have varied among localities in their application of the programs.
This paper seeks to find regularity in this disparity of execution with respect to one of the new programmes, the one billed as the final resort in assisting the laid off, the other two being a Reemployment Project and unemployment insurance.Footnote 5 This third “line” of the three is a scheme of social assistance aimed at compensating particularly desperate municipal citizens. The target group is comprised of members of what the government calls the ruoshi qunti 弱势群体 (vulnerable groups), a negative product of China's effective adoption of capitalism; its members are for the most part low- or un-skilled, chronically ill or disabled.Footnote 6 The programme in question is called the Minimum Livelihood Guarantee (zuidi shenghuo baozhang 最低生活保障, colloquially, the dibao 低保; its target population are the dibaohu 低保户). It is administered at the municipal level and is provided only to permanent urban registrants within the given city. As with schemes of social assistance elsewhere, this is a form of social protection in which the benefit bestowed is means-tested, meagre, stigmatizing and offered as a last resort.Footnote 7 It supplies the poor with cash transfers and does not entail contributions, as its beneficiaries – who generally have no work nor any employer prepared to take responsibility for their fate – are totally unequipped to pay into it.Footnote 8
While the larger subject of social welfare has been much studied in the field of comparative politics, with only a few exceptions it has been analysed as executed in democratic states.Footnote 9 Scholars who treat welfare as a function of democratic politics describe politicians' rationale in dispensing it as based on their all-embracing concern with the electoral imperative. But in non-democracies, where elections are either empty charades or are non-existent, this motivation for assistance on the part of politicians is, obviously, absent.
As opposed to the democratic welfare state paradigm, two older pieces of work on welfare and poor relief – Frances Fox Piven and Richard Cloward's book, Regulating the Poor and Claus Offe's paper, “Advanced Capitalism and the Welfare State”Footnote 10 – consider assistance in the context of changes in the economy, not as a correlate of activities within the polity. That is, they pinpoint not voting but capitalism and its vicissitudes as the causal factor underlying the welfare relation between state rulers and the portion of the populace made needy by the forces of the market. Piven and Cloward see the two pivotal roles of poor relief in capitalist states (of whatever regime type) as maintaining civic order and regulating labour.
Though they do not specify the particular modalities, these authors note two governmental goals in officialdom's regulation of labour: The first is to “absorb and control enough of the unemployed to restore order” … “when mass unemployment leads to outbreaks of turmoil”Footnote 11 (or, in the case of China's dibao programme, this could refer to an effort to prevent an outbreak of disorder at such a juncture). The second objective concerns the time when the labour market expands again; at that point, relief is used, they claim – with the denigration and punitiveness it directs toward those “of no use as workers” (such as the aged, the disabled and the insane) – as a disincentive to discourage people readmitted into the labour market from “relax[ing] into beggary and pauperism.”Footnote 12 Both these studies understand the recipients of welfare as people who become obsolete, even worthless, when alterations in the nature of the demand for labour make their skills inadequate for a new phase of economic growth. Piven and Cloward's book links rises in the need for aid to times of foundational, historic dislocations in the economy, speaking of the “catastrophic changes” that appear in eras of rapid modernization, precisely like China's experience over the last 30 years.Footnote 13
Several features of the poor relief crafted by the provisioning pioneers that Piven and Cloward detail – demands for “good,” “moral” behaviour on the part of beneficiaries, along with surprise visits to their homes to confirm this; decisions to allocate only so much funding to families as to supplement their incomes up to a bare minimum livelihood; and a principle of “less eligibility,” decreeing that a welfare subject's portion must be lower than that of the most poorly paid labourerFootnote 14 – are also hallmarks of China's current dibao,Footnote 15 as they often are in social assistance elsewhere. But as we will see, in some, but not all, Chinese cities, this scheme operates in such a way that it limits the actions of the poor, frequently side-tracking indigent people out of the mainstream of urban citizenry and its economic activity (i.e. effectively working to regulate the labour market by keeping it free of undesirables). Indeed, this is a variable outcome: such results seem strongest where capitalism and cosmopolitan pretensions are most prominent, i.e. in the richer, but not in the poorer, cities. This distinction suggests a bifurcation of behaviours among Chinese urban officialdom that we explore below.
Another factor in the paradigm casting social assistance as a concomitant of capitalism is Offe's designation of welfare as a “safety valve,” for guarding against “potential social problems.” He points to a “benign neglect” informing welfare spending, which, he argues, is minimal, since such outlays target population segments whose appeals do not seem particularly worrisome to policy makers.Footnote 16 Thus, these writers suggest that not only electoral behaviour but also capitalism (an economic, but regime-type-neutral, factor) – with its unpredictable and potentially merciless markets in labour – can be a core mechanism driving state beneficence. This analysis makes sense for China, where votes mean little to nothing, but where using hand-outs to induce popular passivity, and where removing the unskilled from the labour market – and thereby enhancing productivity – can mean a lot.
Four features growing out of this line of reasoning – the use of relief subsidies to regulate the labour market (and, indirectly, enhance output); the concern with maintaining order, or, using Chinese catchwords, guaranteeing “social stability” and “harmony”; the targeting of anachronistic (useless) workers – mostly the old, the under-educated, and the disabled or otherwise infirm – as the appropriate recipients; and the token expenditures Footnote 17 -cum-“benign neglect” that mark such programmes – are all pertinent to our analysis. Some of these features are most strongly exemplified in the wealthier Chinese cities most influenced by the dynamics of capitalism, others in poorer places, we will demonstrate. This paper offers one explanation for these distinctions.
Subnational disparity in policy implementation, we assume, is at least in part a function of cities' fiscal health, as market opening has gone hand-in-glove with decentralization, while localities have grossly disparate resource bases and revenue streams.Footnote 18 And our data show what appears to be systematic variation marking the ways in which local leaders in well and in poorly endowed cities, respectively, dole out state charity among three specific types of poverty recipients. We do not claim a relationship of cause and effect between the economic health of a city and its dibao allocational decisions, but we do uncover a provocative correlation. Our results are consistent with a deduction that prosperous metropolises' welfare choices act to hide away these places' indigent, while less well-financed towns are prone to encourage their poor openly to contribute to their own sustenance.
Besides fieldwork observations and some 80 interviews with dibaohu, urban dibao administrators and community officials in six cities (Wuhan, Guangzhou and Lanzhou; and Jingzhou, Qianjiang and Xiantao, Hubei) over four summers (2007–10), we also used two datasets. Since the urban registered population living in the city district (shiqu市区) are the only people eligible for this relief in the cities, we used data only on this population. Dibao recipient data come from an unusual dataset compiled by the Ministry of Civil Affairs, available online,Footnote 19 that discloses how over 600 individual cities divide up their dibao funds among ten categories of welfare recipients (categories include the aged, women, the registered unemployed, those performing “flexible labour” linghuo jiuye 灵活 就业,Footnote 20 the working poor, students, the disabled); its table shows both the numbers of recipients in each category in each city and the total number of recipients of the dibao in each city, making it possible to calculate the percentages each category represents of the total recipients per city.
We consider three of these categories, each of which can be read to convey information about a city's stance toward people outside the mainstream economy: flexible workers, the disabled and the registered unemployed. At the time our research began, there was no later data than these for the end of June 2009; nor was there any earlier such data. The other dataset is from another source also available online, the China Infobank, which supplies basic economic indicators for a large number of Chinese cities. At the time of this research, data for year-end 2007 was the most recent and reliable such data available.Footnote 21 Having two datasets with information from time points 18 months apart (year-end 2007 and June 2009) is in a way fortuitous. The disparity in time affords a lag, such that the effects that one variable (city wealth, as measured by average wage in 2007) might have on policy toward various types of poverty-stricken people (i.e. officials' choices in 2009 about the allocation of dibao funds among three categories of recipients) had time to become manifest.Footnote 22
We first briefly sketch the programme in question, highlighting in italics the four elements drawn from the Piven/Cloward/Offe interpretation noted above, which, we argue, fit the management of the scheme quite well. We then draw upon fieldwork that led to a set of three hypotheses, and lay out these hypotheses. The methodology and results come next, followed by a discussion of our own and of alternative explanations, and our conclusions.
The Minimum Livelihood Guarantee Programme
Objectives and character of the scheme
As industrial restructuring progressed, it became clear that it was the anachronistic workers who bore the brunt of the process, as Piven and Cloward articulated would be the case. Thus, the coming of capitalism entailed a state-induced streamlining of the industrial economy in favour of the professionally and personally fit.Footnote 23 As protests by dismissed workers mounted,Footnote 24 the Chinese leadership agonized over the implications that current and potential disorder could have for the state's hallowed objectives of “social stability” and inter-group “harmony” and for a successful project of state enterprise reform-cum-economic modernization. In 1999, after a half dozen years of grass-roots experimentation with locally designed efforts at social assistance, and in the realization that earlier efforts to compensate laid-off workers, such as the Reemployment Project, had failed,Footnote 25 the central leadership inaugurated the Minimum Livelihood Guarantee scheme on a mandatory, nationwide basis, to replace the old urban work-unit-grounded, relatively universal security entitlements granted by the state firms in the municipalities of the socialist era.
The political elite's purpose in instituting this programme was explicitly stated as being to handle the people most severely affected by economic restructuring, in the hope of rendering them quiescent, that is, to maintain the order the leadership deemed essential for safely implementing the enterprise reform process. Thus, in late 1999, an official at the Ministry of Civil Affairs, the organ charged with administering the scheme, cited one of the dibao's goals as being to “guarantee that the economic system reform, especially the state enterprises' reform, could progress without incident (shunli jinbu 顺利进步)” [italics mine].Footnote 26
Getting rid of obsolescent and money-losing factories and firing all or most of their generally unskilled and physically weak employees thus amounted to regulating the labour market, as Piven and Cloward understand the term. Once the programme was underway, the Ministry of Civil Affairs enjoined the localities to “spend a little money (which could be interpreted – and, as turned out to be the case – as an injunction to use token expenditures) to buy stability.”Footnote 27 In short, the paired objectives of facilitating the firms' reform and, to guarantee this, minimal welfare security for the very poor, lay at the core of the programme's publicly enunciated, official justification, precisely as Piven and Cloward and Offe presumed for such programmes.Footnote 28
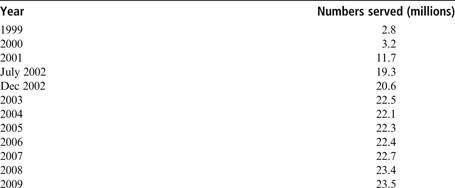
The paucity of the final outlay of funds was obvious from the start. In the first ten months of 1999, just 1.5 billion yuan was extended to the target population, at that time a mere 2.8 million individuals. For the next two years the plan's growth ran in parallel with the intensification of China's market reform (or, one might say, in keeping with the Piven/Cloward/Offe interpretation, its decisive swerve toward capitalism) and globalization, with an expansion in 2000 as the nation prepared to enter the World Trade Organization (WTO), and, accordingly, with the mounting numbers of moneyless urban unemployed. A final major upgrade of the programme came in mid-2002, just after China joined the WTO, when the number of participants was rapidly jacked up to 19.3 million, nearly doubling the beneficiaries in less than a year (see Table 1). But this figure has been increased only a little since then (up to about 23.3 million as of mid-2009), perhaps in light of an absence of disorderly mass protests from the participants in recent years.
Numbers Served by Urban Dibao, 1999–2009

Sources:
For 1999, see Tang Reference Tang2002, 15–16; for 2000, ibid., 18; for 2001 and 2002 (July), Hong Reference Hong2002, 9–10; for 2006 (Oct.), “2006 nian 10 yuefen quanguo xian yishang dibao qingkuang” (National dibao situation for county and above, October 2006), Ministry of Civil Affairs website, http://www.mca.gov.cn/news/content/public/20061120150856.htm, accessed 17 August 2007; for 2007, “National urban and rural residents, the minimum livelihood guarantee system for equal coverage,” http://64.233.179.104/translate_c?hl=en&sl=zh-CN&u=http//jys.ndrc.gov.cn/xinxi/t20080…, accessed 18 March 2008. For 2002, 2003, 2004, 2005, 2006 (end of year), China Statistical Yearbook 2007, 899.
For 2008: dibao figures from Ministry of Civil Affairs website, http://cws.mca.gov.cn/article/tjsj/dbsj/index.shtml/1.
For 2009: dibao figures from “2009 nian chengshi jumin zuidi shenghuo baozhang renshu da 2347 wan ren” (“Urban minimum livelihood guarantee recipients reach 23.47 million in 2009”), 28 January 2010, www.china.com.cn/news/txt/2010-01/28/content_19323559.htm.
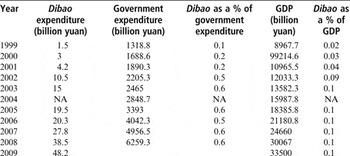
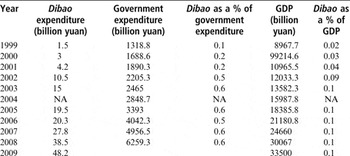
In line with the programme's growth in recipients, the augmentation over time in state expenditures also accompanied the intensification of China's marketization. Whereas expenditures had climbed to only three billion yuan nationwide by the end of 2000, they had shot up to 48.2 billion by 2009 (see Table 2). Still, despite steady increases in the total funding granted to the program, its overall expenditures, as Offe would argue, were kept at a token level relative to other official outlays, ranging from 0.113 per cent of total government expenditures in 1999 up to 0.688 per cent at the peak, in 2003, and down to 0.615 per cent in 2008 (and even lower between 2003 and 2008). And, as government expenditures overall grew at a rate of 25.7 per cent from 2007 to 2008,Footnote 29 the proportion of them that went to the dibao rose by just 9.6 per cent.
Dibao as a percentage of government expenditure and as a percentage of GDP, 1999–2009
Sources:
For the dibao, 1999–2006, the figures are either taken from or estimated from these sources: Tang Reference Tang2002; Tang Reference Tang, Xin, Xueyi and Peilin2004; Tang Reference Tang, Xin, Xueyi and Peilin2006.
For government expenditures, 1999–2006, China Statistical Yearbook 2007, 279.
For GDP (1999–2006), ibid 57.
For 2007, Wen Jiabao Reference Wen2008; and Ministry of Finance 2008.
For 2008, for dibao expenditure: Ministry of Civil Affairs website, http://cws.mca.gov.cn/article/tjsj/dbs/index.shtml/1; for expenditures and GDP: China Statistical Yearbook 2009, China Data Online.
For 2009: Dibao expenditure (at all levels) from Ministry of Civil Affairs website, accessed 14 August 2010; for government expenditure and GDP: China Statistical Yearbook 2010, China Data Online.
As for the money used for the dibao as a percentage of GDP, this ranged from 0.016 per cent in 1999 up to just 0.1439 per cent in 2009. By way of comparison, a set of emerging economies in Latin America spent from 0.5 to one per cent of GDP on targeted anti-poverty programmes. In post-socialist countries in Eastern Europe, there was also relative generosity for the victims of reform, as, for instance in Romania, where a minimum-income scheme cost nearly 0.5 per cent of GDP.Footnote 30
There is other evidence of frugal funding: while the local dibao standard (or, alternately, the local poverty line) on average represented 20.5 per cent of the average local annual wage for staff and workers across a set of provincial capitals and other super-large cities in 1998, nine years later, in 2007, the norm had dropped down to just 10.3 per cent of the mean wage. In these same cities, the dibao norm accounted for 28.2 per cent of average disposable income in mid-2002. But by the end of 2007 the norm had fallen to only 19.6 per cent of average disposable income (to save space here, tables showing this data are available from the author). These data demonstrate that the miserly portion allotted to the poor across the nation could be claimed to coincide with the notion of “benign neglect” articulated by Claus Offe.
The design of the programme: setting the urban poverty line
Though there are often reports of China's poverty line, this applies only to the rural areas. There is no national urban poverty line in China. The dibao norm or standard (biaozhun, 标准), a municipally designated version of this line, varies across cities. The mission of the dibao is to subsidize households whose average per capita income falls below the amount necessary for purchasing basic necessities at the prices prevailing in a given place. Letting localities peg their own lines was done because the average per capita income varies regionally; another consideration, initially, was that each city was to supply a large portion of the outlay.Footnote 31 Later, the central government recognized that the poorest cities were unable to afford the requisite amounts and subsidized these places.Footnote 32 By 2003 the proportion of subsidies from the centre varied from as low as 16 per cent in Fujian along the wealthy East coast to more than 70 per cent in the destitute western provinces of Gansu and Guizhou. While some cities were contributing next to nothing, the seven wealthiest metropolises and provinces have been charged with financing the programme entirely by themselves.Footnote 33 Interviews in prefectural cities in Hubei in 2010 revealed central subsidies to them for the dibao of close to 100 per cent.Footnote 34
The local dibao line was to be fixed below the minimum wage in each city, as it normally is where social assistance is provided (just as was dictated by the old principle of “less eligibility” mentioned above), and also lower than the amount dispensed in unemployment insurance benefits, supposedly – again, as elsewhere in the world – in order to encourage employment. In truth, however, in many, but not all, cities, local policy states that acquisition of even a tiny increment in income through occasional labour can result in a drastic reduction in the household's dibao disbursement, effectively discouraging recipients from engaging in informal labour.Footnote 35
Fieldwork Observations: The Basis for the Hypotheses
Visits to two very different cities in 2007 initially drew attention to the variability with which different urban financial endowments appeared to colour the approach of local officials to the very poor. One of these cities, Wuhan, the vibrant capital of Hubei province in central China and relatively well-off, aspires to cosmopolitanism; the other, Lanzhou, the capital city of north-western Gansu province, situated in a barren and rocky part of the country in one of China's most poverty-stricken provinces, is far less geared to appearing modern. Inspection of these two cities suggested the possibility that systematic variation in welfare governance might mark wealthier and more indigent cities, respectively.
The respective statistical data for these two locales convey the story crisply: as of 2007, Wuhan registered an urban population of 5.29 million, and a GDP of 270.9 billion yuan. Dibao recipients constituted 4.6 per cent of the city population, and expenditures on it amounted to 338.1 million yuan, 1.25 per cent of government expenditures (27.15 billion yuan) and an average of 114 yuan per person per month. In Lanzhou that year, the city population amounted to 2,080,344, a bit below 40 per cent of Wuhan's. The dibao population, of 111,758, however, accounted for a slightly higher portion, 5.37 per cent of total residents, while the city's GDP, 63.43 billion yuan, was less than a quarter of Wuhan's.
In Lanzhou, though, where the central government subsidized dibao expenditures, these expenses amounted to 147.7 million yuan of total government spending of 6.82 billion yuan, nearly twice as high a percentage as Wuhan's, at 2.16 per cent of its expenditures; hand-outs of 105 yuan per person per month were the average, outlays made possible by the subsidization. In 2007, while the average monthly wage among the 63 cities in our sample was 2,113 yuan per month, in Wuhan the figure was above that, at 2,239 yuan, but in Lanzhou, it was below, at 1,768 yuan.
It was apparent during fieldwork in 2007 that the two were adopting very different tactics in managing their poor; this became clear in observing residents' commercial activities (or lack thereof) on city streets. Earlier research revealed that the two cities have had dissimilar approaches since the inception of the programme: a 1998–99 survey disclosed that Lanzhou's leaders were executing a “mobilizational” strategy toward the indigent, with officials there “emphasiz[ing] arousing the dibao targets' activism for production, encouraging and organizing them to develop self-reliance.”Footnote 36
Nine years later, in 2007, Lanzhou remained lenient toward its poverty-stricken, allowing them to engage in sidewalk (or “flexible”) business – the manner of handling of which is determined by each city on its own, and which, in turn, is policed in each by its urban order and appearance managers (the chengguan 城 官). All kinds of curbside business went on unobstructed, including stalls for fixing footwear and small bunches of young men hawking political picture posters.Footnote 37 That this was a matter of city policy was confirmed in a late summer 2007 interview with the section chief of the Gansu provincial dibao office under the province's civil affairs bureau, who admitted that,
If the chengguan, is too strict, the dibaohu cannot earn money. And letting them earn money is a way of cutting down their numbers. If their skill level is low, their only means of livelihood can be the street-side stalls they set up themselves.Footnote 38
His words reveal not just a relaxed position toward the indigents' street behaviour, but also the budgetary shortages that dispose urban authorities in Lanzhou to seek out ways of saving funds.
In Wuhan, by contrast, informal business on the streets is illegal. There, beautiful, unencumbered thoroughfares are valued to match the towering, modernistic skyscrapers continuously under construction on all sides of the streets. A decade ago, in 2001, when the city was newly stretching toward the future, a laid-off cadre from a local factory pronounced in a private conversation:
Society has to go forward, we need money to create a civilized environment, sanitation to develop a good environment, a clean shopping area, basic construction facilities necessary to build a better livelihood for people in the future. All cities have pedestrian malls or are building them. They can give Wuhan more competitive ability, for business and tourism. People will come here. We've also built a beach along Yanjiang Road and it did attract tourists here during the National Day vacation.Footnote 39
Further evidence of this proclivity for pristine roadways and for attracting outsiders were the actions of the politician Yu Zhengsheng, appointed Party Secretary of Hubei province at the end of 2001, who advocated developing Wuhan by encouraging much building of infrastructure. “I guess he wanted to make the city look better, so doing small business on the streets was not something he wanted to see,” related a Chinese scholar in conversation with one of the authors.Footnote 40 During Yu's reign, a talented but hard-up woman in Wuhan complained that the fees for exhibiting her artwork on the streets had escalated substantially over time, eventually forcing her to abandon any effort to try to make sales.Footnote 41 In the same vein, a recent foreign investigator in the city commented that, “Wuhan is working hard to catch up with the infrastructure and living standards of wealthier coastal cities. In 2000 there were 350,000 vehicles on Wuhan's roads; this year [2009] that number will approach one million.”Footnote 42
The viewpoint in Wuhan, it would appear, jibes with what has been labelled the “spatial imaginary of modernity.”Footnote 43 This vision has informed the aspirations of Chinese officials in richer and up-and-coming cities for an au courant urban landscape and for governing a class of people they judge appropriate to such locales. Combined with a fixation on the “quality” (suzhi 素质) of the populace, they appear to take the modernization of their town to be dependent upon the fostering in it of “superior” individuals, with economic development seen as being contingent upon the calibre of the workforce.Footnote 44
Where this bias exists, in municipalities bent on becoming showcases to the outside world, it seems to operate to marginalize and exclude “anachronistic” individuals, whose abilities and qualifications would prevent them from performing the complex tasks called for in a state-of-the-art economy, as we will argue.
Hypotheses
The contrasts between Wuhan and Lanzhou resonated with Piven/Cloward/Offe's description of social welfare as being about the management of anachronistic workers; regulation of the labour market; and maintenance of order, especially by means of fostering clear streets, all of which appeared to vary in two cities having quite differing levels of resources. We wish to uncover the extent to which this variation holds across a larger number of cities. Given that cities are charged with setting their own poverty lines, that their level of resources varies substantially, and that wealthier and upwardly mobile cities – having the capacity to do so – are, we reason, more apt to be oriented toward presenting their cities to outsiders as modern spectacles, we drew on our fieldwork to hypothesize that:
H1: The wealthier the city, the more inclined its officials will be to use their dibao funds for disabled people, i.e. to have such persons as a relatively high percentage of their total dibao recipients. This they do in the hope of maintaining an unsullied urban scene by giving these people stipends and so keeping them off the streets.
Using the terminology of Piven/Cloward/Offe, disabled people are what city officials in wealthier cities would consider anachronistic workers, both publicly unsightly and unable to be placed within a modernizing economy. Indeed, while wealthier places shut down money-losing, special factories for the disabled in the late 1990s, officials in smaller, less prosperous towns related that the chengguan there was lenient and that its officials refrained from chasing such people from the avenues.Footnote 45 Poorer cities, not so conscious of their appearance and possibly hoping to save their dibao allocation for other uses, allow the disabled to make their own livelihood, if possible. Thus, administrators in poor cities have comparatively lower percentages of the disabled among their dibao recipients. That there are variations in these respects is obvious when we find, for example, that while the disabled accounted for 10 per cent of the dibao recipients in 63 cities across China on average in 2009, the range was between 1.3 per cent in Yunnan's Baoshan and Shaanxi's Shangluo (both comparatively poor prefectural cities), but as high as 32 per cent in the modernized tourist super-city Hangzhou.
H2: The richer the city, the more prone its decision-makers will be to extend the dibao to registered unemployed workers.
This relationship could occur because wealthier cities have more sophisticated, technologically oriented economies.Footnote 46 Thus, registered unemployed workers are very likely to be people lacking the skills and educational background necessary for participating in the new capital-and knowledge-intensive industries of 21st-century, modern China. Receipt of the dibao could encourage them not to look for work in the formal economy, where, indeed, they are not apt to find employment in any case. Thus, a wealthier city could be enticing laid-off labourers to leave – and not attempt to re-enter – the labour market, by offering them the dibao funds they need to maintain their minimum livelihood.
Poorer cities' economies, on the other hand, being less advanced, are also more able to absorb the unskilled registered unemployed. Consequently, we expect to find a correlation between the poverty of a city and a lower percentage of registered unemployed obtaining the dibao among the programme's total dibao beneficiaries in that city. Again, the range for the per cent of registered unemployed recipients among our sample cities is wide, averaging 19 per cent of all recipients across cities; it goes as high as 40 per cent in Wuhan and Qingdao, both well-off, modernized cities, but is in the single digits in smaller, poorer cities.
H3: In wealthier cities, people engaged in flexible labour will account for only a small percentage of the city's dibao recipients.
This relationship is suggested because people doing flexible labour often do so out on the open roadways, damaging the appearance of the city in the eyes of their urban governors in wealthy cities; thus the chengguan sweeps them away, resulting in fewer flexible labourers in rich cities. In poorer cities, on the other hand, where the chengguan is more charitable, flexible labour is much more tolerated. In richer municipalities, then, those engaged in such work will not be given dibao funds (or their funds tend to be reduced by the amount of wages they earn – or by what the dibao administrators imagine they earn – in informal work) reducing the chance that they will seek a livelihood on the streets.
Based on the Lanzhou official's words, and also the remarks of administrators in two smaller Hubei cities in July 2010, contrariwise, poorer urban areas are more prone to let the poor earn money on the sidewalks. For one thing, by permitting this activity, the city can save dibao funds for the municipal budget. Officials in poor places are, additionally, less likely able to appeal to outsiders (whether for attracting their visits or their capital), and so are less anxious about their municipal visage. Thus, both to conserve funds and also from less investment in their own image (given their lesser ability to simulate modernity), poor cities should be likely to let flexible workers make money outside, and to not discourage them from doing so by reducing their hand-outs.
Interviews in Wuhan and Guangzhou suggest that wealthy cities, on the other hand, actively discourage informal, or “flexible,” employment (linghuo jiuye 灵活就业).Footnote 47 They do this by deducting income derived from “flexible” employment from the benefits target households would otherwise receive.Footnote 48 This practice of decreasing the assistance subsidy of people with casual jobs can amount to a disincentive against accepting paid work, work that is typically onerous and unpleasant, and which also promises a less reliable payment than does the dibao.Footnote 49 Flexible labourers, on average across the sample cities, constitute 16 per cent of total recipients, but the percentage goes as low as 1.7 per cent in Shanghai and as high as 33 per cent in the far smaller and poorer western city of Guyuan.
These hypotheses amount to correlations, and are grounded in the notion that treatment of the poor is fundamentally different, and follows distinctly dissimilar logics, in cities at varying levels of wealth. At base, the hypotheses pit the urge to present a cosmopolitan perspective in prosperous municipalities against a focus upon saving revenue in poorer cities.
Statistical Analysis
Data
We used the China Infobank data for the average wage in the cities in our sample, which we took as a proxy for the wealth of a given city. We chose this proxy rather than GDP per capita, a figure often resorted to in economic research comparing Chinese cities, because it is not comparable among cities. Even though average wage is not a perfect measure of a city's wealth or resources, we believe it is a reasonable indicator. Clearly a city housing firms that can afford to pay higher wages must also be a place with higher tax income and thus more revenue. Many Chinese “cities” now contain large stretches of rural areas and rural-registered population. Given wide rural–urban disparities in income, this renders many city per capita indicators not reflective of the true city situation. The value of such indicators, instead, is simply a function of the proportion of the “ruralness” in any given city's “urban” districts.Footnote 50
Besides, most cities report their total GDP, (that of the “whole city” [quanshi 全市]), which definitely includes the output of rural residents who are not counted as part of the “city's” population. But then cities count only the urban-registered as members of their populations, neglecting rural migrants who may have resided in the city over long periods of time but who lack urban registration, and whose numbers in some cases amount to as much as a third of the city's formal, official urban population. Such variable counting practices skew the results differentially in different municipalities.
Our statistical data covers 63 cities. Of these, 36 are “super-large” cities, and include all 31 provincial capitals and several other cities having populations above two million. These 36 cities are those typically used in research on the urban dibao.Footnote 51 We randomly selected an additional 24 municipalities, all prefectural-level cities belonging to a set called “large” cities.Footnote 52 We chose these 24 cities by randomly selecting from each province one such city for which the requisite data were available, and which also had populations between half a million and a million people as of 2007.Footnote 53 We added these “large” cities to investigate the variation that size might introduce, especially given that all prior dibao research has been carried out only on the super-large cities, to the best of our knowledge. “Large” cities are especially important to study in work on the dibao program, since 85 per cent of the scheme's targets live in these cities or in even smaller ones.Footnote 54
Variables
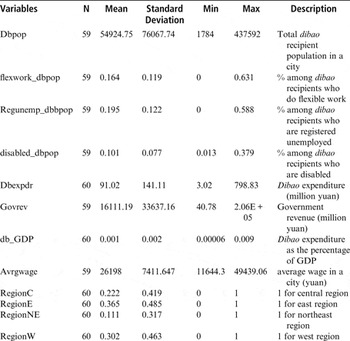
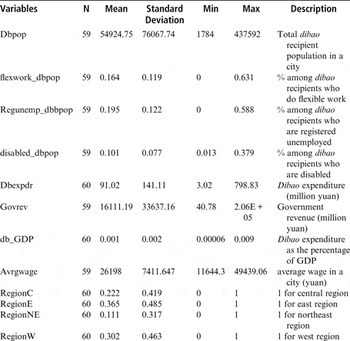
Table 3 lists all variables and their descriptions. Besides average wage, three other variables match our three hypotheses: disabled workers as a percentage of total dibao recipients; registered unemployed workers as a percentage of total dibao recipients; and flexible labourers as a percentage of total dibao recipients. Dibao expenditure as a percentage of city GDP is included to control for a city government's generosity; it strongly and significantly correlates negatively with average wage. This finding suggests either that poorer cities have more poor people and therefore are compelled to spend more on the dibao or that poor cities get a large injection of funds from the central government for their dibao payments. Most likely, both are true.
Index of Variables and Cities
Methodology
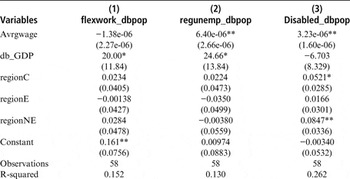
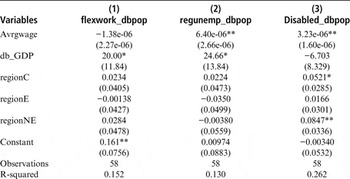
Ordinary Least Squares regression is used to show the variable correlations between average wage and the three other variables. One model is used for each of the variables in our three hypotheses: Model 1 is for the variable number of flexible workers who are dibao recipients as a percentage of total dibao recipients in a city; model 2 is for the variable number of registered unemployed dibao recipients as a percentage of total dibao recipients in a city; and model 3 is for the variable number of disabled dibao recipients in a city as a percentage of total recipients (see Table 4).
Regression Models: Explaining Different Percentages of Dibao given to Flexible Workers, Registered Unemployed, and the Disabled
Standard errors in parentheses
***p < 0.01, **p < 0.05, *p < 0.1
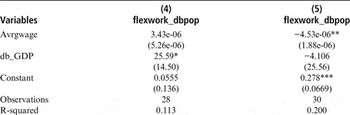
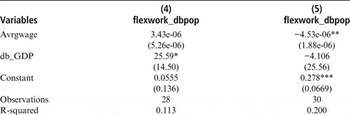
In models 4 and 5 (see Table 5), the percentage of flexible labour dibao recipients is regressed on government revenue in two groups: model 4 uses as its group cities with lower than median government revenue. Model 5 analyses the group of cities with higher than median government revenue. We split cities into two groups because poorer cities receive much of their dibao funding as an earmarked allocation from the central government, while richer cities pay for the dibao either entirely or mostly from their municipal revenues. The different sources of funding may cause cities to have different giving patterns. It should be noted here that, despite poorer cities receiving most or all of their funding from upper levels of government, all urban officials interviewed uniformly claimed that there were no quotas or targets dictating limits to the numbers of needy people who could be subsidized, and neither were there specific reporting obligations to their superiors. It did appear in interviews that each city made its own decisions about whom to fund.Footnote 55
Regression of Flexible Worker Recipients' Percentage on Average Wage, in Two Different Groups
Standard errors in parentheses
***p < 0.01, **p < 0.05, *p < 0.1
Notes:
The 28 cities in model (4) are those with government revenue below the median of government revenue (4836,8 million yuan). The 30 cities in model (5) are those with government revenue above the median.
Results
We regressed flexible labourers as a percentage of total dibao recipients on average wage, after data are put into two groups according to the median amount of government revenue in a city. The regression shows that in low-average wage cities, there is no relationship between the percentage of flexible worker dibao recipients and average wage. But there is a strong negative relationship between high average wage and the percentage of flexible worker dibao recipients in richer cities. In other words, flexible workers represent a comparatively smaller percentage of all dibao recipients in cities with a higher average wage (i.e. in the richer cities), but this percentage has no relationship with average wage in poorer cities. Models 4 and 5 support the correlation proposed in Hypothesis 3.
Hypothesis 1 is buttressed by model 3 in table 4: the wealthier the city, the more likely that a larger percentage of the city's dibao recipients are disabled people (in our reasoning, to keep them off the streets). Hypothesis 2 is consistent with model 2 in Table 4: the richer the city, the more prone its decision-makers are to extend the dibao to registered unemployed workers, since, in our interpretation, these workers cannot easily be placed in the city's formal economy.
Governments whose dibao spending is a higher percentage of GDP (that is, poorer cities) are more likely to give dibao funding to flexible labourers (model 1), and to the registered unemployed (model 2). We believe this may indicate that these cities do not want to inhibit informal labour, and so do not provide a disincentive against working on the streets by withdrawing the dibao (or a large proportion of it) when a person is doing irregular labour. There is no confirmation of the hypothesis that these governments are less likely to give money to the disabled. Model 3, however, does show that the western region, the poorest in the country,Footnote 56 is generally less likely to give the dibao to the disabled than are other regions (especially the northeast and the central regions).
Discussion of the Data; Alternative Explanations
The statistical findings provide suggestive correlations between level of wealth/poverty in a city, on one side, and cities' variable treatment of three categories of welfare recipients, on the other. Returning to Piven and Cloward and Offe, we find that several of the features of social assistance they identify can be seen as characterizing the operation of the dibao programme in both the richer and the poorer cities. Thus, one can read the data as showing that – as central-level politicians promised in the late 1990s – the dibao has been used in a way consistent with preserving order (by compensating losers in the state's modernization project), and that decision-makers at the urban level do allocate only token expenditures to the project; the program also appears to embody a subtext of benign neglect.
The findings also enable us to offer some conjectures about its differential implementation in 63 sample cities, some of which are prosperous and others relatively penurious. For the ways in which local administrators disburse their dibao funds seem to differ in a patterned way among the cities of China. Most crucially, as 2007 interviews and observations in two cities signified, officials in richer cities seem to set urban management priorities that dictate distributing social assistance funds diametrically differently from how the authorities in poorer locales do: that is, officers in wealthier municipalities are more prone to finance anachronistic workers (represented in our data by the disabled), care more about regulating the (formal) labour market (by paying the registered unemployed to stay out of it), and insist more on the order signalled to outsiders by cleared, clean streets (by discouraging flexible labour from doing business on them) than do those in the less well-off places.
Alternative Explanations
It is possible that the total numbers of each dibao recipient category in each city's population might affect the percentage each category represents among total dibao recipients in that city. Unfortunately, we were unable to locate data indicating the numbers that these categories of poor people represent in the general population for our entire sample of 63 cities. For instance, for numbers of disabled in the cities, there are certainly no data that we know of. It could be that poorer cities, presumably having more problems of untreated environmental pollution, would have more disabled people. But it could also be that wealthier cities, where manufacturing has been rapid and extensive, could have more industrial accidents, or also more pollution. Without any way to collect the necessary data, we are forced to posit a random distribution of these population categories, even though the truth may be otherwise.
It is also possible that there is simply more “flexible labour” in poorer cities, for whatever reason. But if that is the case, that would be consistent with our explanation, because it would mean that such municipalities permit and encourage this type of work. Even if that were true, however, this would still distinguish between cities with more and less wealth and would help to explain why flexible workers constitute a larger proportion of the dibao recipients in poor than in rich cities.
Finally, it could be that there are simply more registered unemployed people in rich than in poor cities. That is, these peoples' numbers could be higher in wealthier places simply because there are more still-extant firms in these richer cities who had been able to pay into the unemployment insurance fund for their dismissed workers while they were still employed (such payments are a necessary condition for anyone to receive unemployment insurance, and so to register as unemployed). Nonetheless, giving the dibao to these people would just the same represent a choice by city governments to placate these people (i.e. to preserve order), and would also serve as an acknowledgment that there are no spots for them in the regular economy.
Conclusions
Our findings suggest that in China, where profits, modernization and foreign investment have become significant to leaders at all levels, there may be a logic undergirding welfare allocation that grows out of an economic, not a political calculus. Our work seems to demonstrate that, where lower echelons of administration have authority to make rules about welfare rationing, urban finances appear to correlate with such allocational decisions. This seems to be the case in poor places, where officials attempt to save on funds; it also seems so in wealthier municipalities, where it is well known and easily observable that authorities design their urban areas as showcases, in the hope of attracting outside tourism and foreign investment.
For in well-off cities a relatively lower percentage of all dibao recipients are people known to be engaged in “flexible labour” as compared with in poorer cities. Preferring clearer sidewalks, welfare distributors in such cities deduct dibao funds from impoverished people who try to make their own money, we argue, in the interest of keeping such people out of the public eye and safely at home. At the same time, a relatively higher proportion of people with disabilities, and also comparatively more people who are registered as unemployed, receive assistance in wealthier municipalities than in poorer municipalities. The explanation we offer is that officials in the richer cities are more likely to want those they view as unsightly or as incompetent workers to stay out of view and away from the regular labour market. Consequently, our story goes, authorities offer these people official sustenance by means of the dibao. We cannot prove these connections definitively. But at the very least, our findings do, in fact, fit remarks made by welfare officials in two cities, one wealthier and one poorer.
We suggest that these findings – whether or not they represent causal connections, and regardless of whether they result from conscious intentionality on the part of city officialdom – are in accord with the known preferences of urban administrators in wealthier locales for achieving a modern appearance in their cities and for fostering technological sophistication in their economies. And it could certainly be that, in the views of the administrators of such cities, to become effectively modern and sufficiently attractive to foreign investors and tourists, the city must keep disciplined, out of the workforce, and even out of sight both the new underdogs to which marketization has given birth, and also people with a visible infirmity. These people, thus, are encouraged to stay at home by being offered the dibao, according to our reasoning.
In poorer places, on the other hand, where funds are scarcer and where pretensions to grandeur weaker, our three categories of recipients are treated in the opposite way from how they are handled in well-off sites. Both the disabled and flexible workers are allowed on the streets without their dibao allocation being diminished, as their fending for themselves is viewed as saving funds for the city budget. And administrators seem not to worry about an embarrassing urban appearance, for outside visitors are relatively rare and foreign investment is unlikely in any event. Thus, a smaller percentage of all recipients are disabled people in these environments. And a relatively higher percentage of beneficiaries are informal workers, as compared with in the wealthier cities, because, we propose, officials in poor places prefer to conserve their city's dibao funds for other uses, and do not object to the sight of people earning money informally on the city's roads.
The registered unemployed, on the other hand, represent a lower proportion of the dibao beneficiaries in less well-off municipalities than they do in the wealthier locales. This could be the case because the economies in such places – less advanced and less technologically driven, and also less foreign-invested – are more likely to have spots for them, even as local officials are less disposed than are the ones in rich cities to keep these people at home and out of work. The upshot is that laid-off workers are considered suitable for regular employment and so are less apt to constitute a large proportion of the dibao recipients in cities that are more strapped for funds.
In sum, our research suggests that an influential formulation stating that welfare giving is geared toward catering to voters is purely regime-specific. In an authoritarian regime undergoing capitalist-style development, modernization and globalization, we submit, the logics of governance and of social policy are likely to be driven by quite a different line of reasoning, one in line with writings from 40 years ago that instead emphasizes an economic rationale for poor relief.