I. INTRODUCTION
Titanium dioxide (TiO2) has been widely used as a pigment,Reference Pfaff and Reynders1 and as a component in sunscreens,Reference Salvador, Pascual-Marti, Adell, Requeni and March2, Reference Zallen and Moret3 paints,Reference Pfaff and Reynders1, Reference Braun, Baidins and Marganski4 toothpaste,Reference Yuan, Chen and Hu5 etc., since the start of its first commercial production in the early 20th century. In 1972, Fujishima and HondaReference Fujishima and Honda6 discovered the phenomenon of photocatalytic splitting of water on a TiO2 electrode under ultraviolet (UV) light. The recent significant efforts in TiO2 materials research have led to many promising applications in areas ranging from photocatalysis to photovoltaics.Reference Oregan and Gratzel7–Reference Fujishima, Rao and Tryk9 In the past several decades, great progress has been made in the synthesis, properties, modifications, and applications of TiO2 nanomaterials.Reference Chen and Mao10 TiO2 nanomaterials have been fabricated with a variety sizes and morphologies such as nanoparticles,Reference Chen and Mao10, Reference Trentler, Denler, Bertone, Agrawal and Colvin11 nanorods,Reference Chen and Mao10 nanowires,Reference Chen and Mao10 and nanotubesReference Chen and Mao10 by different synthetic methods including sol,Reference Trentler, Denler, Bertone, Agrawal and Colvin11 sol–gel,Reference Bessekhouad, Robert and Weber12 micelle and inversed micelle,Reference Kim, Kim and Kim13 hydrothermal,Reference Yang, Mei and Ferreira14 solvothemal,Reference Kim, Moon, Park, Chung and Son15 direct oxidation,Reference Wu16 chemical vapor deposition,Reference Seifried, Winterer and Hahn17 physical vapor deposition,Reference Xiang, Zhang, Wang, Luo, Zhu, Zhang and Yu18 electrodeposition,Reference Lei, Zhang and Fan19 sonochemical,Reference Huang, Tang, Wang, Koltypin and Gedanken20 and microwave-assisted methods.Reference Yamamoto, Wada, Yin, Sakata, Mori and Yanagida21 Among the many synthetic methods, sol–gel approach is one of the most commonly used ones. In a typical sol–gel process, a colloidal suspension is formed from the hydrolysis and polymerization reactions of the precursors, which are usually inorganic metal salts or metal organic compounds such as metal alkoxides. Complete polymerization and loss of solvent lead to the transition from the liquid sol into a sol–gel phase.Reference Chen and Mao10
TiO2 nanomaterials have been synthesized with the sol–gel method from hydrolysis of a titanium precursor.Reference Bessekhouad, Robert and Weber12, Reference Oskam, Nellore, Penn and Searson22 This process normally proceeds via an acid-catalyzed hydrolysis step of titanium (IV) alkoxide followed by condensation. The development of Ti–O–Ti chains is favored with low content of water, low hydrolysis rates, and excess titanium alkoxide in the reaction mixture.Reference Oskam, Nellore, Penn and Searson22 Three-dimensional (3D) polymeric skeletons with close packing result from the development of Ti–O–Ti chains. The formation of Ti(OH)4 is favored with high hydrolysis rates for a medium amount of water. The presence of a large quantity of Ti–OH and insufficient development of 3D polymeric skeletons lead to loosely packed first-order particles. Polymeric Ti–O–Ti chains are developed in the presence of a large excess of water. Closely packed first-order particles are yielded via a three-dimensionally developed gel skeleton. Secondary particles are formed by epitaxial self-assembly of primary particles at longer times and higher temperatures, and the number of primary particles per secondary particle increases with time.Reference Oskam, Nellore, Penn and Searson22
Here, we investigated TiO2 nanomaterials synthesized by hydrolysis of titanium (IV) isopropoxide (TTIP) in a high-boiling temperature alkali organic solvent: ethylene glycol (197.3 °C). The physicochemical properties of the TiO2 nanomaterials were investigated with various techniques and their photocatalytic performances were also studied. Specifically, their structural, optical, and photocatalytic properties were studied with powder x-ray diffraction (PXRD), Raman spectroscopy, transmission electron microscopy (TEM), differential scanning calorimetry (DSC), Fourier-transformed infrared spectroscopy (FTIR), x-ray and ultraviolet photoemission spectroscopy (XPS and UPS), UV–vis diffusive reflectance, and photocatalytic decomposition of methylene blue.
II. EXPERIMENTAL METHODS
The TiO2 nanomaterials were prepared as follows. First, a pH = 12 NaOH solution was prepared by dissolving 0.04 g NaOH (Thermo Fisher Scientific, Waltham, MA, 97.8%) in 100 mL deionized (DI) water. 50.0 mL ethylene glycol (Sigma-Aldrich, St. Louis, MO, 99%) was added into a 200 mL glass bottle. 0.50 mL pH = 12 NaOH solution was added into to tune the pH to 10. This solution was stirred for 10 min, and then, 1.0 mL TTIP (Sigma-Aldrich, >97%) was added dropwisely. This resulting solution was stirred for 20 min to get a clear solution. The glass bottle was then sealed and put in a preheated 90 °C oven for 24 h. After the glass bottle was cooled to room temperature, a white gel was formed. Water was added in to dilute the gel and the gel was filtered to obtain a white milky sample. This sample was washed with plenty of water to remove any residue NaOH and then dried in an oven at 90 °C for 24 h. A slightly yellow solid was obtained, which was then ground to a fine powder. The powder was then calcined in air at 200, 400, and 550 °C to remove the organic compounds and improve the crystallinity.
The structural character of the samples was investigated with PXRD, Raman spectroscopy, and TEM. The PXRD was performed using a Rigaku Miniflex PXRD machine (Rigaku Americas, The Woodlands, TX) with Cu Kα as the x-ray sources (wave length = 1.5418 Å) and the 2θ range was from 15° to 85° with a step width of 0.08 and count time of 3 s/step. The Raman spectra were collected on an EZRaman-N benchtop Raman spectrometer (Enwave Optronics, Inc., Irvine, CA). The Raman spectrometer is equipped with a 300 mW diode laser and the excitation wave length is 785 nm. The spectrum range was from 100 to 3100 cm−1. The spectrum collection time was 4 s and was averaged over three measurements to improve the signal-to-noise ratio. The TEM study was performed on a FEI Tecnai F20 TEM (Hillsboro, OR). The electron accelerating voltage was at 200 kV. Small amount of sample was first dispersed in water by sonication. One drop of the aqueous suspension was then dropped onto a thin holey carbon film. The girds were then transferred to an over kept at 60 °C and dried for overnight before TEM measurement.
DSC was used to follow the thermal properties of the dried TiO2 sample. The DSC curve was measured using a PerkinElmer DSC8000 scanning calorimeter (Waltham, MA). Nitrogen was used as the purge gas with a flow rate of 20 mL/min and the heating rate was 10 °C/min. FTIR was used to monitor the decomposition process of the sample. The FTIR spectra were collected using a Thermo-Nicolet iS10 FTIR spectrometer (Thermo Fisher Scientific, Waltham, MA) with an attenuated total reflectance unit.
The surface chemical bonding and valence band (VB) information of the samples were obtained with XPS and UPS. The XPS measurements were conducted on a Kratos Axis HS (Shimadzu Scientific Instruments, Columbia, MD) utilizing the Al Kα emission at 1487 eV; the system was further equipped with an Ar+ sputter gun. The samples were etched by Ar for 5 min; the embedded argon also allowed for calibration of the absolute binding energy position. The VB information of the samples was obtained with UPS using the He I emission line at 21.2 eV. The powdered samples were rolled on graphite conducting tape, and measurements were conducted at 1 × 10⁻⁹ Torr. The optical properties of the powders were characterized by diffusive reflectance measurement. The reflectance spectra were collected with an Agilent Cary 60 UV–Vis spectrometer (Agilent Technologies, Inc., Santa Clara, CA) with an optical reflectance fiber unit.
The photocatalytic activities of the samples were determined by measuring the photocatalytic decomposition process of methylene blue under simulated solar light irradiation. The solar simulator (81094, Newport Corporation, Irvine, CA) has a 150 W Xe lamp with an AM 1.5 air mass filter. One milligram of catalyst was added into 3.0 mL methylene blue solution (optical density of 1.0). The UV–vis absorption spectrum of methylene blue was monitored over time after the photocatalytic reaction started. The UV–vis spectrum of methylene blue was measured with an Agilent Cary 60 UV–Vis spectrometer with a spectrum range of from 400 to 800 nm.
III. RESULTS AND DISCUSSION
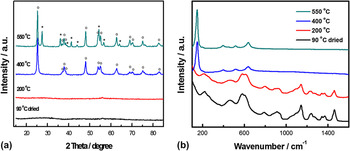
Figure 1(a) shows the XRD patterns of TiO2 made under different conditions: dried at 90 °C, heated at 200, 400, and 550 °C in air for 4 h. Apparently, the samples dried at 90 °C or subsequently heated at 200 °C were mainly amorphous since no obvious diffraction peaks were produced. After the sample was hearted at 400 °C for 4 h, peaks attributed to anatase TiO2 were observed with peak positions at 2θ = 25.3°, 38.0°, 48.0°, 54.0°, 55.0°, 62.8°, 70.2°, 75.2°, and 83.0°, as denoted by (o) in Fig. 1(a). The crystalline grain size of the anatase was calculated using the Scherrer equation: τ = (Kλ)/(β cos θ), where τ is the mean size of the ordered (crystalline) domains, which may be smaller or equal to the grain size, K is the shape factor with a typical value of 0.9, λ is the x-ray wave length, β is the line broadening full width at half maximum (FWHM) peak height in radians, and θ is the Bragg angle.Reference Jenkins and Snyder23 The anatase crystalline grain size is about 14.5 nm using the peak at (101) direction (2θ = 25.3°). After the sample was heated at 550 °C for 4 h, apparent rutile phase TiO2 PXRD patterns were observed with peak positions at 2θ = 27.5°, 36.1°, 37.7°, 54.5°, 56.7°, and 62.8°, as denoted by (*) in Fig. 1(a). The anatase crystalline grain size increased to about 17.3 nm, and the rutile crystalline grain size was about 20.5 nm using the peak at (110) direction (2θ = 27.5°). Based on the relative areas from peaks at 25.3° and 27.5°, it was calculated that the 550 °C sample consisted of about 65% anatase and 35% rutile.
(a) Powder x-ray diffractograms of TiO2 nanomaterials prepared at different conditions: dried at 90 °C, heated at 200, 400, and 550 °C in air for 4 h. The (o) denotes the diffraction peaks from anatase phase TiO2 and the (*) denotes the diffraction peaks from rutile phase TiO2. (b) Raman spectra of TiO2 nanomaterials prepared at different conditions: dried at 90 °C, heated in air at 200, 400, and 550 °C for 4 h.

Figure 1(b) shows the Raman spectra of TiO2 nanomaterials prepared with different temperatures. For the TiO2 samples dried in air at 90 °C, heated in air at 200 °C, the multiple peaks of these two samples were attributed to the titanium ethylene glycolide complex, and no apparent characteristic Raman vibrational modes were observed. This is consistent with the PXRD measurements, where only an amorphous phase was observed. After the sample was heated in air at 400 °C for 4 h, it showed strong Raman peaks of anatase characteristic vibrational peaks at 148, 396, 512, and 636 cm−1. After heating in air at 550 °C for 4 h, the samples showed stronger Raman vibrational peaks of the anatase phase. The FWHMs of Raman peaks for the sample prepared at 550 °C are smaller than those for the sample prepared at 400 °C. This suggests that the particle size increased with increased calcination temperature, consistent with the XRD results. However, no apparent rutile phase characteristic vibrational peaks were found for the sample prepared at 550 °C, in contrast to the rutile/anatase mixture nature of the sample as revealed by the PXRD results. This discrepancy suggests that the sample may have a rutile/anatase core/shell structure since the information depth of XRD can be a few to tens of micrometers, while the information depth of Raman could be only tens of nanometers on the surface.Reference Zhang, Li, Feng, Chen and Li24 Combining with PXRD and Raman results, we can deduce that the phase transition from anatase to rutile in the sample started from the center, consistent with previous studies.Reference Zhang, Li, Feng, Chen and Li24
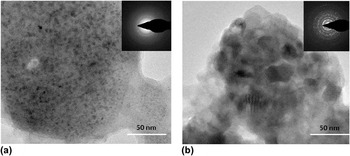
Figure 2 shows the TEM images of TiO2 nanomaterials dried at 90 °C and heated at 550 °C for 4 h along with insets that show selection area electron diffraction patterns of the samples. The sample dried at 90 °C is amorphous phase without distinctive grain boundary structures in the TEM image and a featureless diffraction ring pattern [Fig. 2(a)]. The sample heated at 550 °C shows grain sizes of around 20 nm and is highly crystalline based on the TEM image and the well-defined spots in the diffraction pattern [Fig. 2(b)]. These observations are consistent with the PXRD and Raman results.
TEM images of TiO2 nanomaterials dried at 90 °C (a) and heated at 550 °C (b) in air for 4 h. The insets show the electron diffraction patterns.

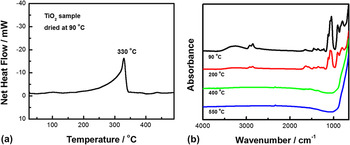
Figure 3(a) shows the DSC curve of the TiO2 sample dried at 90 °C. The titanium ethylene glycolide complex started to transform around 200 °C and finally decomposed near 330 °C. After the DSC measurement was done, the sample was taken out and its color turned to black due to the decomposition of this complex into a mixture of carbon and TiO2 under nitrogen gas. Figure 3(b) shows the FTIR spectra of the samples obtained at different conditions: dried at 90 °C, heated at 200, 400, and 550 °C for 4 h. For the samples dried at 90 °C, heated at 200 °C, apparent strong absorption peaks due to the many organic functional groups were observed. For the samples heated at 400 and 550 °C, none of these absorption peaks were observed any more, and a near featureless TiO2 infrared spectrum emerged. The FTIR observations were consistent with the results from DSC measurements. The titanium complex started to decompose and transform into TiO2 around 330 °C; above 400 °C, pure TiO2 can be obtained after it was oxidized in air.
(a) DSC curve of TiO2 sample dried in air at 90 °C. (b) FTIR spectra of the TiO2 nanomaterials prepared at different conditions: dried at 90 °C, heated at 200, 400, and 550 °C in air for 4 h.

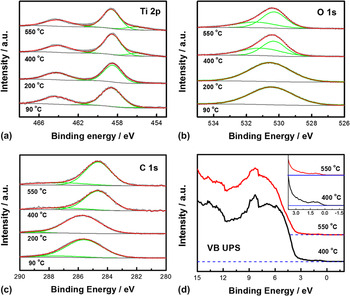
Figure 4 shows the core-level XPS spectra and the VB UPS spectra. As can be seen in Fig. 4(a) of the Ti 2p XPS spectra, the samples dried in air at 90 °C and heated in air at 200 °C only displayed the characteristic 2p 3/2 peaks of Ti4+ ions at 458.6 eV, while the samples heated in air at 400 and 550 °C displayed an additional small peak at 456.0 eV, attributable to Ti3+ ions.Reference Chen and Mao10, Reference Chen and Burda25 In Fig. 4(b) of the O 1s XPS spectra, the samples dried at 90 °C and heated at 200 °C only displayed one O2− peak centered at 530.6 eV, while the samples heated at 400 and 550 °C displayed an additional small peak at 531.0 eV, which may be attributed to O2− ions bound to H in the form of OH groups.Reference Chen, Liu, Yu and Mao26 The C 1s XPS spectra in Fig. 4(c) showed that the samples thermally treated at 90 and 200 °C displayed one peak centered at around 285.6 eV, while the samples heated at 400 and 550 °C yield one major and minor peak centered at 284.6 and 286.2 eV, respectively. The smaller carbon feature is likely the presence of a Ti–C bond.Reference Chen and Burda25 The VB UPS in Fig. 4(d) showed that both the samples heated in air at 400 and 550 °C had some additional electronic states above the VB were observed, which could be responsible for the long-tail absorption of these two samples. It was noticed that the sample heated at 400 °C showed more band gap states than that heated at 550 °C
Core-level XPS spectra of the TiO2 nanomaterials prepared at different conditions: dried at 90 °C, heated at 200, 400, and 550 °C in air for 4 h: (a) Ti 2p; (b) O 1s; (c) C 1s; (d) VB UPS spectra of the TiO2 nanomaterials heated in air at 400 and 550 °C for 4 h. The inset shows the electronic states near the VB edges.

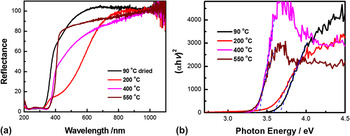
Figure 5(a) shows the UV–vis diffusive reflectance spectra of the TiO2 samples. The sample dried in air at 90 °C began to absorb light at around 650 nm and showed band gap-like absorption around 375 nm (3.31 eV). The absorption from 650 to 375 nm showed a tailing feature, suggesting that this absorption may be due to defects or oxygen vacancy.Reference Diebold27 However, the band gap-like absorption around 375 nm suggested that smaller TiO2 nanoparticles may be formed. After being heated in air at 200 °C for 4 h, the sample began to absorb light at nearly 800 nm and displayed a peak-like absorption around 480 nm as well as a band gap-like absorption around 380 nm (3.26 eV). When the sample was heated in air at 400 °C for 4 h, it showed a long-tail absorption from 1000 nm to near 400 nm, and a sharp band gap absorption around 387 nm (3.20 eV). When the sample was heated in air at 550 °C for 4 h, its long-tail absorption from 1000 nm to near 400 nm decreased and a more apparent absorption appeared near 400 nm. Again, the long-tail absorption of the samples heated at 400 and 550 °C suggests that this absorption may be due to defects, oxygen vacancy, Ti3+ ions, or possibly carbon doping from the ethylene glycol solvent in the heating process. Combined with the information from the VB UPS results, it was likely that the oxygen vacancy, carbon dopant, and Ti3+ ions contributed to the long-tail absorption in the visible region.Reference Thompson and Yates28 The 90 °C dried sample had slight yellow color, after being heated at 200 °C, its color changed into yellow orange, and then slight gray after heating in air at 400 and 550 °C, respectively. Figure 5(b) shows the Tauc plots of these samples. Since anatase TiO2 is an indirect band gap material, a value of 2 is taken for n, and assuming other samples also have indirect band gaps.Reference Park and Kim29 From the Tauc plots, the samples obtained at 90 and 200 °C show band gaps of 3.67 and 3.59 eV, respectively, while the samples heated at 400 and 550 °C show band gaps of 3.40 and 3.35 eV, respectively.
(a) Diffusive reflectance spectra of TiO2 nanomaterials prepared at different conditions: dried at 90 °C for 24 h, heated at 200, 400, and 550 °C in air for 4 h. (b) Tauc plots (n = 2 for indirect allowed transition) of these samples.

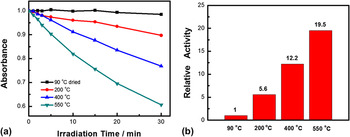
Figure 6 showed photocatalysis activity of TiO2 samples. From Fig. 5(a), we can see that the photocatalytic activity of the TiO2 sample increased with heating temperature, and if TiO2 was not heated, it had little photocatalytic activity. As compared to the TiO2 sample dried at 90 °C, the photocatalytic activity of the TiO2 samples heated in air at 200, 400, and 550 °C displayed 5.6, 12.2, and 19.5 times increase, respectively. This can be explained by the amorphous nature of the TiO2 sample dried at 90 °C and the increased crystallinity of the sample heated at higher temperature. The coexistence of the rutile and anatase phases in the sample heated at 550 °C showed the highest photocatalytic activity may be due to the highest crystallinity and the synergistic effects between the rutile and anatase phase in spite of larger grain size and smaller light absorption.Reference Zhang, Xu, Feng, Li and Li30
(a) Photocatalytic decomposition curves of methylene blue versus irradiation time by TiO2 nanomaterials prepared at different conditions: dried at 90 °C, heated at 200, 400, and 550 °C in air for 4 h. (b) Relative photocatalytic activity nanomaterials prepared at different conditions: dried at 90 °C, heated at 200, 400, and 550 °C in air for 4 h, in the period of solar light irradiation of 30 min. 0.10 g of TiO2 nanomaterials were used as photocatalyst, 3.0 mL methylene blue of optical density of around 1.0 aqueous solution was used as a proxy for pollutants, and a solar simulator equipped with a 150 W Xe lamp and AM 1.5 air mass filter was used as the light source.

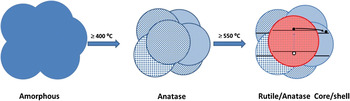
Combining the above results, we can propose the following reaction mechanism. When TTIP was added into ethylene glycol, titanium ethylene glycolide complex was formed under the basic OH− catalyst. This complex was amorphous and stable in air and lack of good photocatalytic activity. It turned into anatase TiO2 when heated in air at above 400 °C. Further heating at 550 °C transformed part of the anatase TiO2 into rutile TiO2 phase. Since Raman is more sensitive to the surface structure of the materials, and PXRD shows both surface and bulk phase of the material, the anatase feature of the Raman spectra and the mixed anatase and rutile phases from the PXRD for the sample heated at 550 °C suggests that the anatase grain inside grew and transformed into rutile, and a rutile/anatase core/shell structure was formed. Due to the slight electronic structure difference of the rutile and anatase TiO2, a n–n type of semiconductor junction was formed at the interface. This phase transformation process is illustrated in Scheme 1. This n–n junction helps the charge separation after the sample absorbs light and electrons and holes are generated. This is beneficial to photocatalytic activity and explains the highest activity of the sample calcinated at 550 °C. The long-tail absorption of the TiO2 can be attributed to the carbon dopant, Ti3+ ions, and/or oxygen vacancies, which show electronic states in the band gap.
Illustration of the phase transformation of the TiO2 nanomaterials. The n–n junction electronic structure is also sketched in the rutile/anatase core/shell mixture. The formation of this junction facilitates the charge separation of the electrons (o) and holes (•) in the core/shell composite nanostructure during the photocatalytic reaction.

IV. CONCLUSION
In summary, TiO2 nanomaterials have been obtained through a titanium ethylene glycolide route. The transformation and decomposition of the titanium complex was studied and the physicochemical properties of the TiO2 nanomaterials were investigated along with their photocatalytic performance.
ACKNOWLEDGMENTS
X.C. thanks the support from College of Arts and Sciences, University of Missouri—Kansas City and University of Missouri Research Board.