

Introduction
For most materials at low temperatures their thermal transport κ
tot involves two types of carriers: one (κ
e) is the electron (or hole) contribution, which conducts both charge and heat, and the other (κ
ph) is the phonon (or equivalently lattice) contribution, which only conducts heat; normally it is not easy to separate κ
e or κ
ph from κ
tot.[
Reference Lifshitz and Pitaevskii
1
–
Reference Lukas, Liu, Joshi, Zebarjadi, Dresselhaus, Ren, Chen and Opeil
3
] In our previous work, we successfully applied the magnetothermal resistance (MTR) method to three different single crystal metals (Al, Cu, and Zn) by suppressing κ
e in a strong magnetic field and extracted κ
ph from the extrapolation.[
Reference Yao, Zebarjadi and Opeil
4
] Unlike metals, which reveal an electron dominant thermal transport (κ
e ≫ κ
ph), semiconductors and semimetals are completely different where these two components are comparable (
 $\kappa _{{\rm ph}} \sim \kappa _{\rm e}$
) or even phonon dominant (κ
ph > κ
e).[
Reference Lukas, Liu, Joshi, Zebarjadi, Dresselhaus, Ren, Chen and Opeil
3
,
Reference Uher and Goldsmid
5
] As a result, it is germane to verify the MTR method on materials other than metals, such as single-crystal semiconductors, in the same temperature range, of which the thermal transport are usually phonon dominant. Today, many thermoelectric (TE) materials utilize a nanocomposite structure and are nearly impossible to model using fully first-principles calculation approaches because of their nearly random matrix structure. Here we explore a single-crystal of Bi2Te3 in order to encourage theoretical modeling of this and other TE materials. Using our method, we can extract lattice thermal conductivity as opposed to total thermal conductivity,[
Reference Yao, Zebarjadi and Opeil
4
] and our results could be directly compared with first-principles calculations.
When applying the MTR method, there are several important quantities for describing the transport process. The deflecting angle γ is defined as the deviation of an electron away from its previous linear motion under the influence of an applied magnetic field between two consecutive collisions and is used to identify the strength of the field[ Reference Pippard 6 ]
 $$\gamma \equiv \omega _{\rm c}\tau = \mu B = \displaystyle{{\sigma _0B} \over {ne}},$$
where ω
c is the cyclotron frequency, τ is the relaxation time, μ is the mobility, B is the magnetic induction strength, σ
0 is the zero-field electrical conductivity, n is the carrier concentration, and e is the elementary charge. When
 $\gamma = \mu B \sim 1$
, a significant suppression of the electronic conduction can be observed.[
Reference Lukas, Liu, Joshi, Zebarjadi, Dresselhaus, Ren, Chen and Opeil
3
,
Reference Pippard
6
] Here we define a threshold field B
th ≡ 1/μ as the inverse of the mobility to represent the field one needs to see the suppression, which depends on the temperature and this threshold field decreases when the temperature is reduced. In our previous paper, we found that when T < 50 K the threshold field B
th becomes smaller than our maximum applied field (100 kOe) for metals. As semiconductors usually have larger mobilities than metals, it is easier to observe the suppression of electronic conduction for semiconductors, e.g., our Bi2Te3 single crystal.[
Reference Yao, Zebarjadi and Opeil
4
]
In zero magnetic field, the Lorenz ratio is defined as,
 $$L \equiv \displaystyle{{\kappa _{\rm e}} \over {\sigma _0T}},$$
where κ e is the electrical thermal conductivity, σ 0 is the electrical conductivity, and T is the absolute temperature, all the quantities are measured in zero field. In practice, the Lorenz ratio is used to estimate the electronic contribution to the total thermal conductivity from the electrical resistivity measurements.[ Reference Zhang, Lan, Yang, Cao, Yao, Opeil, Broido, Chen and Ren 7 – Reference Zhang, Chere, McEnaney, Yao, Cao, Ni, Chen, Opeil, Chen and Ren 10 ] The standard value of the Lorenz ratio is the Sommerfeld value L 0 = (π2/3)(k B/e)2 = 2.443 × 10⁻⁸ V2/K2. This is the Wiedemann–Franz law and it is valid for metals at high temperatures and when neglecting the TE term.[ Reference Lifshitz and Pitaevskii 1 ] However, for semiconductors or typical TE materials such as Bi2Te3, or Bi2Se3 where the Seebeck coefficients are on the order of 100 μV/K at room temperature, the relation between the Lorenz ratio and its Sommerfeld value needs to be modified to include the TE term as[ Reference Lifshitz and Pitaevskii 1 ]
 $$L + S^2 = L_0$$
Although several results have been reported in the literature using a magnetic field to suppress electronic conduction,[ Reference Uher and Goldsmid 5 , Reference Armitage and Goldsmid 11 ] the applied fields were insufficient to achieve the threshold field B th throughout the experimental temperature range. It is possible to choose both a temperature range and applied a magnetic field for a particular material that allows for complete suppression. For our experiments, we use a Physical Properties Measurement System (PPMS) from Quantum Design and are able to control the magnetic field and the temperature simultaneously so that the applied magnetic field is sufficient to produce the necessary threshold field B th throughout the entire experimental temperature range (5–60 K). Under these conditions, we are able to indirectly measure the phonon thermal conductivity with a virtual suppression of electronic thermal conductivity.
Experimental details
Our samples are taken from a large p-type stoichiometric single-crystal Bi2Te3 (001) grown by the Bridgman method and were determined to have a residual resistance ratio (RRR, defined by ρ 300K/ρ 2K) of ~30. The crystal structure (001) was confirmed by x-ray diffraction using a Bruker D2 PHASER. Specimens are cut into typical dimensions of 1 × 3.5 × 10 mm3. Because silver can migrate into bismuth compounds, silver paint or epoxy was not used to make electrical/thermal contacts to the sample.[ Reference Keys and Dutton 12 – Reference Lin, Wesolowski and Lee 14 ] Due to the laminar structure of Bi2Te3 and the thickness of our specimen, soldering to sputtered metallic contacts on the surface of our samples was not considered sufficient for thermal contacts in our measurements. As a result, we built four miniature brass compression clamps with 1 mm screws to hold the sample for thermal transport measurements (κ tot and S). To ensure thermal contact between the brass clamp and sample indium dots were pressed between the clamp and the sample. Gold-coated OFHC copper flat wires, supplied by Quantum Design, were soldered onto the brass clamps and then attached to the TTO puck. Electrical contacts for resistivity and Hall measurements (ρ xx and ρ yx ) were made by pressing indium dots onto the sample. A standard four-probe method was applied for all of the electrical conductivity measurements.
Thermal conductivity and Seebeck coefficient measurements were performed using the thermal transport option (TTO) of the Quantum Design PPMS. The sample is placed in a transverse orientation where the heat flow is perpendicular to the magnetic field, which was oriented along the c-axis of Bi2Te3 single crystal. When performing the experiments, we first set the magnetic field and scan the temperature from 60 to 5 K at a rate of 0.5 K/min. The field is then set to a different fixed value and the conductivity measurement is repeated while increasing the temperature from 5 to 60 K. Thermal conductivity data were taken across the temperature region in 10 kOe intervals of a magnetic field from 0 to 90 kOe. A similar sequence is used for the electrical resistivity and Hall measurements using an LR-700 AC resistance bridge from Linear Research Inc., where the temperature was fixed and the magnetic field was scanned. For these measurements, our sample was mounted with the same orientation to the field used in the thermal transport measurements. Propagated measurement errors are calculated from the standard deviation and determined to be 3% for κ, 6% for S, 0.5% for ρ, and derived to be 0.7% for σ, 3% for κ ph, and 18% for the Lorenz ratio.
Magneto-transport measurements and analysis
Resistance in zero magnetic field can be considered as a scalar quantity and the reciprocal of electrical resistivity ρ xx is electrical conductivity σ xx . However, when applying a magnetic field to a material and measuring its resistance, the transport coefficients are no longer scalars but considered as tensor quantities, as such σ xx ≠ 1/ρ xx . Similar to our previous work of magnetoresistance measurements on single-crystal metals,[ Reference Yao, Zebarjadi and Opeil 4 ] the transport coefficients of Bi2Te3 need to be considered as tensor quantities. While it is difficult to measure the Hall resistance of single-crystal metals because of their low resistivity, it is possible to measure the Hall resistance of semiconductors such as Bi2Te3. Hall measurements can be performed here due to their particular combination of carrier concentration and mobility. Therefore, by measuring resistivity under field and the electrical conductivity component σ xx can be calculated by using the following formula:[ Reference Pippard 6 , Reference Zhang, Liu, Qi, Dai, Fang and Zhang 15 , Reference Ishiwata, Shiomi, Lee, Bahramy, Suzuki, Uchida, Arita, Taguchi and Tokura 16 ]
 $$\sigma _{xx} = \displaystyle{{\rho _{xx}} \over {\rho _{xx}^2 + \rho _{yx}^2}} $$
where ρ
xx
and ρ
yx
are the normal electrical resistivity and the Hall resistivity, respectively. To extract phonon thermal conductivity κ
ph from the total thermal conductivity κ
tot, one needs to plot κ
xx
versus σ
xx
and extrapolate to the intercept to obtain κ
ph. When extrapolating from the
 $\kappa _{xx} \sim \sigma _{xx}$
curve to determine κ
ph, the following formula is used[
Reference Yao, Zebarjadi and Opeil
4
]
 $$\kappa _{{\rm tot}}(\sigma ) = \kappa _{{\rm ph}} + \displaystyle{{\kappa _0 - \kappa _{{\rm ph}}} \over {1 + \lambda ^2((\sigma _0/\sigma ) - 1)}}$$
where κ tot and σ are the measured values of total thermal conductivity and the derived values of electrical conductivity according to Eq. (4); κ 0 and σ 0 are the above values in zero field; κ ph is one of the two fitting parameters representing the phonon thermal conductivity, while λ is the other fitting parameter representing the ratio between the thermal and drift mobilities. If λ = 1 then κ tot and σ are linearly related, which can be observed at high temperature[ Reference Lukas, Liu, Joshi, Zebarjadi, Dresselhaus, Ren, Chen and Opeil 3 ]; however, in general, this condition is not valid.
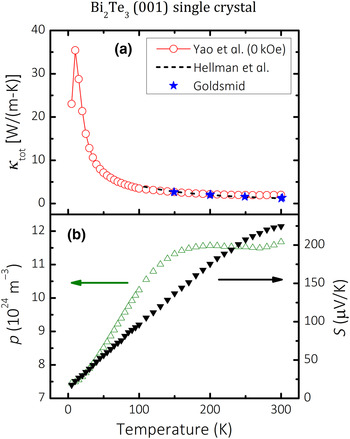
Figure 1 shows the total thermal conductivity and Seebeck coefficient measurements in zero field, as well as the extracted carrier concentration from 5 K through 300 K. In Fig. 1(a), we also include the results from Goldsmid's experiments[ Reference Goldsmid 17 ] and Hellman et al.’s first-principles calculations[ Reference Hellman and Broido 18 ] on Bi2Te3 through the temperature of 100–300 K. The data points show they coincide with each other very well, and our data below 100 K cover the range that is not covered and show that our data tend to theirs. In Fig. 1(b), the Seebeck curve shows a linear relationship with a temperature below 250 K, while the calculated carrier concentration maintains nearly constant above 200 K.
(a) Here we compare our thermal conductivity data (red open circles), Goldsmid's experimental data (blue stars, from Ref. Reference Goldsmid17) and the calculation of phonon thermal conductivity from Hellman et al. (black dashed line, from Ref. Reference Hellman and Broido18). Panel (b) Our Seebeck coefficient data (black downward triangles) are shown with the carrier concentration (green upward triangles) extracted for 5–300 K. The carrier concentration is calculated from the Hall measurements following the Drude model.

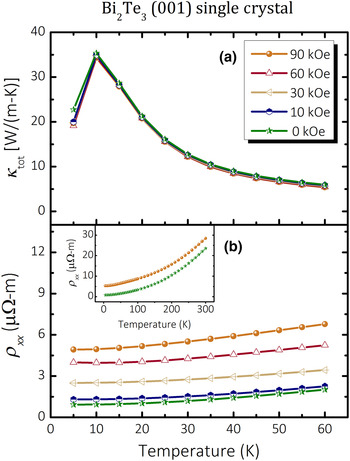
Figure 2 shows the temperature dependent behavior of the total thermal conductivity and electrical resistivity under various applied magnetic fields. Due to the low-carrier concentration as compared with metals and the high mobility of holes, the effects of the magnetoresistance are easily observed even at room temperature; see Fig. 2(b) inset. On the contrary, the thermal conductivity is not significantly suppressed even when the threshold field B th is much smaller than the applied magnetic field. The cause of this behavior lies in phonon dominance of the thermal transport of the single crystal Bi2Te3. When comparing TE nanocomposite materials with the single crystals, the latter has fewer impurities and defects and as a result, only a small portion of the phonons are scattered during the transport process.
Thermal conductivity (a) and electrical resistivity (b) are plotted against temperature between 5 and 60 K in different magnetic fields. The error bars for thermal conductivity data are ~3% and resistivity error bars are ~0.5% both appear smaller than the data symbols. The inset to (b) illustrates the magnetoresistance of Bi2Te3 up to room temperature where the difference in magnetoresistance remains approximately constant in 0 and 90 kOe.

In order to extract κ
ph from κ
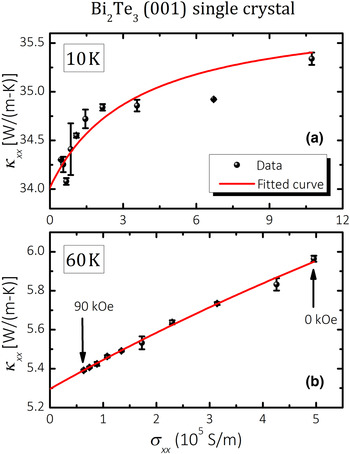
tot, one needs to plot the measured thermal conductivity versus the calculated electrical conductivity curve for a specific temperature. Figure 3 shows a set of
 $\kappa _{{\rm tot}} \sim \sigma $
curves at 10 and 60 K from which we can extrapolate the κ
ph from κ
tot, data from other temperature measurements are not shown. As shown in the literature[
Reference Lukas, Liu, Joshi, Zebarjadi, Dresselhaus, Ren, Chen and Opeil
3
]
κ
xx
and σ
xx
have a linear relationship at higher temperatures because the ratio of thermal mobility μ
t and drift mobility μ
d approaches unity. This linearity is verified by our 60 K Bi2Te3 data shown in Fig. 3(b). We note that the 10 K data in Fig. 3(a) is non-linear, but Eq. (5) can be used to fit the data over the range of electrical conductivity. The intercept from the extrapolation to zero electrical conductivity corresponds to the pure phonon thermal conductivity κ
ph, which is assumed to be field independent and is a condition of our analysis. In this sense, we able to separate the electronic and phonon thermal transport by applying a sufficiently high magnetic field across our experimental temperature range.
Total thermal conductivity is plotted against electrical conductivity at 10 K in (a) and 60 K in (b). The red fitted curve is calculated according to Eq. (5).

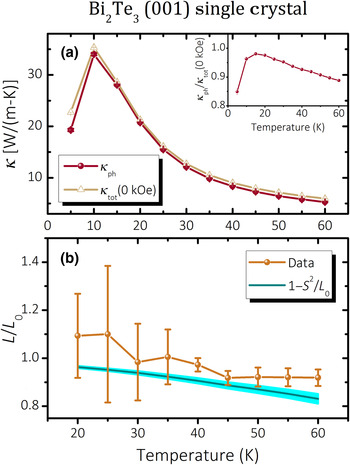
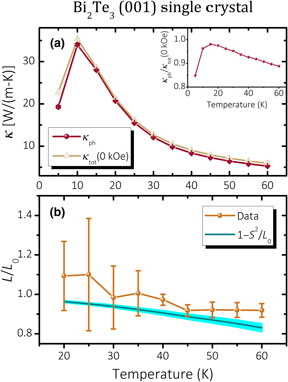
In Fig. 4(a), the phonon thermal conductivity κ
ph and total thermal conductivity at zero field κ
tot(0 kOe) are plotted together. Values of κ
ph shown in Fig. 4(a) are derived from the zero electrical conductivity intercepts at 5 K ≤ T ≤ 60 K, examples of such temperature dependent data are given in Figs. 3(a) and 3(b). The upper right inset shows the proportion of phonon thermal conductivity to the total thermal conductivity, as we see for most temperature points the ratio is above 90% (indicating that the specimen is of high quality with few impurities and defects), only at the lowest temperature, the ratio goes down. This trend is also easily understood from the behavior of heat capacity of phonons and electrons, since at low temperatures
 $\kappa _{{\rm ph}} \sim T^3$
while
 $\kappa _{\rm e} \sim T$
. Therefore, as a result, κ
ph drops more quickly than κ
e in the low-temperature range and its ratio to the total thermal conductivity decreases.
Phonon thermal conductivity (a) and dimensionless Lorenz ratio (b) are plotted against temperature. The values of κ ph shown in (a) are derived from the zero electrical conductivity intercepts indicated by Figs. 3(a) and 3(b). 1−S 2⁄L 0 is the modified Sommerfeld value according to Eq. (3). The inset to (a) shows the ratio κ ph⁄κ tot(0 kOe) across the same temperature range. Panel (b) highlights the calculations from our data L⁄L 0 and the modified W–F law within 20 K ≤ T ≤ 60 K.

The dimensionless Lorenz ratio
 $\tilde L$
, defined as L/L
0, is shown in Fig. 4(b). The smooth dark cyan curve models the modified Sommerfeld value according to Eq. (3) considering our Seebeck coefficient and TE effect data. The thickness of the smooth cyan curve indicates the error boundary spread due to the uncertainty from our Seebeck coefficient measurements. The experiment demonstrates a high correlation between our data and the modified Wiedemann–Franz law.
Discussion
In Fig. 4, we see in the temperature range 20–60 K the Lorenz ratio is very close to its standard Sommerfeld value if the TE effect is considered, suggesting for our Bi2Te3 single crystal the Wiedemann–Franz law is satisfied. Thus across this temperature range, the relaxation time of electrons in the thermal process deviates little from the relaxation time in the electrical process. This results from scattering and depends on the impurity concentration expressed in the measured RRR of ~30 for our Bi2Te3 single crystal. We note that for single-crystal metals with a RRR one order of magnitude higher than found for this semiconductor, the Lorenz ratio can differ significantly as shown in our previous paper.[ Reference Yao, Zebarjadi and Opeil 4 ] Finally, in the literature it is reported that Bi2Te3 single crystals may have a dimensionless Lorenz ratio much larger than unity for T > 60 K[ Reference Goldsmid 17 , Reference Price 19 , Reference Hinsche, Mertig and Zahn 20 ]; however, those abnormalities are due to the bipolar contributions to the total thermal conductivity and the emerging temperature is quite different from and much higher than our experimental temperature regime. We note the carrier concentration in Fig. 1(b) increases steadily with rising temperature suggesting that there is no bipolar contribution in our experimental regime (5–60 K). Using the estimate of effective mass given by Harman et al.,[ Reference Harman, Paris, Miller and Georing 21 ] we calculate the Fermi level to be 95–125 meV inside the valence band throughout the whole temperature range (5–300 K).
To extrapolate κ ph and utilize Eq. (5) with a high degree of precision, the data points must be in close proximity to the intercept, see Fig. 3. Fortunately for our Bi2Te3 samples, the threshold field is already achieved even at room temperature and as a result, the 90 kOe data point is close to the intercept for both the 10 and 60 K figures. The proximity of these data points to the intercept guarantees the reliability of our extrapolation.
We note that the MTR method and the analysis model implied by Eq. (5) is not the only experimental technique that can give quantitative measure to phonon thermal conductivity. The Righi–Leduc effect can be employed to obtain values of electron/phonon thermal conductivity, however, it is necessary to take into account the effect of the lattice thermal conductivity on the transverse heat flow.[ Reference Putley 22 ] Harman[ Reference Harman and Honig 23 , Reference Harman and Honig 24 ] and Putley[ Reference Putley 22 ] have described this experimental method and model to derive the experimental quantities. In conducting our experiments, we chose the MTR method over the Righi–Leduc effect method because of experimental limitations in our laboratory to perform thermal conductivity Hall measurements (i.e., κ xy ). We believe that the MTR method provides an estimate of the phonon and electron transport in a TE material, which can be used to provide insight toward improving its thermal conversion efficiency or figure of merit (ZT).
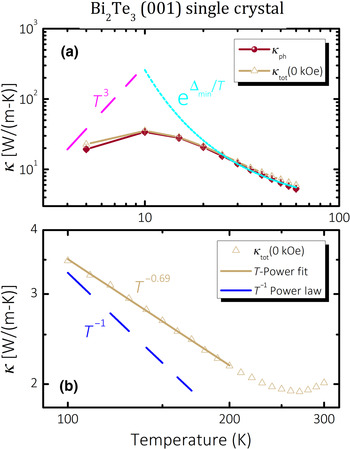
The temperature behavior of κ
ph depends on the underlying scattering mechanism. In our Bi2Te3 single crystal, the thermal transport is dominated by the phonons and we can consider three distinct temperature regions that effect scattering. In the first temperature region, one considers the phonon–phonon scattering of the Umklapp process at high temperatures (T ≫ Θ
D) where we note a T −1 behavior. In the second region or intermediate (
 $T \sim {\it\Theta} _{\rm D}$
) temperature range, we have a
 ${\rm e}^{{\it\Delta} _{{\rm min}}/T}$
dependence for the same phonon–phonon scattering.[
Reference Lifshitz and Pitaevskii
1
] And finally we have a T
3 dependence due to the heat capacity of phonons at low temperatures (T ≪ Θ
D) and this results in a peak in the
 $\kappa _{{\rm ph}} \sim T$
curve at ~10 K for our Bi2Te3 single crystal.
Figure 5(a) shows the
 $\kappa _{{\rm ph}} \sim T$
curve in a “log–log” scale, we note that at lowest temperatures the curve deviates from the T
3 power law behavior. This deviation results from the temperature limit of our data to 5 K. If it were possible to measure κ
tot from 1 to 5 K, then likely the T
3 law would be verified. (The effective limit of thermal conductivity measurements with the QD-PPMS is 5 K.) After all, compared with our data on single-crystal metals,[
Reference Yao, Zebarjadi and Opeil
4
] the peak temperature of κ
ph of Bi2Te3 is much lower. In the higher temperature regime, κ
ph begins to follow the
 ${\rm e}^{{\it\Delta} _{{\rm min}}/T}$
temperature dependence, as shown in Fig. 5(a). Figure 5(b) shows the
 $\kappa _{{\rm tot}}(0{\rm \; kOe}) \sim T$
curve in a “log–log” scale, we note that between 100 and 200 K the data exhibits a power-law behavior with an exponent of −0.69. Beyond 200 K the curve reaches a minimum followed by a slight rise at 300 K. This behavior is due to the bipolar contribution κ
bi which becomes significant when approaching room temperature. A similar bipolar contribution was observed in our previous work on bismuth antimony nanocomposites.[
Reference Lukas, Liu, Joshi, Zebarjadi, Dresselhaus, Ren, Chen and Opeil
3
]
(a) Phonon thermal conductivity and (b) total thermal conductivity of Bi2Te3 single crystal are plotted against temperature with a log–log scale. The dashed lines in (a) and (b) are guides to the eye showing different temperature dependences. The solid line in (b) is a fit over the experimental data 100 K ≤ T ≤ 200 K.

The size of the threshold field B th takes on a key role in the MTR method when attempting to suppress electronic thermal conductivity behavior. If the applied field is smaller than the threshold field over a particular temperature range, then the suppression is not sufficient to extrapolate a κ ph value. To achieve suppression, a specimen of high mobility is required, which implies that the RRR of the sample cannot be small. In a parallel study, we used the MTR method on a Bi2Se3 single crystal with a RRR of only ~2 compared with RRR of ~30 for Bi2Te3. The Bi2Se3 single crystal has a very low mobility compared with the Bi2Te3 (~10%), and thus the threshold field is never reached even at the lowest temperature. As a result, we determined that this Bi2Se3 sample with a RRR ~2 was not a viable candidate to apply the MTR method.
Conclusions
In this study, the phonon thermal conductivity and Lorenz ratio of a Bi2Te3 single crystal are extracted from the total thermal conductivity using the MTR method for 5 K ≤ T ≤ 60 K. We demonstrate experimentally that the phonon thermal conductivity for Bi2Te3 follows the
 ${\rm e}^{{\it\Delta} _{{\rm min}}/T}$
temperature dependence over the intermediate temperature range, and T −0.69 power law for the total thermal conductivity between 100 and 200 K. We note that the Lorenz ratio across the intermediate temperature range is consistent with the modified Wiedemann–Franz law. These results suggest that a comparison with the first-principles calculation in this temperature range may be helpful to understand the physics of this and other similar TE materials.
Acknowledgments
This work was supported by Solid State Solar – Thermal Energy Conversion Center (S3TEC), an Energy Frontier Research Center funded by the U.S. Department of Energy, Office of Science, Office of Basic Energy Science under award number DE-SC0001299. C.P.O. would like to thank Robert D. Farrell, S.J. and Christopher Noyes for helpful comments on the manuscript, and acknowledges financial support from the Trustees of Boston College. M.Y. is grateful to Ying Ran and Krzysztof Kempa for helpful discussions and comments on the manuscript. The work at the University of Virginia is supported by the Air Force Young Investigator Award, grant number FA9550-14-1-0316. Stephen Wilson acknowledges support from NSF CAREER Grant No. DMR-1056625.