





1 Introduction
In inertial confinement fusion (ICF), the conventional central-ignition scheme generates a high-temperature, high-density hot spot at the fuel center through spherically symmetric compression of the capsule, where a self-sustaining thermonuclear burn is initiated via energy deposition from fusion-born alpha particles[ Reference Craxton, Anderson, Boehly, Goncharov, Harding, Knauer, McCrory, McKenty, Meyerhofer, Myatt, Schmitt, Sethian, Short, Skupsky, Theobald, Kruer, Tanaka, Betti, Collins, Delettrez, Hu, Marozas, Maximov, Michel, Radha, Regan, Sangster, Seka, Solodov, Soures, Stoeckl and Zuegel 1 – Reference Abu-Shawareb, Acree and Adams 5 ]. The National Ignition Facility (NIF) has recently achieved a major milestone by demonstrating an energy gain exceeding 4 through the indirect-drive central-ignition configuration. To further enhance the laser-to-target energy coupling efficiency, while simultaneously achieving higher gain under moderate driver energy, the double-cone ignition (DCI) scheme[ Reference Zhang, Wang, Yang, Wu, Ma, Jiao, Zhang, Wu, Yuan, Li and Zhu 6 ] has been proposed. In the DCI concept, fuel compression and hot-spot formation are decoupled to relax the stringent requirements for implosion symmetry. Moreover, the DCI approach incorporates key advantages of fast ignition[ Reference Nagatomo, Johzaki, Takizawa and Fujioka 7 , Reference Kodama, Norreys, Mima, Dangor, Evans, Fujita, Kitagawa, Krushelnick, Miyakoshi, Miyanaga, Norimatsu, Rose, Shozaki, Shigemori, Sunahara, Tampo, Tanaka, Toyama, Yamanaka and Zepf 8 ], direct drive[ Reference Demchenko, Gus'kov, Kuchugov, Yakhin and Zmitrenko 9 – Reference Bose 11 ] and magnetically guided ignition schemes[ Reference Pérez, Debayle, Honrubia, Koenig, Batani, Baton, Beg, Benedetti, Brambrink, Chawla, Dorchies, Fourment, Galimberti, Gizzi, Gremillet, Heathcote, Higginson, Hulin, Jafer, Koester, Labate, Lancaster, MacKinnon, MacPhee, Nazarov, Nicolai, Pasley, Ramis, Richetta, Santos, Sgattoni, Spindloe, Vauzour, Vinci and Volpe 12 – Reference Wang, Gibbon, Sheng and Li 14 ], thereby enabling the realization of ignition configurations with non-spherically symmetric target structures.
In the DCI scheme, nanosecond (ns) laser pulses first compress the fuel through a quasi-isentropic process. The compressed fuel subsequently erupts from the head-on gold cones and collides, thereby forming a high-density central collision region[ Reference Liu, Wu, Zhang, Yuan, Zhang, Xu, Xue, Tian, Zhong and Zhang 15 ]. Picosecond (ps) laser pulses are then incident on the tip of the heating cone to generate fast electrons[ Reference Dai, Gu, Fang, Zhang, Zhang, Dong, Zhang, Yuan, Li and Zhang 16 ], which are guided by magnetic fields to deposit their energy into the collision region, and thus trigger fusion ignition. Experimentally, we observed that the compressed plasma erupting from the head-on compression cones collides to form high-density plasma with peak density exceeding 100 g/cm3, which in turn drives a shock wave that compresses the tip of the heating cone. When this shock wave breaks through the cone tip, the ensuing rarefaction wave subsequently causes its disruption. However, the DCI scheme requires that the ps laser pulses interact with the intact cone tip to effectively generate fast electrons. The existence of the shock wave will evidently perturb the interaction between the short-pulse lasers and the heating cone tip. Moreover, experiments conducted on the OMEGA laser facility indicate that, in fast ignition configurations, X-rays generated in the coronal plasma can penetrate into the interior of the heating cone. The resulting preformed plasma can significantly and detrimentally affect laser energy absorption, the divergence of fast electrons and their energy spectrum[ Reference Theobald, Solodov, Stoeckl, Anderson, Betti, Boehly, Craxton, Delettrez, Dorrer, Frenje, Glebov, Habara, Tanaka, Knauer, Lauck, Marshall, Marshall, Meyerhofer, Nilson, Patel, Chen, Sangster, Seka, Sinenian, Ma, Beg, Giraldez and Stephens 17 ]. The presence of pre-plasma can also cause the premature interaction of ps lasers with the plasma, thereby increasing the deposition range of fast electrons and degrading the energy coupling efficiency from the fast electrons to the compressed fuel. In this paper, we propose the use of an optical streak camera (OSC) to diagnose the self-emission within the heating cone. We demonstrate that, under current target design and laser conditions, the shock wave generated by the colliding plasmas does indeed affect the heating cone structure; however, this process does not influence the subsequent laser heating. Both experimental measurements and numerical simulations support this conclusion.
The main contents of this paper are organized as follows. Section 2 describes the target configuration and diagnostic setup; Section 3 presents the experimental results obtained from the self-emission imaging diagnostic system and the X-ray imaging diagnostics, followed by a discussion of the corresponding numerical simulation results and their analysis; Section 4 provides concluding remarks and summarizes the main findings.
2 Diagnostic layout
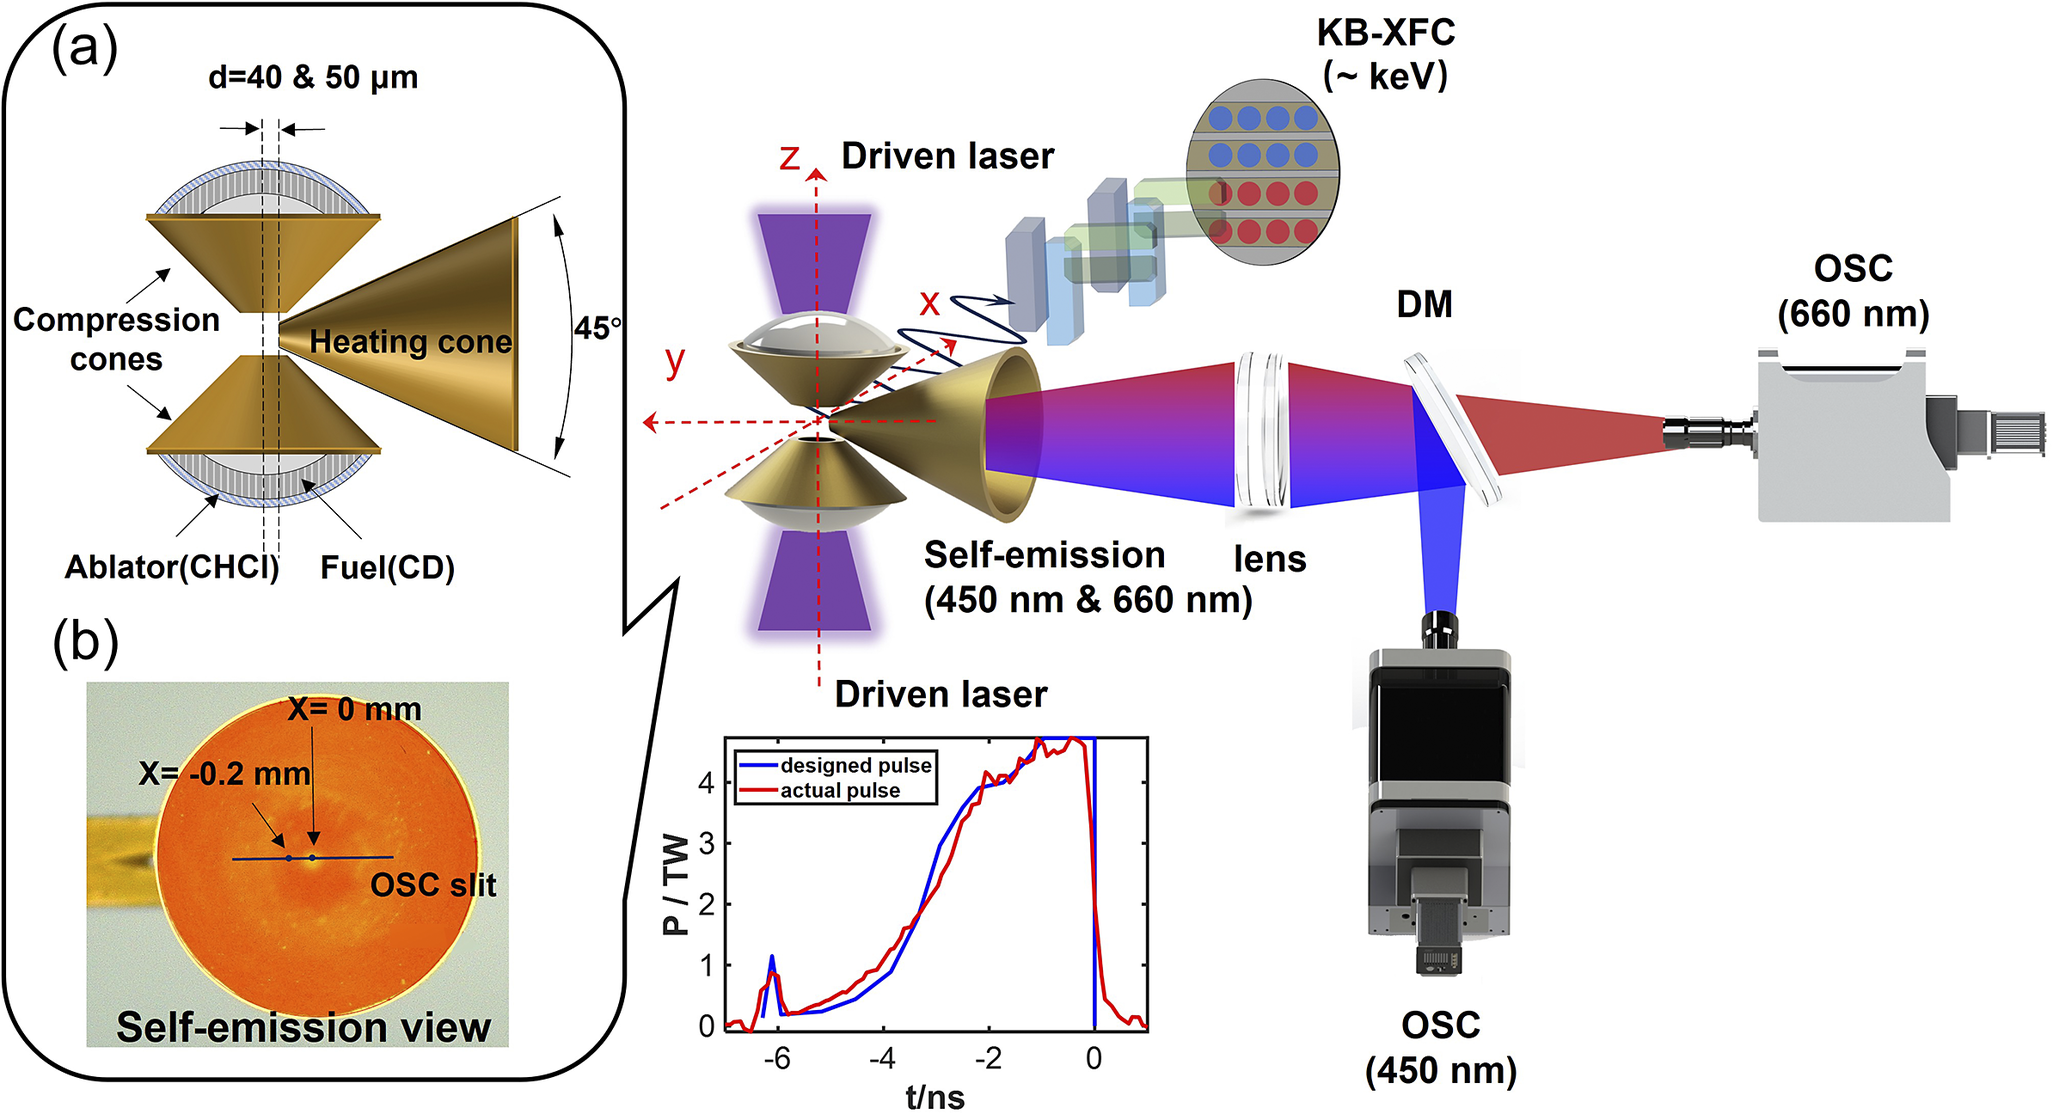
The experiment was conducted on the SG-II upgrade (SG-II UP or SGII-U) laser facility[ Reference Zhu, Zhu, Li, Zhu, Ma, Lu, Fan, Liu, Zhou, Xu, Zhang, Xie, Yang, Wang, Ouyang, Wang, Li, Yang, Fan, Sun, Liu, Liu, Zhang, Tao, Sun, Zhu, Wang, Jiao, Ren, Liu, Jiao, Huang and Lin 18 ]. Figure 1 shows a schematic diagram of the target configuration. The target consisted of a pair of symmetrically arranged gold cones with an opening angle of 100°, termed compression cones. The geometric center of the target was positioned at the target chamber center (TCC). The fuel shells were positioned within these cones, featuring an outer radius of approximately 570 μm and an inner radius of about 470 μm. The shell was composed of three concentric layers: C16H14Cl2 (CHCl), Al and C8D8 (CD). The CHCl layer was used as an ablator and also for diagnosing plasma temperature by identifying Cl characteristic lines; the intermediate 100 nm Al layer served to shield against the transmitted laser pulses; and the CD layer functioned as the primary fuel for both compression and heating. A third gold cone, defined as the heating cone, was inserted in the equatorial plane with the tip less than 60 μm away from the TCC, as shown in Figure 1(a). Experimentally, we adjusted the insertion depth d, namely the distance between the TCC and the tip of the heating cone, to control the plasma conditions inside the heating cone at the moment of ps laser injection.
Schematic of the experiment and the corresponding laser pulse shape. (a) Schematic diagram of the target structure. (b) Image from the perspective insight into the heating cone.

Figure 1 Long description
Panel a shows a cross-section of the target structure. Two vertical compression cones face each other with a central gap. The cones are layered from the outside in with an Ablator C H C l and Fuel C D. The distance d equals 40 and 50 micrometers. A horizontal heating cone with a 45 degree opening angle is positioned to the right of the gap. Panel b is a circular self-emission view showing an O S C slit with markers at X equals 0 millimeters and X equals negative 0.2 millimeters. The main experimental setup shows two vertical Driven lasers in purple striking the compression cones along the z-axis. A self-emission beam in blue and red passes through a lens and hits a D M mirror. The blue light is reflected down to an O S C 450 nanometers camera, while the red light passes through to an O S C 660 nanometers camera. Above the target, a K B dash X F C diagnostic at approximately k e V captures X-ray data. At the bottom center, a line graph plots P all over T W on the y-axis against t all over n s on the x-axis. The x-axis ranges from negative 6 to 0. A blue line for the designed pulse and a red line for the actual pulse both show a sharp initial spike followed by a steady non-linear increase to a peak of approximately 4.5 T W at 0 nanoseconds.
The experiment employed 16 beams of ns laser pulses, each delivering an energy of 1750 J, with the temporal pulse shape according to the designed DCI-R9 profile[ Reference Wu, Yang, Ma, Zhang, Zhang, Yuan, Liu, Liu, Zhong, Zheng, Li and Zhang 19 ] (see the inset of Figure 1). A visible light imaging system was implemented to record the temporal evolution of the self-emission within the heating cone. The imaging and recording system collects self-emission from the heating cone at two central wavelengths, 450 and 660 nm. The optical emission from the cone was first collected by a primary lens with a focal length of F = 300 mm, providing a 3× imaging magnification. Subsequently, the self-emission was delivered to the detector via an image relay system and a tertiary imaging system, achieving an overall optical magnification of 10×. The OSC[ Reference Rai, Shukla, Pant and Bhawalkar 20 ], serving as a one-dimensional imaging detector, recorded the temporal evolution of horizontal visible light emission within the heating cone. As shown in Figure 1(b), the spatial field of view of the OSC is defined by the region marked as the OSC slit. A dichroic mirror (DM), in combination with bandpass filters, was used to spectrally isolate self-emission at the desired wavelengths. To mitigate background noise generated during laser–plasma interactions, a 380 nm long-pass filter and notch filters at 351 and 527 nm were inserted into the optical path to block third-harmonic (3ω) and second-harmonic (2ω) scattered light from entering the detection system. The self-emission in the X-ray spectral range from the collision region plasma was collected using a Kirkpatrick-Baez X-ray framing camera (KB-XFC)[ Reference Fang, Zhang, Dong, Zhang, Zhang, Yuan, Li and Zhang 21 , Reference Yi, Si, Fang, Fang, Wu, Qi, Yuan, Zhang and Wang 22 ] system, composed of a KB microscopic imaging assembly and an X-ray framing camera. The KB-XFC system collected keV-range X-rays from the collision region through the equatorial plane. Temporal separation of successive X-ray images was achieved by applying scanning high-voltage pulses to the microstrip electrodes of the framing camera, achieving a temporal resolution of approximately 90 ps, with an interframe spacing of about 100 ps.
3 Results and discussion
3.1 Results and discussion: optical self-emission
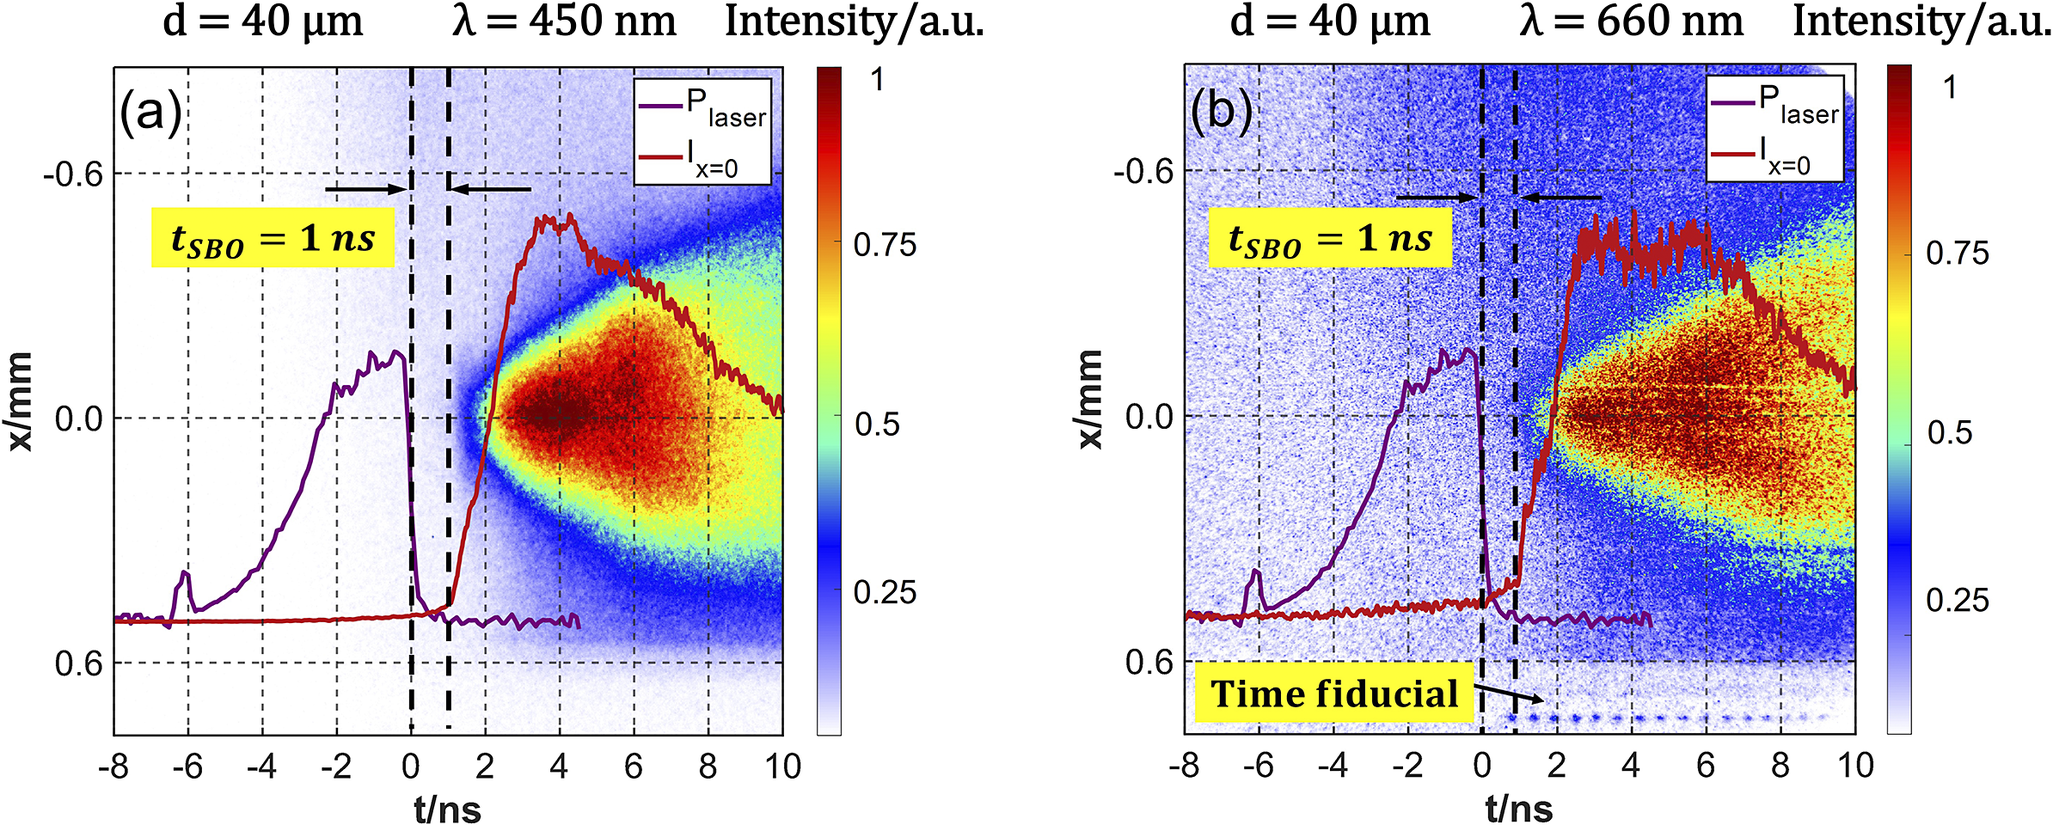
A typical signal of the optical emission history from the heating cone is shown in Figure 2. The laser pulse employed the designed DCI-R9 profile, with the temporal axis explicitly defined by setting time zero at the 50% point of the pulse’s falling edge. The t-axis of the image represents the temporal axis, utilizing the 20 ns range setting of the streak camera as the temporal window. The x-axis represents the spatial axis, with the spatial origin defined at the tip position of the heating cone. Figure 2 presents the recorded self-emission signals within the cone at 450 and 660 nm wavelengths, respectively. Time-resolved measurements of the self-emission at these two wavelengths revealed a highly consistent temporal evolution of their emission intensities, with no significant wavelength dependence observed, which serves as a critical basis for determining the radiation mechanism. Both bremsstrahlung and thermal radiation produce a band-like continuum spectrum. In general, the emission from coronal regions and collision region is dominated by bremsstrahlung, whereas the emission observed within the cone in our experiments is primarily governed by thermal radiation mechanisms. Furthermore, owing to the strong wavelength dependence of stray light generated by laser–plasma instabilities (LPIs), any contamination in the self-emission light path would be expected to cause marked differences between the 450 and 660 nm signals. Since this was not observed, it verifies that the designed optical system collected only the self-emission within the heating cone.
Temporal evolution of self-emission within the heating cone (insertion depth d = 40 μm): (a) 450 nm and (b) 660 nm wavelengths signals. The purple dashed curve represents the actual laser pulse profile. The streak camera fiducial record in the lower right-hand corner of the image serves to establish the detector’s time zero. The shock breakout time (t SBO) at the heating cone tip is identified from the time delay between the end of the nanosecond laser pulse and the start of the increase in cone-tip self-emission.

Figure 2 Long description
A two-panel attribute space diagram labeled a and b. Both panels share identical axes: the horizontal x-axis represents time t in nanoseconds from negative 8 to 10, and the vertical y-axis represents position x in millimeters from negative 0.6 to 0.6. A color scale on the right of each panel indicates intensity in arbitrary units from 0 to 1, transitioning from blue to yellow to red.
* Panel a (450 nanometers): A purple curve representing P sub laser rises from negative 6 nanoseconds, peaking near 0 nanoseconds before dropping sharply. A red curve representing I sub x equals 0 remains flat until 1 nanosecond, where it rises sharply to a peak at 4 nanoseconds and then gradually decays. The background heat map shows a concentrated red and yellow emission region starting at t equals 1 nanosecond, expanding outward in a cone shape toward the right. Two vertical dashed lines at t equals 0 and t equals 1 nanosecond are marked with arrows indicating a t sub S B O of 1 nanosecond.
* Panel b (660 nanometers): Displays a similar structure to panel a but with higher noise levels in the blue background. The red curve I sub x equals 0 shows a more jagged peak between 2 and 6 nanoseconds. In the bottom right corner, a yellow box labeled Time fiducial points to a series of small blue dots aligned horizontally. The t sub S B O interval of 1 nanosecond is again marked between vertical dashed lines.
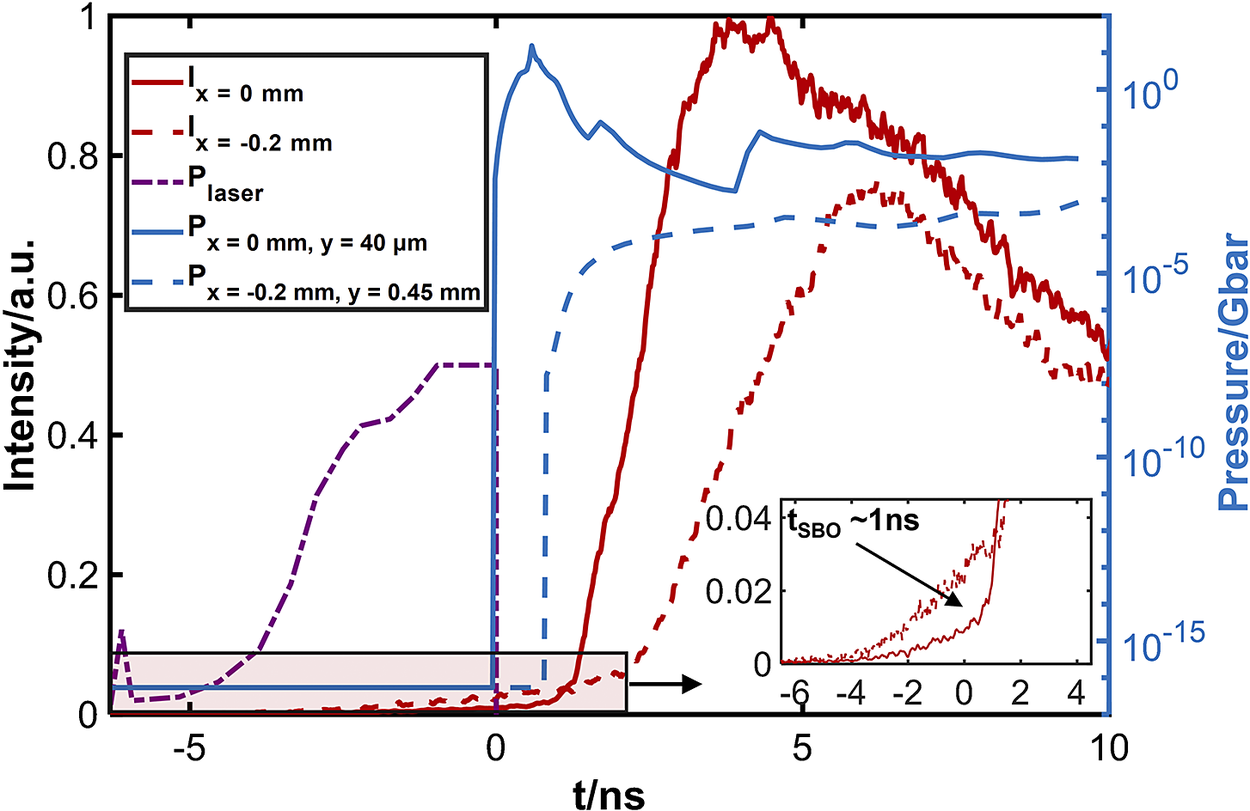
To analyze the emission within the cone and account for the cone tip diameter of approximately 60 μm, we extracted the temporal evolution of the integrated intensity from regions of interest near x = 0 and x = –0.2 mm on the heating cone tip, each spanning 60 μm, as shown in Figure 1(b). The resulting temporal profiles are shown in Figure 3. It is evident that the emission behavior at the inner walls of the cone differs significantly from that at the cone tip. At the side walls, particularly at the x = –0.2 mm position, emission signals were detected at an earlier time. In contrast to the emission at the cone tip, their temporal evolution exhibits distinct characteristics: the wall emission increases gradually over time. Regarding the origin of this emission, two possible mechanisms may account for its generation. Firstly, under the influence of hard X-rays generated during laser–target interaction, the inner surface of the heating cone undergoes gradual ionization, producing low-temperature plasma. This process is relatively gradual and continuous. However, drawing upon previous work on indirect-drive fast ignition, it has been demonstrated that with a cone tip thickness of 14 μm, preheating effects from indirect-drive X-rays can be effectively controlled[ Reference Liu, Shan, Zhou, Wu, Zhu, Peng, Xu, Wang, Zhang, Bi, Zhang, Zhang, Shui, He, Yang, Chen, Chen, Chen, Yang, Yuan, Wang, Gu and Zhang 23 ]. In our experimental configuration, the cone wall thickness is 20 μm. Therefore, the influence of X-ray preheating can be effectively ruled out. The second possible explanation for pre-plasma formation inside the heating cone involves the rapid diffusion of coronal plasma, which subsequently acts as a conductive bridge linking the coronal plasma region to the heating cone. Within the background plasma near the irradiation site, cold electron backflow can be induced. This backflow propagates through the low-density plasma toward the heating cone, thereby driving strong currents inside the cone. These currents cause ionization and rapid expansion of the gold cone material.
Temporal evolution of plasma self-emission at different positions (x = 0 mm, –0.2 mm) within the heating cone along with the temporal evolution of pressure on the tip and outer wall (x = 0 mm, y = 40 μm; x = –0.2 mm, y = 0.45 mm) of the heating cone obtained from MULTI-2D simulations.

Figure 3 Long description
A line graph with two vertical axes. The left Y axis represents Intensity in a dot u dot from 0 to 1. The right Y axis represents Pressure in G bar on a logarithmic scale from 10 super negative 15 to 10 super 0. The X axis represents time t in n s from negative 6 to 10.
Five data series are plotted:
* P sub laser (purple dash-dot line): Rises from t equals negative 6, plateaus at 0.5 intensity between t equals negative 1 and 0, then drops to zero.
* P at x equals 0 mm, y equals 40 micrometers (solid blue line): Sharp vertical rise at t equals 0 to nearly 10 super 0 G bar, followed by a gradual decay.
* P at x equals negative 0.2 mm, y equals 0.45 mm (dashed blue line): Rises sharply at t equals 1 to approximately 10 super negative 3 G bar, then plateaus.
* I at x equals 0 mm (solid red line): Begins a steep linear increase at t equals 1, peaking at intensity 1 around t equals 4, then decays.
* I at x equals negative 0.2 mm (dashed red line): Begins rising at t equals 2, peaking at intensity 0.75 around t equals 6, then decays.
An inset graph in the bottom right zooms into the region between t equals negative 6 and 4 for the red intensity lines. An arrow points to the onset of the rise, labeled t sub S B O is approximately 1 n s.
However, the pre-plasma formed on the side walls of the cone did not extend to the cone tip, and the emission intensity at the cone tip shows an abrupt rise. This sudden change corresponds more closely to hydrodynamic processes involving material state transitions. The shock wave front represents a mathematical discontinuity where physical quantities change abruptly across it, which aligns well with the observed sharp intensity change at the cone tip. Figure 3 also presents the pressure distribution at the outer cone tip (x = 0 mm, y = 40 μm) and at the outer side wall (x = –0.2 mm, y = 0.45 mm) from the two-dimensional radiation hydrodynamics simulation code MULTI-2D[ Reference Liu, Wu, Zhang, Yuan, Zhang, Xu, Xue, Tian, Zhong and Zhang 15 , Reference Lei, Wu, Ramis and Zhang 24 ]. In the following, we analyze the composition of this pressure and explain how it is generated and drives the shock wave, thereby affecting the heating cone.
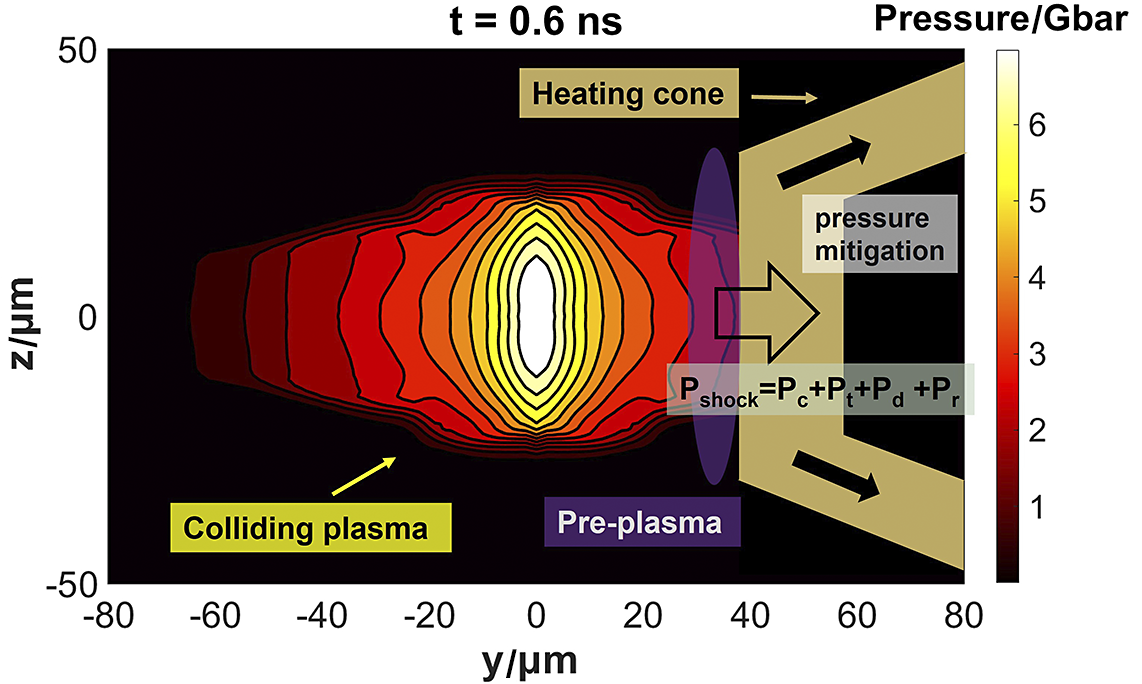
The generation of the shock wave requires a pressure driver. In our experiment, the shock wave at the heating cone tip is driven by a strong pressure gradient on the sides of the tip. In the region close to the colliding plasmas, the plasma pressure mainly consists of the degeneracy pressure, thermal pressure, dynamic pressure and radiation pressure of the plasma, as shown in Figure 4.
Schematic of the imploding plasma at the peak collision moment. The region where it contacts the tip of the heating cone drives a shock wave, causing shock compression in the cone tip area.

Figure 4 Long description
A 2 D plot with y in micrometers on the horizontal axis from negative 80 to 80 and z in micrometers on the vertical axis from negative 50 to 50. At the center, y equals 0, is a high-pressure plasma core shown as a white vertical oval. Moving outward, concentric contour lines transition from yellow to orange to dark red, representing decreasing pressure. A color scale on the right indicates pressure in G bar from 0 to over 6. To the right of the plasma, between y equals 30 and 40, a purple vertical oval is labeled Pre-plasma. Further right, a gold-colored structure labeled Heating cone opens outward. A large white arrow points from the plasma into the cone tip. Inside the cone, a gray box is labeled pressure mitigation. Below this, an equation reads P sub shock equals P sub c plus P sub t plus P sub d plus P sub r. Black arrows within the cone arms point diagonally away from the center. The top of the plot is labeled t equals 0.6 n s.
The total shock-driving pressure can be decomposed into several physically distinct contributions:

where
${P}_\mathrm{c}$
 ,
${P}_\mathrm{t}$
 ,
${P}_\mathrm{d}$
 and
${P}_\mathrm{r}$
 denote the electron degeneracy pressure, thermal pressure, dynamic pressure and radiation pressure, respectively.
The electron degeneracy pressure
${P}_\mathrm{c}$
 , following the formulation of Chandrasekhar[
Reference Chandrasekhar
25
, Reference Chandrasekhar
26
], is given by the following:


where
${\xi}_\mathrm{c}={p}_\mathrm{c}/\left({m}_\mathrm{e}c\right)$
 , and
${p}_\mathrm{c}={\left(3{h}^3{n}_\mathrm{e}/8\pi \right)}^{1/3}$
 is the Fermi momentum. In the non-relativistic limit relevant to the present study, this reduces to the following approximation:
${P}_\mathrm{c}=\frac{\pi^{2/3}}{5{m}_\mathrm{e}}{\boldsymbol{\hslash}}^2{n}_\mathrm{e}^{5/3}$
 .
The thermal pressure
${P}_\mathrm{t}$
 arises from the thermal motion of plasma particles and can be expressed as follows:

where n is the particle number density, k is the Boltzmann constant and T is the plasma temperature.
The dynamic pressure
${P}_\mathrm{d}$
 represents the dynamic pressure of the plasma, contributed by the lateral expansion of the plasma after collision, and can be written as follows:

where
$\rho$
 is the mass density and
$u$
 is the flow velocity.
Finally, the radiation pressure[
Reference Bhambhu and Prajapati
27
]
${P}_\mathrm{r}$
 is expressed as follows:

where
${\alpha}_\mathrm{r}=\frac{8{\pi}^5}{15}\frac{k_\mathrm{B}^4}{h^3{c}^3}\cong 7.56\times {10}^{-15}\ \mathrm{erg}\cdot {\mathrm{cm}}^{-3} \cdot {\mathrm{K}}^{-4}$
 .
By substituting the temperature of the plasma under DCI conditions into Equation (6), we find that the contribution of radiation pressure is negligible compared to the other components in shock-driving pressure. Using the simulated plasma pressure together with the Rankine–Hugoniot relations,
$P={\rho}_0{U}_\mathrm{s}{u}_\mathrm{p}={\rho}_0\left(c+s{u}_\mathrm{p}\right){u}_\mathrm{p}$
 , the parameters from the LASL SHOCK HUGONIOT DATA[
Reference Marsh
28
] (c = 3.07 km/s, s = 1.54) are also incorporated; then, the transient propagation velocity of the shock wave
${U}_\mathrm{S}(t)$
 can be calculated. Based on the transient shock wave velocity
${U}_\mathrm{S}(t)$
 at different times, characteristic lines can be plotted as follows:

The envelope of these characteristic lines is defined as follows:

which represents the leading edge of the shock front. Using the formula

where L is the thickness of the gold cone tip, the time
${t}_\mathrm{b}$
 at which the shock wave breaks through the heating cone tip can be determined.
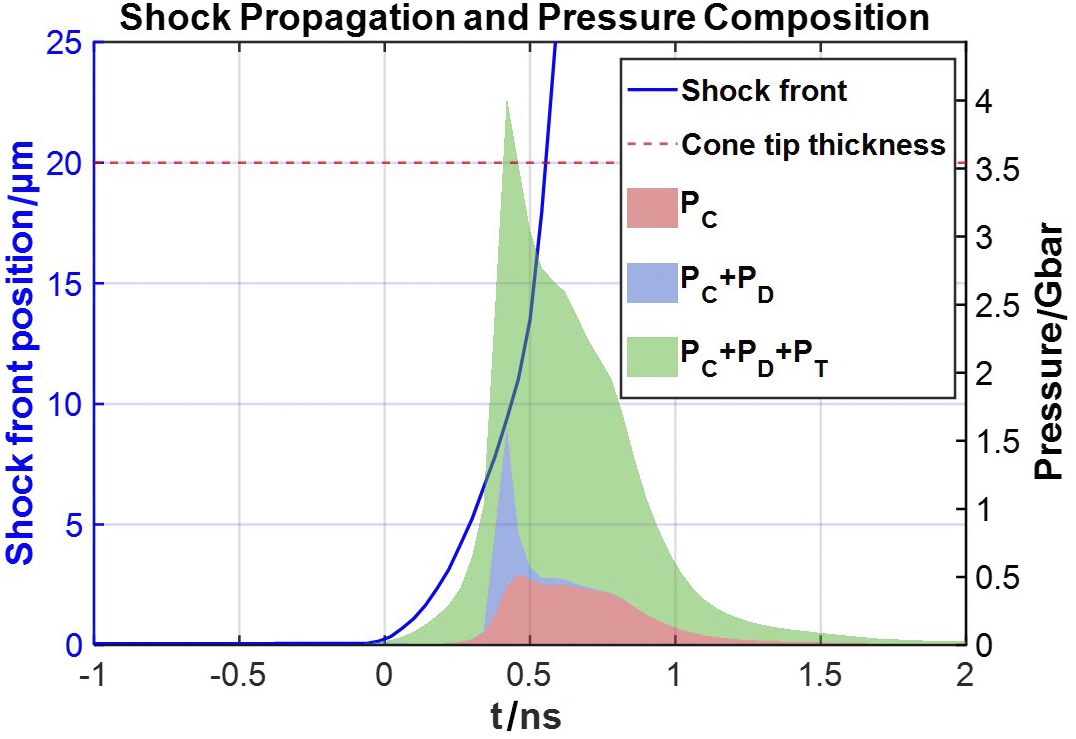
By substituting the simulated pressure of the imploding plasma at the boundary of the heating cone into Equation (9), the times at which the shock wave breaks through the cone tip and the sidewall can be solved. Figure 5 presents a stacked plot showing the pressure components. The analysis reveals that thermal pressure accounts for the highest fraction, providing the dominant contribution to the pressure required for shock breakout (SBO) at the heating cone tip. Theoretically, the moments of SBO at the cone tip and the sidewall are calculated to be approximately 0.6 and 17.8 ns, respectively, after the main laser pulse ends. The experimentally measured time for SBO at the heating cone tip is approximately 1 ns after the main laser pulse ends. The slight discrepancy compared with the theoretical value mainly arises from the following explanations. Firstly, the ideal one-dimensional planar shock assumption is used in the theoretical calculation, whereas the actual heated cone structure in the experiment mitigates the shock through its sidewalls. Secondly, the realistic colliding plasmas develop turbulent structures, which introduce an oblique impact angle at the cone tip and thereby reduce the axial shock strength. In addition, radiation from the collision-zone plasma generates the pre-plasma outside the cone tip. The shock driven by the collision must first compress and combine in this pre-plasma, further delaying the time for breakthrough at the cone tip. For the sidewall emission, we estimate that the shock wave driven by this pressure would require at least tens of nanoseconds to break through the heating cone wall. Therefore, the emission signal represented by the red dashed line in Figure 3, observed at the cone sidewall, is more likely attributable to plasma diffusion into the heating cone after the rarefaction wave disrupts the cone tip.
Temporal evolution of the shock propagation characteristics and the pressure at the cone-tip region. The proportional contributions of various pressure components are illustrated via a stacked area plot.

Figure 5 Long description
The horizontal X axis represents time t in n s, ranging from negative 1 to 2. The primary vertical Y axis on the left represents Shock front position in micrometers, ranging from 0 to 25. The secondary vertical Y axis on the right represents Pressure in G bar, ranging from 0 to 4.5.
Key data features include:
* A solid blue line labeled Shock front starts at 0 micrometers until t equals 0, then rises exponentially, crossing 20 micrometers at approximately t equals 0.55 n s.
* A horizontal dashed red line labeled Cone tip thickness is fixed at 20 micrometers.
* A stacked area plot represents pressure components starting at t equals 0.
* The bottom layer in red represents P sub C, which peaks at approximately 0.5 G bar around t equals 0.5 n s.
* The middle layer in blue represents the addition of P sub D, creating a combined peak of P sub C plus P sub D at approximately 1.5 G bar.
* The top layer in green represents the total pressure P sub C plus P sub D plus P sub T, which reaches a sharp maximum peak of approximately 4.2 G bar at t equals 0.45 n s before tapering off toward 0 by t equals 2 n s.
Based on previous analysis, the emission signal at the cone tip predominantly originates from SBO driven by the highly compressed fuel at the core, which disrupts the cone tip. The SBO occurs at about 1 ns after the ns laser pulse ends. During SBO, the count rate in the cone tip region exhibits a sharp increase. Subsequently, the rarefaction wave disrupts the cone tip, allowing the high-density plasma from the collision region to enter the heating cone. This influx leads to a sustained rise in the count rate until approximately 4 ns after the falling edge of the ns laser pulse, when cooling of the imploding collision plasma results in a gradual decrease in the detected emission at the cone tip. Furthermore, theoretical analysis highlights a distinct advantage of the DCI scheme over the traditional fast ignition approach. In the conventional scheme, the heating cone is continuously immersed in low-density DT gas and subjected to persistent plasma pressure. In contrast, based on the pressure profile, the heating cone in the DCI scheme experiences significant pressure when the colliding plasmas exit the compression cones and begin to stagnate. Consequently, the impact of the shock wave on the heating cone occurs later.
Under the current physical conditions, the temporal window for ps laser injection and heating is fixed. Experimentally, we can adjust the plasma conditions inside the heating cone at the moment of ps laser injection by varying its insertion depth relative to the collision region. Precise determination of the insertion depth d of the heating cone is essential for the experiment. If d is excessively small, the heating cone will be adversely affected by the imploding collision plasmas. The shock wave driven by the colliding plasmas will break through the tip of the heating cone, making it difficult to achieve optimal heating. The plasma that breaches the cone tip rapidly expands within the heating cone, causing the laser to interact with the plasma prematurely under non-ideal focusing conditions, compromising the production efficiency of fast electrons. Furthermore, this premature laser–plasma interaction leads to the generation of fast electrons at a location farther from the high-density collision region. Considering the divergence angle of fast electrons, this effect severely diminishes the energy deposition efficiency. Under such conditions, the production and deposition efficiency of fast electrons are significantly reduced. Conversely, if d is too large, fast electrons generated at the tip of the heating cone must traverse a longer path to deposit their energy into the high-density plasma formed by the collision. These fast electrons inherently possess a certain divergence angle, whereby the longer their propagation path, the broader their transverse distribution becomes upon reaching the collision region, resulting in a lower fraction of energy deposited into the high-density plasma. Therefore, it is critical to optimize the insertion depth of the heating cone. The objective is to minimize d as much as possible while ensuring that the heating cone remains unaffected at the time of ps laser injection.
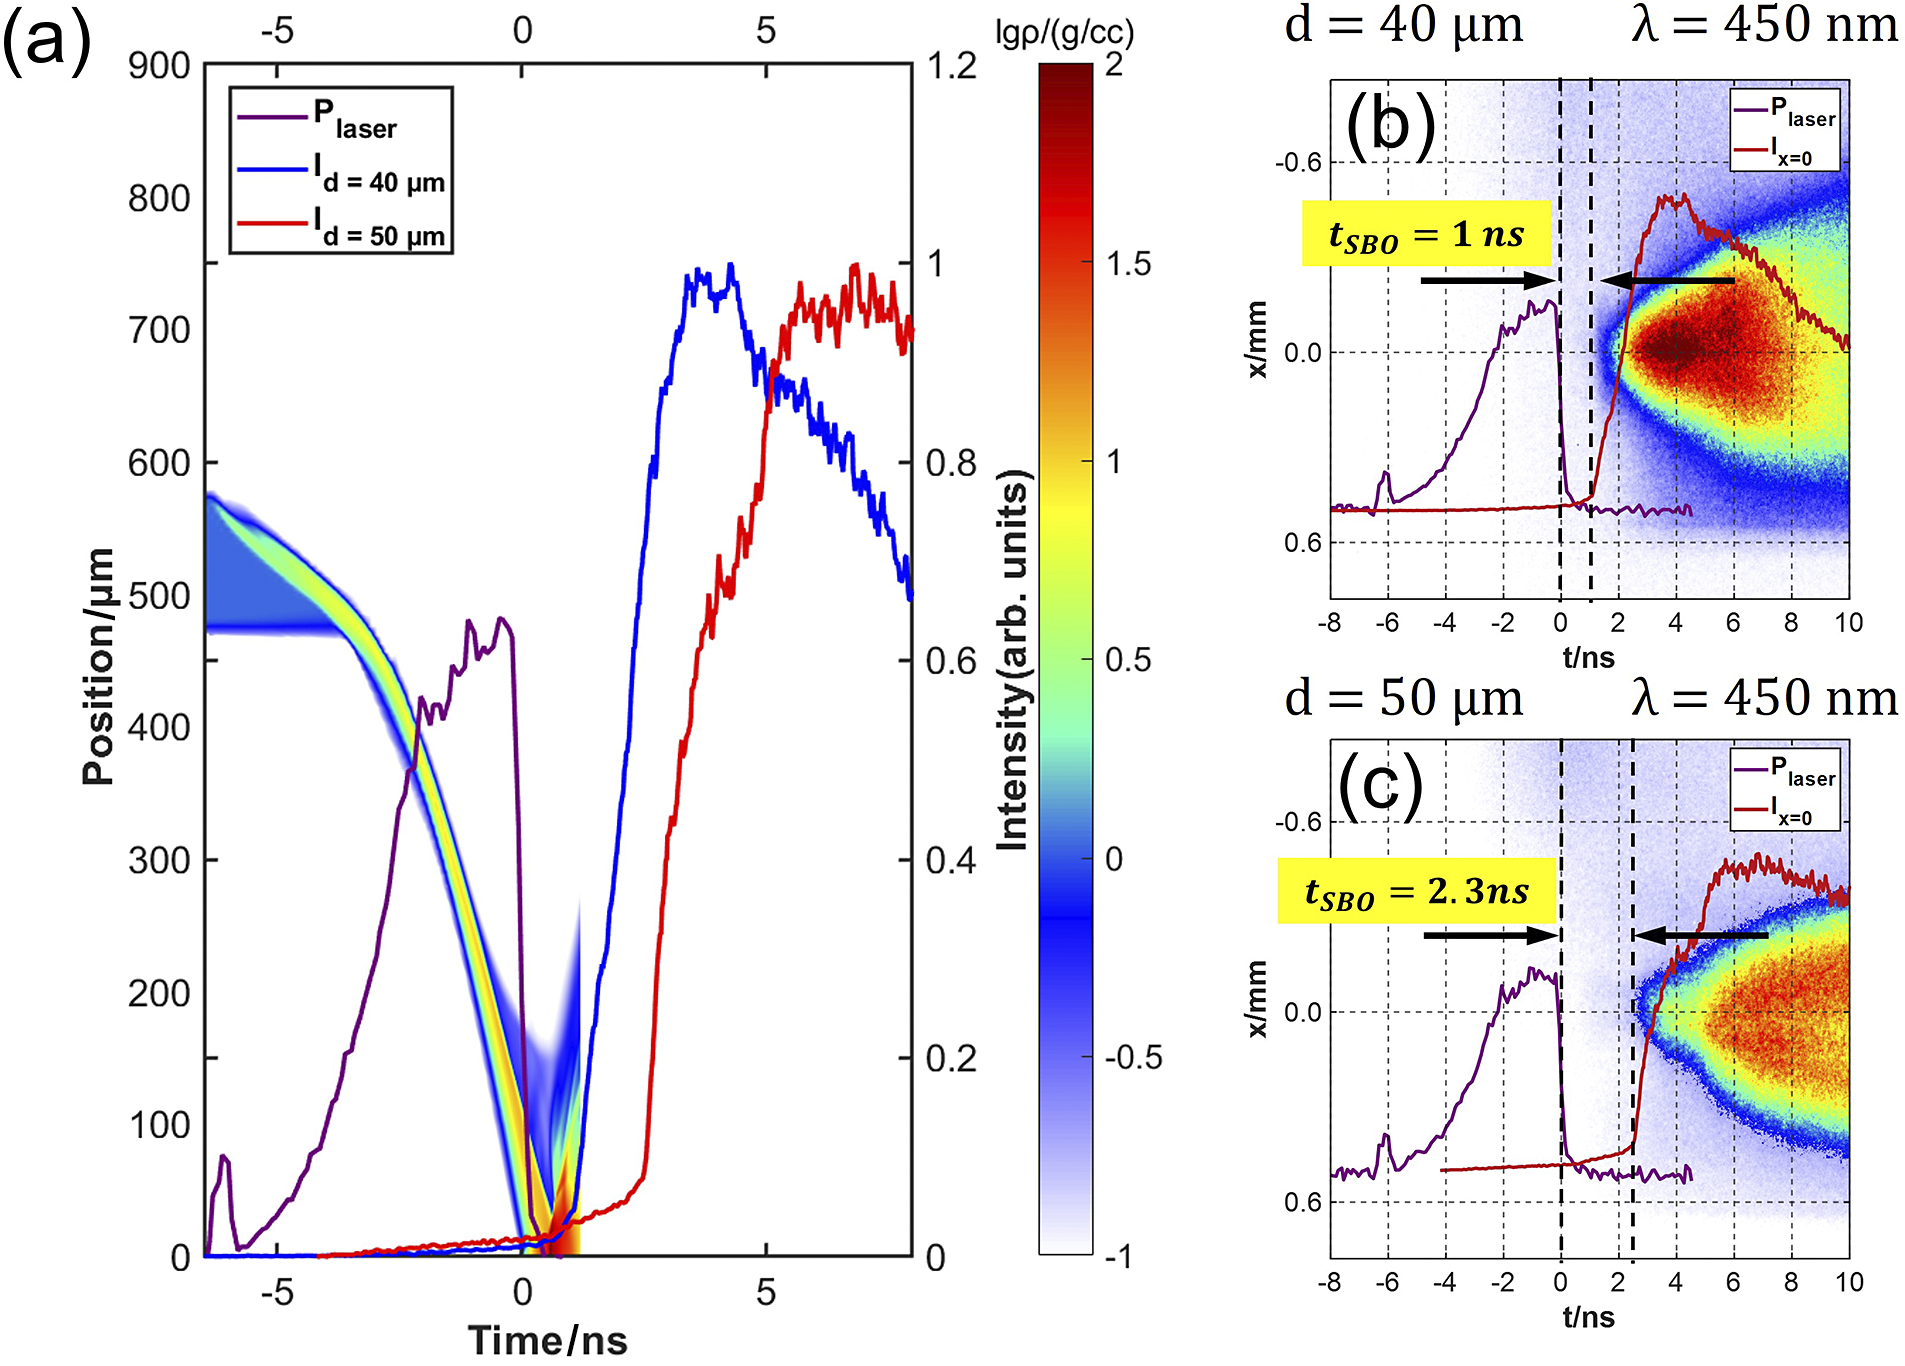
Experimentally, we systematically varied the insertion depth of the heating cone to investigate the timing of cone-tip disruption emission signals at depths of d = 40 and 50 μm. As shown in Figure 6, for d = 40 μm, SBO occurs approximately 1 ns after the termination of the ns laser pulse. In contrast, for d = 50 μm, SBO is observed at approximately 2.3 ns after the laser pulse ends. In addition to plotting the self-emission in the cone tip region for insertion depths of d = 40 μm and d = 50 μm, Figure 6(a) illustrates the plasma flow diagram under the current laser–target configuration. Analysis of the MULTI-2D simulation identifies the optimal injection time for the ps heating beam as the instant of peak density in the collision zone, specifically about 0.6 ns following the termination of the ns laser pulse. Under the current laser intensity and target design parameters, an insertion depth of 40 μm for the heating cone simultaneously satisfies the physical objectives of achieving high fast-electron production efficiency and high fast-electron energy deposition efficiency.
(a) Self-emission in the cone tip region and the flow diagram obtained from MULTI-2D. Temporal evolution of self-emission inside the heating cone at insertion depths of (b) d = 40 μm and (c) d = 50 μm.

Figure 6 Long description
Panel a is a large line graph with a primary x-axis of Time in n s ranging from negative 5 to 5 and a primary y-axis of Position in micrometers from 0 to 900. A secondary y-axis on the right shows Intensity in arbitrary units from 0 to 1.2. A color scale bar for l g rho in grams per cubic centimeter ranges from negative 1 to 2. The graph shows three curves. P sub laser in purple peaks near time 0. I sub d equals 40 micrometers in blue rises sharply after time 0 to a peak near 750 micrometers at 4 n s. I sub d equals 50 micrometers in red rises later, peaking near 750 micrometers at 7 n s. A diagonal multicolored flow diagram from M U L T I 2 D descends from position 600 to 0 between time negative 5 and 1.
Panels b and c are heatmaps showing x position in millimeters versus time in n s for a wavelength lambda of 450 n m.
Panel b for d equals 40 micrometers shows a shock breakout time t sub S B O of 1 n s. A purple P sub laser curve drops at time 0, and a red I sub x equals 0 curve rises sharply at 1 n s, coinciding with the start of a bright yellow and red emission region.
Panel c for d equals 50 micrometers shows a t sub S B O of 2.3 n s. The purple laser curve drops at time 0, while the red intensity curve and the corresponding bright emission region on the heatmap are delayed until 2.3 n s.
To summarize, optical self-emission diagnostics demonstrate that the imploding collision plasmas in the DCI scheme drive a shock wave breakthrough at the heating cone tip. Simulation comparison indicates that for the target with a 40 μm insertion depth, the cone tip is impacted by the shock later than the peak implosion moment (the ps laser injection timing), which satisfies the present experimental requirement.
At the ignition scale, the nanosecond laser energy required for implosion will be far greater than that used in the present experiment, coupled with a higher fuel mass. The larger amount of laser energy is distributed and deposited across the increased fuel mass. In this way, the plasma pressure is expected to be comparable with that described in this paper. Fully validating cone survivability under ignition-scale conditions remains an open question, requiring further dedicated experiments.
3.2 Results and discussion: KB-XFC system
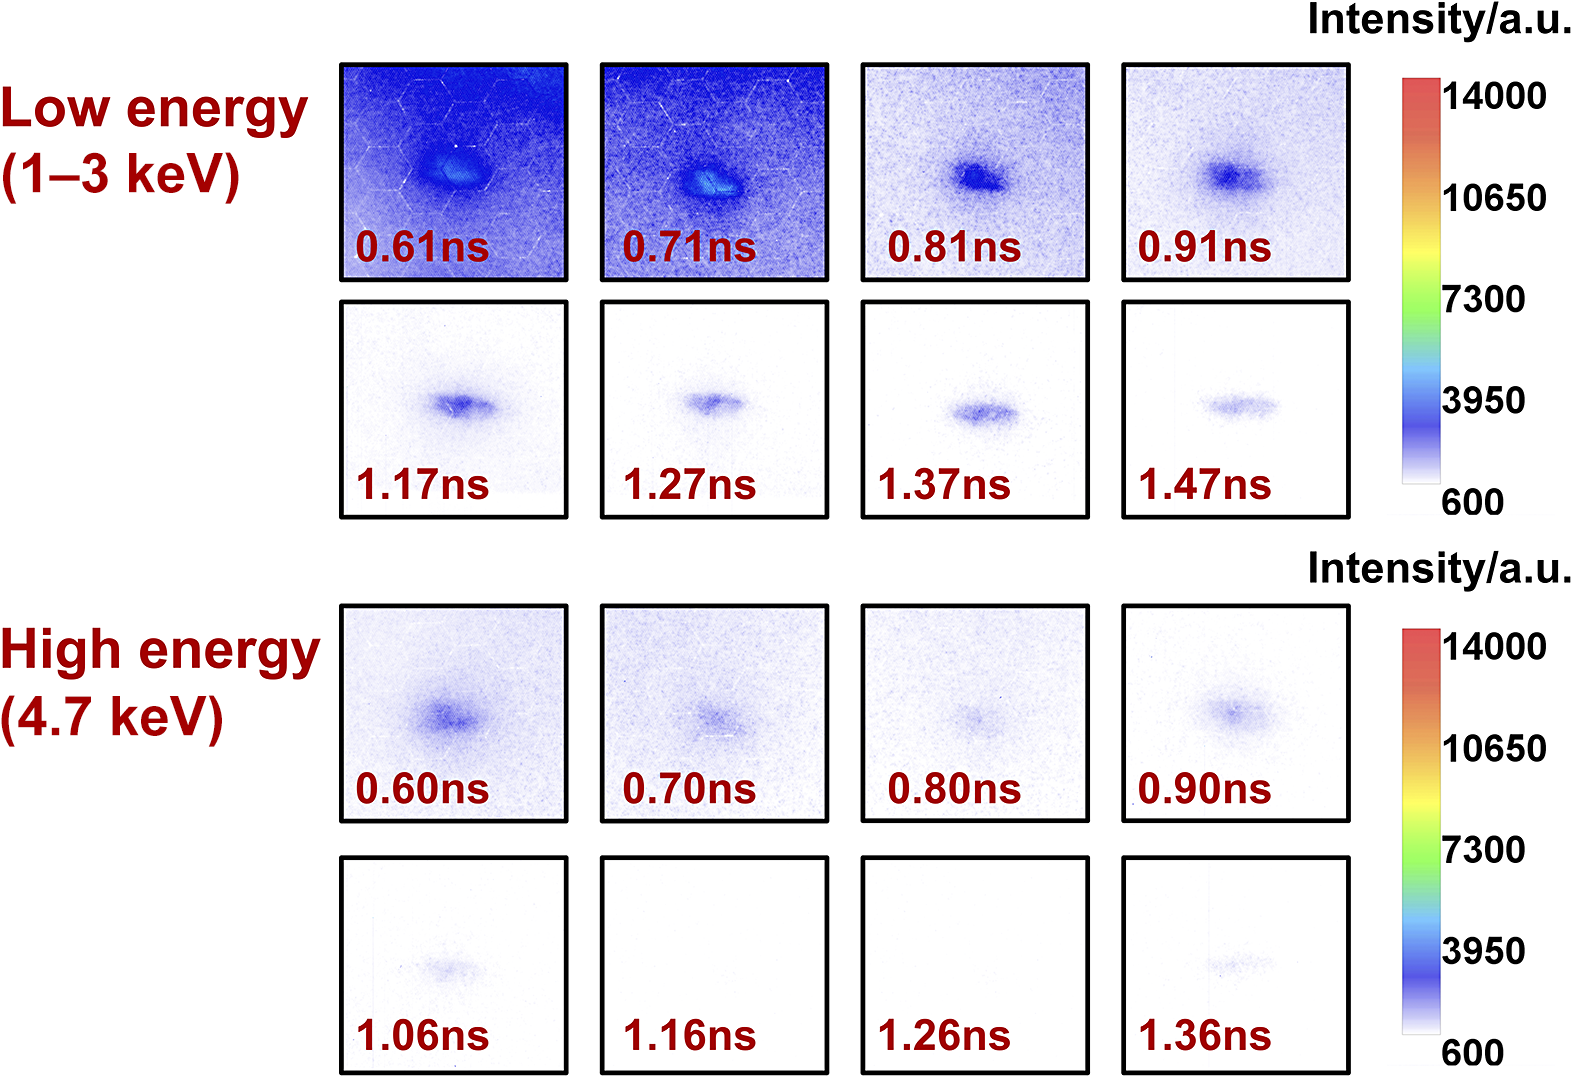
We utilized a dual-energy channel, 16-frame KB-XFC system to record X-ray emission from the collision region. By applying different coatings on the KB mirrors, the upper eight channels function as a high-energy channel with a reflectivity peak at 4.7 keV, while the lower eight channels operate in the 0.5–3 keV energy range. A beryllium (Be) filter was incorporated to attenuate radiation below 1 keV. Data from the KB-XFC system are shown in Figure 7. In each frame, the intense emission from the central region corresponds to bremsstrahlung radiation generated by the high-density plasma in the collision region at the corresponding time. By analyzing the emission count from the collision region, we determine the optimal injection time for the ps heating laser in the experiment.
Temporal evolution of X-ray emission recorded by the dual-energy-channel KB-XFC system during the double-cone collision process.

Figure 7 Long description
The multi-panel display is divided into two main sections.
Top Section: Low energy 1 to 3 K e V.
This section contains eight panels in two rows. The first row shows time steps 0.61 n s, 0.71 n s, 0.81 n s, and 0.91 n s. The second row shows 1.17 n s, 1.27 n s, 1.37 n s, and 1.47 n s. A vertical color scale on the right indicates Intensity in a. u. ranging from 600 in blue to 14000 in red. The early frames show a concentrated blue-to-purple elliptical emission core that gradually fades and elongates as time progresses.
Bottom Section: High energy 4.7 K e V.
This section also contains eight panels in two rows. The first row shows time steps 0.60 n s, 0.70 n s, 0.80 n s, and 0.90 n s. The second row shows 1.06 n s, 1.16 n s, 1.26 n s, and 1.36 n s. A matching vertical color scale on the right indicates Intensity in a. u. from 600 to 14000. Compared to the low energy channel, these frames show much lower intensity and more diffuse, smaller emission spots that dissipate rapidly by the final frame at 1.36 n s.
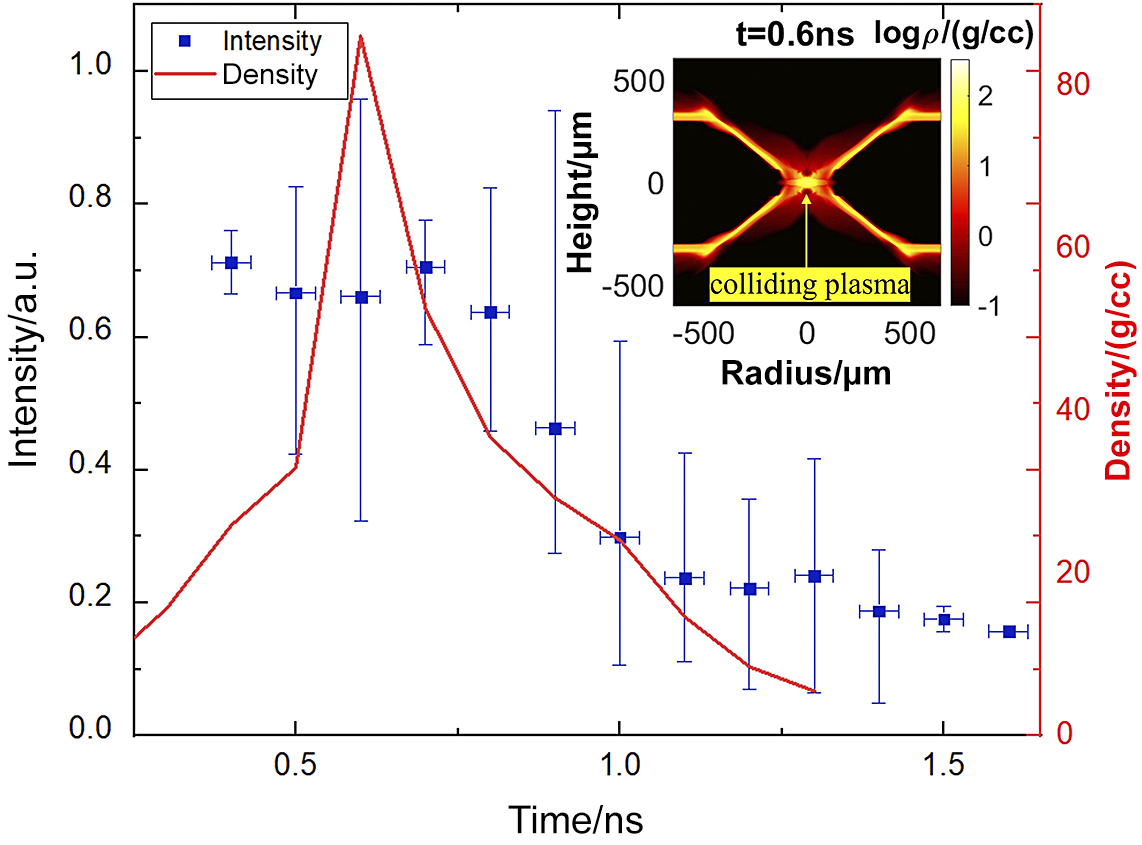
Experimentally, we employed the KB-XFC system to observe X-ray emission from the high-density plasma in the collision region. Based on the intensity recorded by the KB-XFC from the collision region, we can infer the evolutionary characteristics of the plasma. The plasma erupts from the openings of the head-on compression cones and undergoes collision, whereby kinetic energy is converted into internal energy. We infer that the peak density of the plasma in the collision region temporally coincides with the moment when the KB-XFC-recorded self-emission intensity reaches its maximum. In the DCI scheme, the injection time of the ps heating beam is synchronized with the peak density time of the collision region. Accurately determining the peak density time and the state of the plasma within the heating cone at that moment is crucial for the experiment. Under the current laser conditions and target design, the peak density time of the collision is a well-defined physical quantity. A statistical analysis of the time-resolved X-ray intensity from the collision region (Figure 8) was performed across multiple shots. The horizontal error bars represent the temporal resolution of the detector, while the vertical error bars indicate the statistical variation of the emission intensity across multiple experimental shots at corresponding times. According to the statistical results, the peak KB-XFC count occurs approximately 0.6 ns after the termination of the ns laser pulse. This timing also corresponds to the experimentally determined optimal injection time for the ps heating laser. Considering the opacity of the plasma, the radiation intensity[ Reference Atzeni and Meyer-ter-Vehn 29 ] can be expressed as follows:

Temporal evolution of the measured emission intensity from the colliding plasmas recorded by the KB-XFC system in the DCI-R9 experiment and the corresponding theoretical density evolution of the collision region plasma calculated using the MULTI-2D code. The plasma distribution at the peak density time from the MULTI-2D code is shown in the top-right panel.

Figure 8 Long description
The main plot features a horizontal x-axis representing Time in n s, ranging from 0.0 to 1.5. The left y-axis represents Intensity in arb dot units, ranging from 0.0 to 1.0. The right y-axis, colored red, represents density in g forward slash c c, ranging from 0 to 80.
Blue square data points with vertical error bars represent measured intensity. These points fluctuate between 0.6 and 0.8 intensity units until 0.7 n s, then gradually decline toward 0.2 by 1.5 n s. A solid red line represents theoretical density, which shows a sharp linear increase starting at 0.5 n s, reaching a peak of approximately 85 g forward slash c c at 0.6 n s, followed by a rapid exponential decay.
An inset heat map in the top-right shows plasma distribution at t equals 0.6 n s. The inset x-axis is Radius in micrometers from negative 500 to 500, and the y-axis is Height in micrometers from negative 500 to 500. The heat map uses a log rho scale from negative 1 to 2. It depicts four bright diagonal filaments converging at the center, labeled colliding plasma with a yellow arrow pointing to a bright white-yellow focal point at the origin.
In Equation (10),
${W}_\mathrm{b}$
 represents the bremsstrahlung power per unit volume and
$\frac{F_\mathrm{bb}S}{V}$
 represents the blackbody radiation power per unit volume. Bremsstrahlung and blackbody radiation correspond to the approximations of the radiation formulas in the optically thin and optically thick limits, respectively. These two radiation formulas can be approximated by the following:


Equation (11) describes the bremsstrahlung power density in the optically thin regime, where
${A}_\mathrm{b}=3.05\times {10}^{23}\left(\mathrm{erg}\cdot {\mathrm{cm}}^3\right)/\left({\mathrm{g}}^2\cdot \mathrm{s}\cdot {\mathrm{keV}}^{1/2}\right)$
 ,
${\rho}_\mathrm{h}$
 is the plasma density and
${T}_\mathrm{h}$
 is the plasma temperature. Equation (12) represents the blackbody radiation power density in the optically thick regime, where
${\sigma}_\mathrm{B}$
 is the Stefan–Boltzmann constant and
${l}_\mathrm{R}$
 is the Rosseland mean free path. Substituting the current experimental plasma parameters into the calculations reveals that
${W}_\mathrm{b}\gg {W}_{\mathrm{r}- \mathrm{thick}}$
 . For the DCI scheme, the time of peak plasma density in the collision region corresponds to the moment when the plasma ejected from the compression cones has fully collided, achieving the conversion of kinetic energy into internal energy. At this instant, both the density and temperature in the collision region reach their maximum values. From the perspective of bremsstrahlung radiation, this explains why the KB-XFC system observes the peak in emission brightness at the time of peak plasma density.
For the simulations, we employed MULTI-2D to calculate the temporal evolution of the density ρ in the collision region under the current laser and target parameters. In the DCI scheme, the colliding plasmas convert the kinetic energy into internal energy within the collision region. During the stagnation stage, both the plasma temperature and density reach their peak values. It is at this precise moment of maximum density that we choose to inject the ps laser. The simulation results are also plotted in Figure 8. The peak of the density occurs at approximately 0.6 ns after the termination of the ns laser pulse. This timing shows excellent agreement with both the peak emission time observed in the XFC experimental data and confirms the consistency between the simulated density peak time and the experimentally determined ps laser injection timing.
In summary, the KB-XFC system provides essential time-resolved physical information on the plasma evolution within the collision region, which is critical for determining the optimal injection timing of the ps laser into the heating cone. Both the KB-XFC diagnostics and the MULTI-2D simulation arrive at the same physical conclusion: the peak plasma density occurs approximately 0.6 ns after the main laser pulse ends.
4 Conclusions
In this work, we present the first experimental investigation of the hydrodynamic impact of implosion-driven colliding plasmas on the heating cone in the DCI scheme, with a particular focus on cone-tip survivability at the time of heating.
A key novel result of this study is the direct observation that the heating cone tip is not continuously degraded during compression, but instead is affected by a delayed shock driven by high-density colliding plasmas. This process leads to a distinct SBO signature at the cone tip, which provides a clear and experimentally accessible marker of cone integrity. By combining KB-XFC diagnostics with MULTI-2D simulations, we quantitatively determine that the peak collision density occurs at approximately 0.6 ns after the end of the ns drive, in good agreement between experiment and simulation. Beyond these specific observations, this work introduces a practical experimental framework for diagnosing and quantifying cone–plasma interactions via SBO signatures and time-resolved measurements. This methodology is directly applicable to higher energy experiments and provides a robust tool for assessing cone survivability under realistic ignition conditions.
By adjusting the insertion depth of the heating cone, we establish a timing window between the arrival of the shock at the cone tip and the injection of the ps heating pulse. This timing relationship represents a critical design constraint for DCI, as premature SBO would severely degrade fast-electron generation and energy coupling. Our results demonstrate that, for the present target design, an insertion depth of 40 μm ensures that the cone tip remains intact at the time of ps heating, while still maintaining favorable conditions for fast-electron production and transport.
Through pressure theory analysis, unlike in conventional cone-guided fast ignition where the cone is continuously exposed to high-pressure DT plasma, the heating cone in DCI experiences significant pressure only at a later stage when the colliding plasmas stagnate. This delayed loading fundamentally mitigates cone damage and provides a previously unquantified advantage of the DCI scheme.
Overall, our results provide physical insight and quantitative constraints on the coupling between compression dynamics and short-pulse heating in DCI, offering experimentally validated guidance for target design and timing optimization in future high-energy-density and ignition-relevant experiments.
Acknowledgements
We thank the staff members of the SG-II facility (https://cstr.cn/31126.02.SGIIII.HPLF)/SG-II upgrade facility (https://cstr.cn/31126.02.SGII.UP.HPLF) at the ShenGuang-II High Power Laser Facility in Shanghai (https://cstr.cn/31126.02.SGII) for providing technical support and assistance in data collection and analysis. We would like to express our thanks to the staff of the Xi’an Institute of Optics and Precision Mechanics for their help in solving the problem in the experiment. We would also like to thank the seniors for their discussion during the writing of this paper.
This work was supported by the Strategic Priority Research Program of the Chinese Academy of Sciences (Grant Nos. XDA25030100, XDA25010100, XDA25030200 and XDA25030500), the Chinese Academy of Sciences Youth Interdisciplinary Team, the National Natural Science Foundation of China (Grant Nos. 12473099 and 11873061) and the AI for Science Program, Shanghai Municipal Commission of Economy and Informatization (Grant No. 2025-GZL-RGZN-BTBX-02024).

 Open access

