


Introduction
The Bering Sea has the largest continental shelf area in the world apart from the Arctic Ocean, and supports the largest commercial fishery. In addition, portions of the shelf are scheduled for intensive oil exploration, and the region is a thoroughfare for barge traffic for the western Arctic. Since the Bering Sea supports a seasonal sea-ice cover from late October to late June, it is important for safety and economy that sea-ice forecasts be improved for the area. Although we are developing a full regional model with both dynamical and thermodynamic sea-ice calculations, in this paper we present only a simple candidate model for the advection of ice. This model is an extension to the coupled ice/ocean models of Reference Reed and CampbellReed and Campbell (1962) and Reference Neralla, Liu, Venkatesh and DanardNeralla and others (1980). This simple scheme may be useful for climate research models desiring an interactive ice cover.
Model Description
In the Bering Sea during winter away from land, sea-ice floes are generally drifting freely in response to the wind. Currents away from straits and the shelf break are relatively weak. Consequently a good first-guess model for ice velocity can be derived from the free-drift approximation, i.e. for individual Lagrangian elements, for the stress balance on sea ice,

where
 A and
W are the tangential surface stresses at the air and water interfaces, i2 = −1, ρI is the density of the ice, HI is the thickness of the ice, f is the Coriolis parameter, and
 I is the ice velocity. We assume that the surface stresses can be parameterized by quadratic drag laws

and

where ρA and ρW are air and water densities, CA and CW are empirically determined drag coefficients and
A and
W are the Eulerian wind and wind-driven current. We consider CA and
A relative to the reference level at 10 m and CW and
W relative to the reference level (hW) at 2 m. Note that
A –
I and
W –
I are the Lagrangian velocities that would be measured by instruments attached to an ice floe at those levels.
Given that we can estimate the other variables,
I and
W are the unknowns, so we need an additional relation to close the system of equations. We establish another expression for
W and
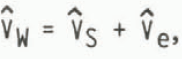
W by modeling the ocean with a constant stress surface layer with a linearly increasing eddy coefficient and logarithmic velocity profile to a depth h and then an Ekman layer for an infinitely deep ocean. Let
where the surface-layer contribution to the velocity is

and where the Reference EkmanEkman (1905) velocity at depth h is

In Equation (5),
 * is the friction velocity defined by

k = 0.4 is Von Karman’s constant, and zW is the roughness length for the bottom of the ice defined by

In Equation (6), D is the Ekman depth approximated by

where A is the scaling factor of 0.3 (Reference Blackadar and TennekesBlackadar and Tennekes 1968). To specify the depth of the surface layer h, we use h = δD where δ = 0.1 (Reference McPhee and SmithMcPhee and Smith 1976). A schematic of the modeled ocean relative to the ice and the bottom is given in Figure 1.
Schematic diagram of the modeled ocean relative to the ice and the sea bottom.

By making appropriate substitutions and rearranging terms, the Equations (1) through (9) can be reduced to Equation (7) and

and

The three unknowns in (7), (10), and (11) are
W,
*, and
I, and the solution for the coupled nonlinear system can be obtained by iterating on
W. A first-guess
 , and the iterative closure criterion is
W –
W (old guess) /
W < ε. For ε = 10−5, closure occurs in 5 to 7 iterations.
Model Sensitivity
The model was run for a range of variables to test the sensitivity for future forecasting applications. A list of the model parameters used for a standard or reference case are given in Table I.
Values for Model Variables for Standard Case

Although most of the unridged ice in the Bering Sea has a thickness of 1 m or less, it is helpful to examine the response to a range of thicknesses (Fig.2) both to facilitate comparison with other models and to evaluate its probable performance for other oceans. The modeled ice velocity varied linearly with changes in thickness. Speed decreased by 0.05 m s−1 for each 0.3 m increase in thickness and rotation of the ice motion to the right of the wind stress a increased 1.5° for each 0.3 m increase in thickness. As expected, water velocities had the same trends as ice velocities. These results agree with Reference McPheeMcPhee (1982).
Variations in ice velocity for a range of thicknesses of sea ice and for two different assumptions for the Ekman depth-scaling parameter A.

In Figure 2 we also show the effect of variation of the Ekman scaling parameter A. The range for A in the literature is 0.3 to 0.4. For ice 1 m thick, the modeled ice speeds differed by 0.07 m s−1 and 4°. The larger the Ekman depth for a given applied stress, the slower the ice drifted and the less 1t rotated to the right of the wind.
Figures 3 and 4 show the results for varying the drag coefficients. The sea ice in the Bering Sea is rough aerodynamically because of the existence of many small roughness elements. Measurements for the area suggest that CA = 2.8 x 10⁻³ and Cw = 16 x 10−3 in the interior and both are proportionately higher in the marginal ice zone (Reference MacklinMacklin 1983, Reference Pease, Salo and OverlandPease and others 1983, Reference Walter, Overland and GilmerWalter and others in press). Generally, if Cw is increased by 5 x 10⁻³ for constant CA, the predicted ice speed drops by about 0.05 m s−1, but α increases only slightly. If CA is increased by 1.0 x 10⁻³ for constant Cw, then the predicted ice speed increases by 0.10 m s−1 and α decreases slightly. If CA and CW, vary proportionally, due in some sense to isostatic equilibrium, then these results show that increased total roughness causes an increased ice speed but little change in angle, even though the drag on the water increases also.
Variations in ice velocity for a constant air-ice drag coefficient but varying ice-water drag coefficient for two ice thicknesses.

As in Figure 3, except varying the air-ice drag coefficient.

We need to examine the model dependence on wind speed so that we can evaluate the impact of errors in wind velocity on the estimates of ice velocity. Figure 5 shows speed and rotation angle for a range of wind speeds for floes that are 1 and 3 m thick. The rotation angle is sensitive to changes in wind speed for moderate to light winds. This effect is enhanced for the thicker ice. Variations in speed are nearly linear for thin ice, but nonlinear for low wind speeds for thicker ice. Instances where the wind velocity is low are difficult to evaluate with field data because unmodeled physics, such as small steady currents, tidal and high-frequency accelerations, and sea-surface tilts, become important.
Variations in ice velocity for a range of wind velocities for two ice thicknesses.

Case Study
An experiment was conducted near the ice edge during 1981 in which a floe was instrumented with anemometers, current meters, and an ARGOS satellite position transponder. Additional details about the experiment can be obtained from Reference MacklinMacklin (1983) and Reference Pease, Salo and OverlandPease and others (1983). The measurements were averaged to hourly data for a total of 65 samples. The ARGOS positions were fitted with a cubic spline and resampled for the same period, and ice velocities were calculated by central-differencing the resampled positions. In order to remove the tidal signal from this short record, we fitted a broad quadratic to the series to mimic the longer period change in the velocity. In a follow-up experiment in 1983, we took longer time-series measurements which will allow us to perform additional validation studies with ice velocities which have had tidal signals removed by more conventional means.
The wind blew from the north-east and ice drift was toward the west-south-west throughout the 1981 measurements. The maximum wind and floe velocities were mid-period. The range of wind speeds was 6 to 12 m s−1 and averaged 10.4 m s−1 (SD = 2 m s−1). The ice was approximately 1 m thick; A, CA and CW for the model run were set to the values listed in Table I. The results of the model run compared to the observed velocities are given in Table II.
Observed and Modeled Ice and Water Velocities

The model overestimated current velocity uniformly and underestimated the current angle, but the correlations with ice velocity were excellent. Thus we have an overall bias in current velocity which may be due to A, CW, or unmodeled physics. This bias will be considered more fully in future work.
Summary
The candidate model for sea-ice drift described in this brief article is intended to be applied to sea-ice forecasting and climate problems in the Bering Sea. Its strengths include that (1) it does not require a priori knowledge of currents other than that they are largely wind-driven, (2) its calculation time is sufficiently short that it is economical to run, and (3) it contains the firstorder ice physics necessary to predict ice motion over an open continental shelf. Its weaknesses include that (1) it is somewhat sensitive to certain empirical parameters such as the Ekman depth scaling, drag coefficients, and ice thickness, (2) it does not contain sufficient ice physics to be useful near land where internal ice stress may be important, and (3) it does not contain sufficient ocean physics to be useful for very shallow water or for regions where currents that are not wind-driven are important. Overall, the performance of this drift model in sensitivity studies and in comparisons to field data is encouraging for forecasting applications.



