Introduction
In the most extreme arid environments, photosynthesis becomes restricted to communities within and below translucent rocks (e.g. Friedmann Reference Friedmann1982, Warren-Rhodes et al. Reference Warren-Rhodes, Rhodes, Pointing, Ewing, Lacap and Gomez-Silva2006, Wierzchos et al. Reference Wierzchos, Ascaso and McKay2006, Cockell & Osinski Reference Cockell and Osinski2007, Pointing & Belnap Reference Pointing and Belnap2012, Archer et al. Reference Archer, de los Ríos, Lee, Niederberger, Cary and Coyne2017, Qu et al. Reference Qu, Omelon, Oren, Meslier, Cowan, Maggs-Kölling and DiRuggiero2020), known as endolithic and hypolithic colonization, respectively. Endolithic and hypolithic communities have been used as analogues for the possible final stages of life on Mars under increasing aridity (McKay Reference McKay1986, McKay et al. Reference McKay, Friedman, Wharton and Davies1992, Davila & Schulze-Makuch Reference Davila and Schulze-Makuch2016). Endolithic analogues are of particular interest because of the preservation potential of biogenic organic material held within the porous rock (e.g. Knoll et al. Reference Knoll, Golubic, Green and Swett1986).
Sandstones found at high elevations in the Dry Valleys of Antarctica contain photosynthetic communities of algae, lichens and bacteria residing a few millimetres below the surface, but without surface manifestation. These are known as cryptoendoliths (Friedmann Reference Friedmann1982, Wierzchos & Ascaso Reference Wierzchos and Ascaso2001, Archer et al. Reference Archer, de los Ríos, Lee, Niederberger, Cary and Coyne2017). This community is commonly used as a terrestrial model for life on Mars because of the cold and dry conditions in the high elevations (> 1500 m) of the Dry Valleys. Air temperatures at this altitude do not rise above freezing. However, the surface of the sandstones within which the cryptoendolithic organisms are found is warmed by sunlight to temperatures up to 15°C above air temperature (Friedmann Reference Friedmann1982, Friedmann et al. Reference Friedmann, Kappen, Meyer and Nienow1993). Typically, thin summer snowfalls produce melt as the rock warms, allowing meltwater to percolate into the porous sandstone (Friedmann et al. Reference Friedmann, Kappen, Meyer and Nienow1993, Sun Reference Sun2013).
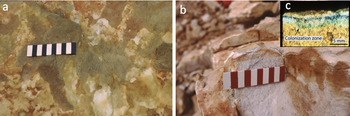
The cryptoendolithic community begins a few millimetres below the surface of the rock and extends downwards for ~1 cm (Fig. 1). Studies of the transmission of sunlight into the rock have shown that at the depth of the microbial community, ultraviolet (UV) and blue light is strongly attenuated and that the transmissivity increases into the red and near-infrared (McKay Reference McKay2012). At 0.35 μm, the transmissivity is a factor of ~300 less than in the 1.30 μm spectral region (McKay Reference McKay2012). To shield from the cold and dry surface conditions, the organisms are located as deep into the porous rock as they can be and still receive enough light to photosynthesize. Colonization on the surface is not visible to the eye; subsurface colonization is more likely detected by reflected light in the infrared. Hand et al. (Reference Hand, Carlson, Sun, Anderson, Wadsworth and Levy2005) reported on field spectra of Antarctic sandstones at Battleship Promontory containing colonized layers using mid-infrared spectroscopy (2.6–15.0 μm), and while they were able to detect surface organics, they concluded that none of the absorption peaks that could indicate subsurface life rose above noise level. The transmissivity of the rock layers at wavelengths > 2.4 μm has not been reported.
Colonized sandstone at Linnaeus Terrace, Antarctica. Panel a. shows a surface view of a sandstone outcrop (scale bar with 1 cm markings). Panel b. shows a view of a cleaved edge (scale bar with 1 cm markings). Inset c. shows a close-up of a particularly cryptoendolith-rich sample illustrating the depth of colonization into the rock. (All images courtesy of Imre Friedmann.)

Russell et al. (Reference Russell, Edwards and Wynn-Williams1998) conducted Raman spectroscopy of the profile to 10 mm depth of colonized Antarctic sandstone from Battleship Promontory exposed by vertically fracturing the rock. Although not addressing the question of detection through the unaltered rock surface, this analysis provides insight into the pigmentation and layering of the biological material with depth. Cyanobacteria were detected by phycocyanin autofluorescence under green light. Within the colonized zone, individual organic compounds could not be identified unambiguously, but comparison with Raman spectral libraries led Russell et al. (Reference Russell, Edwards and Wynn-Williams1998) to identify spectral features due to carotenoids, C-O-C in cellulose moieties, CH2 skeletal backbones of aliphatic organic compounds, ring stretching of aromatic compounds and C-OH groups. In the same set of Battleship Promontory samples, Wynn-Williams et al. (Reference Wynn-Williams, Edwards and Garcia-Pichel1999) used Raman spectroscopy to detect scytonemin, a dark pigment that protects against UV photodamage, and its distribution in the upper layers of the community.
The pigmentation and spectral response of endoliths have been studied in other locations and in other porous rocks. Horath et al. (Reference Horath, Neu and Bachofen2006) used reflectance spectroscopy to detect the pigments in a community of endolithic microorganisms dominated by phototrophs in a distinct band a few millimetres below the surface of dolomite rocks. They reported chlorophyll a, phycobilins, carotenoids and an unknown type of bacteriochlorophyll-like pigment absorbing at 720 nm. Vítek et al. (Reference Vítek, Ascaso, Artieda, Casero and Wierzchos2017) reported the spectroscopic analysis of a cryptoendolithic cyanobacterial colonization in porous ignimbrite samples from a high-elevation volcanic site in the Atacama Desert. Carotenoid increased close to the rock surface, consistent with a role in photoprotection. Scytonemin was also detected in the uppermost layers, while phycobiliproteins increased in the deeper layers, consistent with a role in light harvesting at low light levels. In Tunisia, gypsum, which can host endoliths in arid environments, was reported to contain carotenoids and chlorophyll a, detected by high-performance liquid chromatography (Stivaletta et al. Reference Stivaletta, Lopez-Garcia, Boihem, Millie and Barbieri2010).
The ability to use spectroscopic detection to observe cryptoendolithic communities without altering the rock may be beneficial. Typically, colonization is detected by chipping the surface with a rock hammer. Non-destructive detection may offer some advantages, particularly if the sample is to be further studied and damage is not desired. However, for a rover on the surface of Mars, spectroscopic detection is even more strongly preferred due to the difficulty of obtaining and handling samples. Indeed, the instruments on board the Mars 2020 rover mission that will be used for in situ investigations are all non-contact instruments (e.g. Raman spectroscopy, UV fluorescence and laser-induced breakdown spectroscopy) (Williford et al. Reference Williford, Farley, Stack, Allwood, Beaty, Beegle, Cabrol and Grin2018).
In this paper, we report on laboratory experiments to determine the signature of reflected sunlight and fluorescence due to colonization within an Antarctic sandstone. We also examine samples before and after a long period of dry storage, because it is known that the photosynthetic organisms present in Antarctic sandstone can remain dormant and viable for decades or longer when in a dry state (Caiola et al. Reference Caiola, Billi and Friedmann1996).
Methods
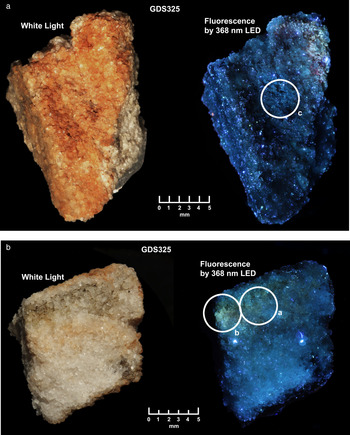
A small sample of loose Beacon Sandstone several centimetres thick was collected from Linnaeus Terrace (Asgard Range; 161°04′29″E, 77°35′50″S, elevation 1600–1650 m) (Fig. 2). Analysis, detailed below, was done of the surface, bottom and a cleaved section exposing the interior of the sample. This sample was assigned the catalogue number GDS325 for spectral measurement purposes. Ocean Optics Flame spectrometer reflectance measurements were done over the 0.20–0.82 μm range with a bandwidth full width at half-maximum (FWHM) of 1.5 nm. The sample was illuminated with a combined deuterium + tungsten lamp using a diffuse aluminium reference calibrated using Labsphere Spectralon® and corrected to absolute reflectance using a National Institute of Standards and Technology traceable Spectralon® correction from the US Geological Survey (USGS) spectral library (Kokaly et al. Reference Kokaly, Clark, Swayze, Livo, Hoefen and Benzel2017). ASD Classic FR spectrometer measurements were taken over the 0.35–2.50 μm range with variable resolution from 3 to 8 nm in the visual and near infrared region and from 11 to 12 nm in the short-wave infrared region using a tungsten lamp (see fig. 1a in Kokaly et al. Reference Kokaly, Clark, Swayze, Livo, Hoefen and Benzel2017). Spectra were corrected to absolute reflectance using the same Spectralon® correction from Kokaly et al. (Reference Kokaly, Clark, Swayze, Livo, Hoefen and Benzel2017). Ocean Optics and ASD spectra were then spliced between 0.36 and 0.46 μm to match reflectance levels. Nicolet 6700 Fourier-transform infrared spectrometer measurements were taken from 2 to 15 μm at 4 cm-1 resolution (see fig. 1b in Kokaly et al. Reference Kokaly, Clark, Swayze, Livo, Hoefen and Benzel2017) relative to a stainless steel mirror using a modified Spectrotech® bi-conical reflectance attachment and internal tungsten lamp. Nicolet spectra were then scaled and spliced near 2.46 μm to match the reflectance level of the ASD spectra according to the method described in Kokaly et al. (Reference Kokaly, Clark, Swayze, Livo, Hoefen and Benzel2017). The 2.2 μm band was further analysed with an expert system spectral interpretation system: Tetracorder (Clark et al. Reference Clark, Swayze, Livo, Kokaly, Sutley and Dalton2003). The ASD and Nicolet measurements were done in 2001 on the sample GDS325 collected in 1995. In 2020, the same sample (GDS325) was measured again using the Ocean Optics Flame spectrometer. The sample remained in a sealed clear glass bottle in the USGS spectroscopy laboratory between measurements.
a. A piece of Beacon Sandstone (top surface) that was analysed in reflectance and fluorescence. Shown are white light (left) and in fluorescence induced by a 368 nm light-emitting diode (LED; right). The white circle encompasses the area measured with the Ocean Optics Flame spectrometer. b. Same sample as in panel a., except showing a broken side with a chlorophyll-rich layer seen as dark in the white light image (left) and as greenish in fluorescence (right). The white circles encompass areas measured with the Ocean Optics Flame spectrometer.

Fluorescence spectra were measured using the same Ocean Optics Flame spectrometer used for the reflectance measurements discussed above. The sample was illuminated by a 368 nm light-emitting diode (LED) with a FWHM of 10.6 nm. A Tiffen Haze 1 filter was used in front of the spectrometer optical fibre. The Tiffen filter has strong absorption at wavelengths < 400 nm, preventing the strong LED intensity from contaminating longer wavelengths due to scattering within the spectrometer. The filter, however, transmits a small amount of light at 368 nm (i.e. 0.187%), allowing the LED intensity to be measured at the same time as the fluorescence signal. The resulting spectra were corrected by removing the instrument response function and, along with the reflectance measured on the sample, the fluorescence efficiency relative to the incident light intensity was derived.
Results
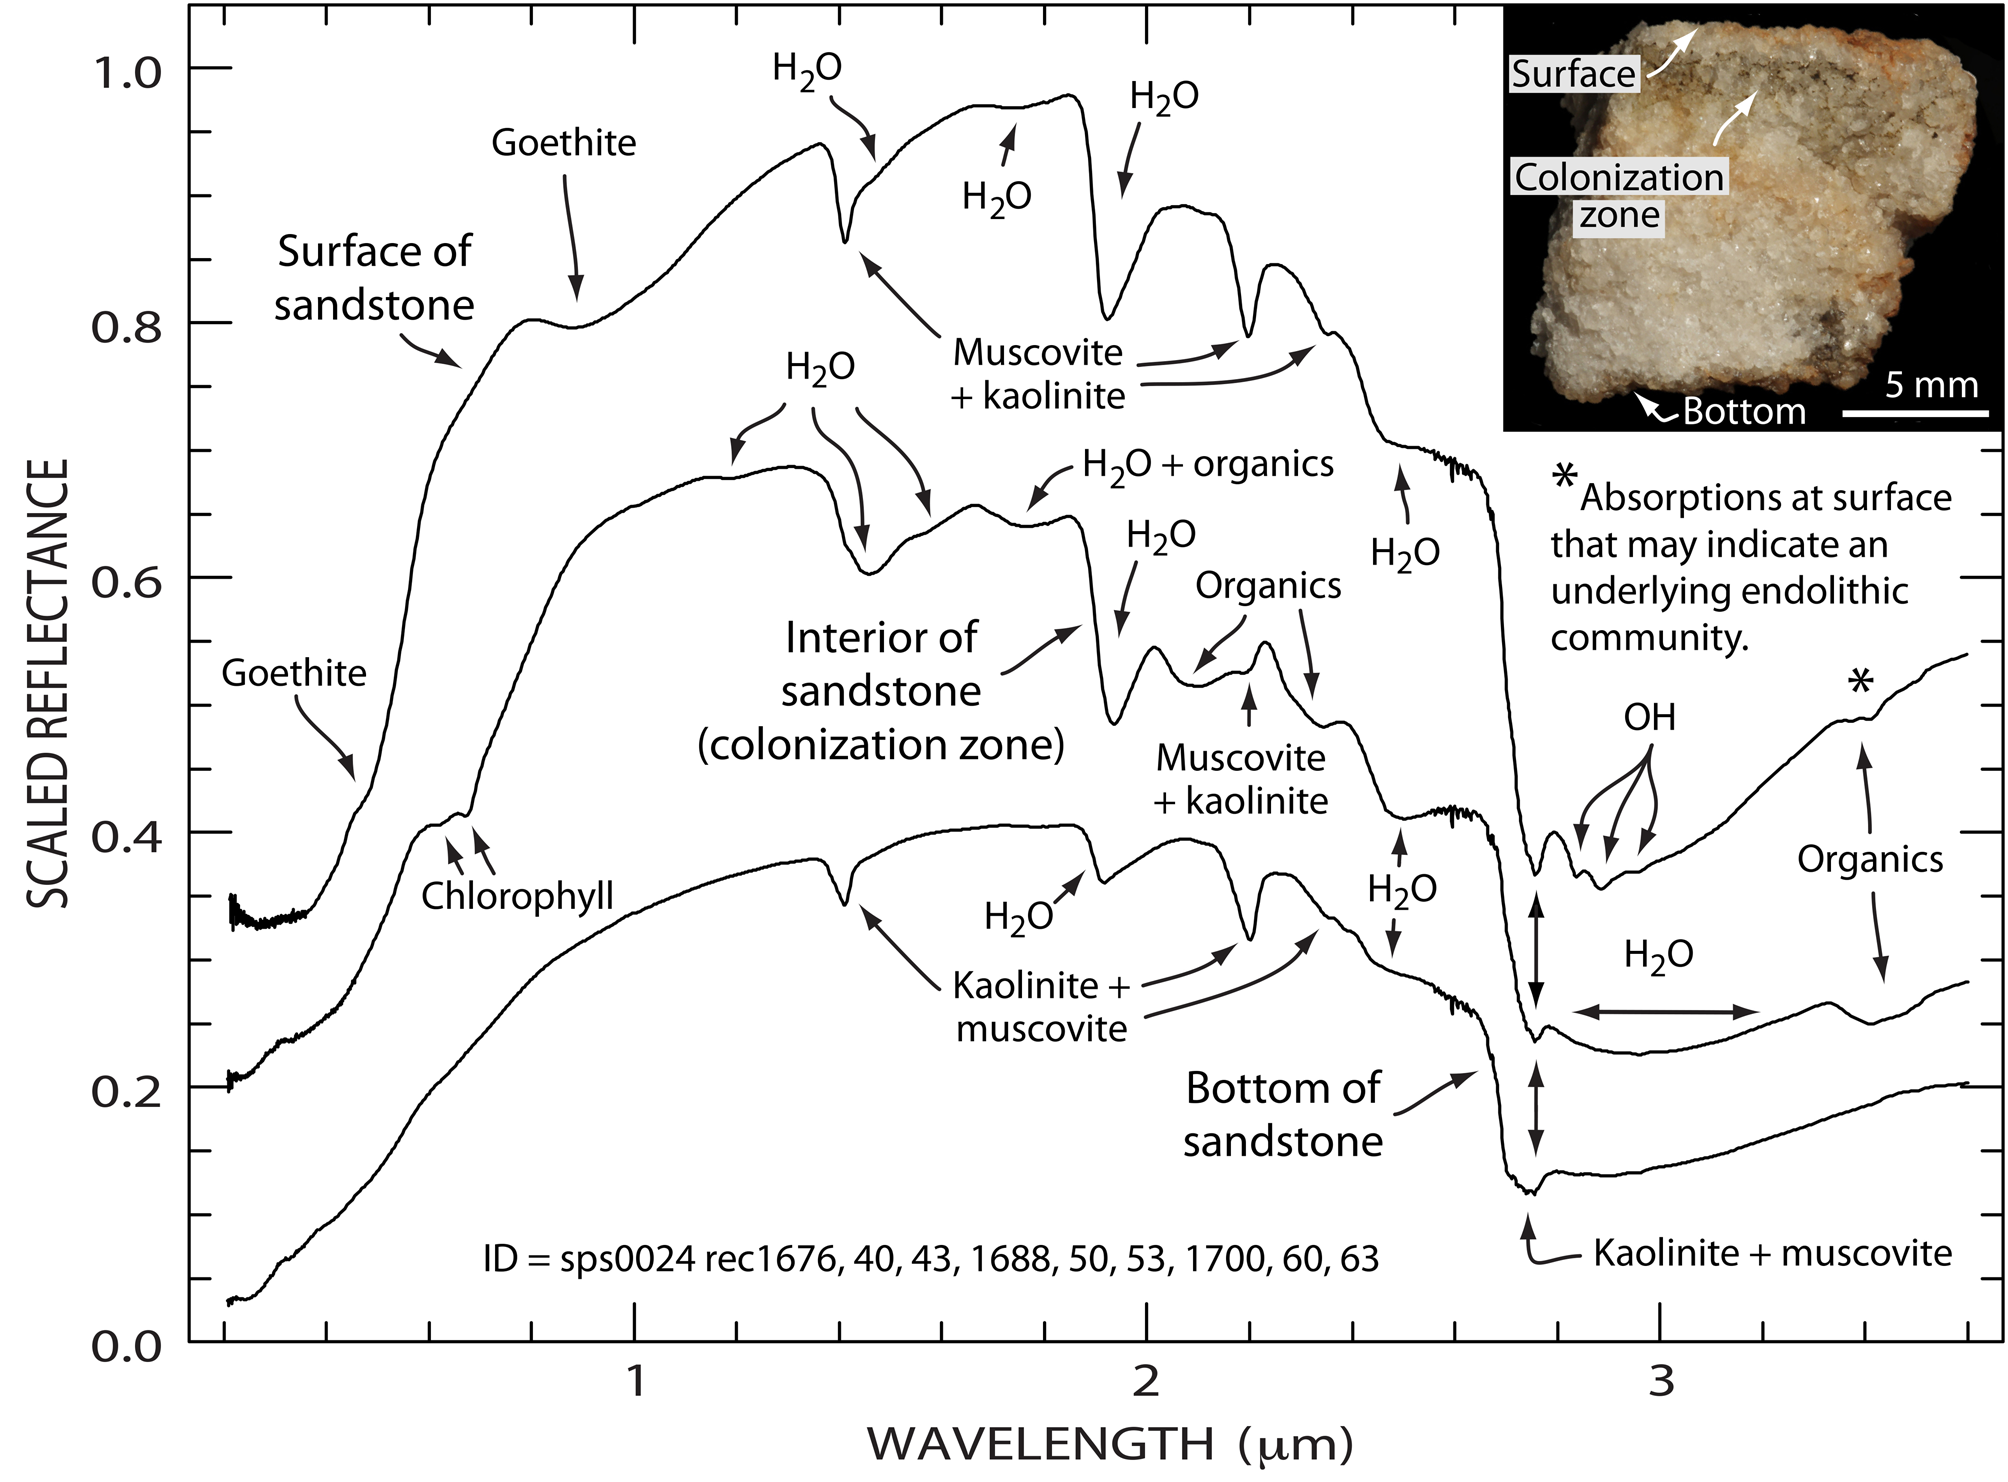
Reflectance spectra (Fig. 3) were obtained from the surface, the bottom and the exposed colonization zone (on the cleaved side of the rock ~1.4 mm below the rock surface) using three spectrometers to allow coverage of the wavelength range of interest. Chlorophyll absorption bands are present near 0.65 μm in the spectra of the colonization zone, but not in the spectra of the sample's top or bottom surfaces. Broad weak electronic absorptions attributed to goethite are present in the spectrum of the sample surface. The chlorophyll band depths changed by < 4% over the 19 years between measurements, which is not a significant change considering the uncertainty of the spot size in the two measurements. Absorption features associated with water and several features indicative of the mineralogy of Beacon Sandstone (i.e. goethite, kaolinite and muscovite) are also seen. However, the colonized zone is spectrally dominated by several vibrational absorptions due to its organic components. Weak bands near 1.60 and 2.10 μm correspond to the N-H stretch overtone and combination absorptions, while the 1.76 and 2.30 μm bands correspond to the C-H stretch overtone and combination absorptions. Given the relatively weak nature of the 3.41 μm C-H fundamentals, their overtones near 1.76 um are expected to be an order of magnitude weaker, suggesting that water may contribute more to the overall depth of this feature than C-H. Of these, only the 3.41 μm C-H fundamental absorptions were detected in the spectra of the sample surface. We note that diagnosing the 3.41 μm organic absorption would be more difficult if carbonates were present because they have absorptions near the same wavelength.
Reflectance spectra of a cryptoendolith-bearing sample of the Beacon Sandstone (GDS325) shown in Fig. 2. Spectra, from 0.2 to 3.6 μm, are of the weathered surface, the chlorophyll-rich colonized layer 1.4 mm below the surface and the bottom of the sample. Measurements from three spectrometers were spliced to make these composite spectra. Spectral features from chlorophyll, goethite, muscovite, organic material and water are labelled. The fine structure near 2.6 μm is due to residual water vapour present in the instrument. The top and middle composite spectra are offset vertically by 0.25 and 0.15 reflectance units, respectively. ID = spectrum reference numbers.

Sharp absorptions between 2.7 and 3.0 μm seen in Fig. 3 are due to OH fundamental stretch vibrations. Tetracorder analysis of the 2.2 μm band indicates that it is due to OH combination absorptions from a muscovite-kaolinite mixture. The 2.7 μm absorption is probably also due to a mixture of muscovite and kaolinite in variable proportions, with more kaolinite in the spectrum of the sample bottom. Other sharp OH absorptions between 2.8 and 3.0 μm are unidentified and further research is necessary to establish their origin.
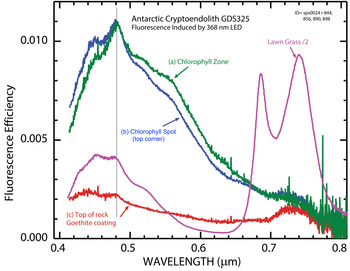
The observed fluorescence images (Fig. 2) and spectra (Fig. 4) show broad blue-green fluorescence with ~1% efficiency with a peak near 0.48 μm. As expected, peaks in the blue portion of the spectrum match similar peaks observed in fluorescence spectra of chlorophyll-rich grass (Poa pratensis, Kentucky bluegrass). However, the cryptoendolith sample lacks the 0.68 and 0.74 μm peaks seen in the spectra of the grass. The top surface of the rock sample shows weak fluorescence of ~0.25% efficiency, presumably due to light penetrating into the subsurface through pores and/or cracks in the goethite coating the sample's surface. Thus, for Mars, fluorescence could be observed in the field both through some coatings and in rock surfaces exposed by erosion or meteor impacts.
Fluorescence spectra of the Beacon Sandstone sample GDS 325. The spectra labelled (a), (b) and (c) correspond to the circled areas in Fig. 2. The data for lawn grass have been reduced by a factor of two for comparison purposes. LED = light-emitting diode.

Discussion
Gale crater on Mars provides an interesting site for the application of the results presented above. Gale crater is an impact crater that formed on Mars ca. 3.5 Gyr ago and contained a lake with habitable conditions that probably existed intermittently for thousands to millions of years (Cabrol et al. Reference Cabrol, Grin, Newsom, Landheim and McKay1999, Grotzinger et al. Reference Grotzinger, Gupta, Malin, Rubin, Schieber and Siebach2015). Within Gale crater, the Curiosity rover has found sandstones and mudstones both indicating past fluid activity. Elemental analysis of the sandstones indicates that they are enriched in silica from weathering compared to the parent rocks that were the source of the sand (Yen et al. Reference Yen, Ming, Vaniman, Gellert, Blake and Morris2017). Images of a Martian sandstone indicate that most of the detectable grains are ~80 μm and elemental analysis indicates ~40% SiO2 (Treiman et al. Reference Treiman, Bish, Vaniman, Chipera, Blake and Ming2016). This relatively high SiO2 content compared to Martian volcanic basalts is consistent with mineralogical analysis that indicates that alkali feldspars compose ~28% by mass of the crystalline material (Treiman et al. Reference Treiman, Bish, Vaniman, Chipera, Blake and Ming2016). Colonization by photosynthetic cyanobacteria occurs under feldspar rocks in Antarctica (Soina et al. Reference Soina, Mergelov, Kudinova, Lysak, Demkina and Vorobyova2018).
As suggested by McKay (Reference McKay, Friedman, Wharton and Davies1992), endolithic colonization on Mars may have persisted after water supplies were insufficient to support lakes and only transient water flows or snowfalls were present. For an extended period of time, the conditions on Mars and in Gale crater may have resembled the climate conditions in the high elevations of the Dry Valleys (McKay & Davis Reference McKay and Davis1991). Eventually, the decline of water availability would have ended endolithic growth, but the organic material within the colonized zones could have persisted over significant time periods. Friedmann and Weed (Reference Friedmann and Weed1987) reported on the presence of fossil cryptoendoliths in Antarctica with ages up to a few million years. They identified the rocks that contained fossilized cryptoendoliths based on the distinctive pattern of surface colouration of the rock as altered by the microbial community and did not investigate organic preservation. However, Russell et al. (Reference Russell, Edwards and Wynn-Williams1998) followed up on the work of Friedmann and Weed (Reference Friedmann and Weed1987) and reported that these ‘fossil’ endoliths could be detected as traces of organic matter with Raman spectroscopy at the depth expected for colonization. Wierzchos et al. (Reference Wierzchos, Sancho and Ascaso2005) showed that these microbial fossils included mineralized but distinguishable cell wall structures.
While the study reported here focused on Antarctic sandstones with photosynthetic organisms, the approach used might enable the detection of cryptoendolithic communities of any variety. It would be interesting to apply this approach to the unaltered surfaces of the various endolith systems discussed above; for example, in gypsum (Stivaletta et al. Reference Stivaletta, Lopez-Garcia, Boihem, Millie and Barbieri2010), halite (Wierzchos et al. Reference Wierzchos, Ascaso and McKay2006), dolomite (Horath et al. Reference Horath, Neu and Bachofen2006) and ignimbrite (Vítek et al. Reference Vítek, Ascaso, Artieda, Casero and Wierzchos2017). In some of these substrates, the penetration of visible and infrared light might be greater than in the Beacon Sandstone.
Organic preservation in rock interiors and detection of organic vibrational and fluorescence spectral signatures on Martian sandstone surfaces would be of considerable significance given the low levels of organics on that planet. One scenario for future exploration could be as follows: at night, the scene could be illuminated by UV LEDs while a colour camera takes images of the scene. Different exposure times of tens of seconds up to a few minutes could then be used to detect weak fluorescence signals. Next, candidate fluorescence emissions could be targeted by a point spectrometer with a small telescope/telephoto lens to measure the 0.4–0.8 μm fluorescence signal. Following this, a spectral library of candidate organic materials and fluorescing minerals could be used to identify, or at least narrow, the compositional possibilities used to target locations for infrared spectroscopy (using an infrared light source or the sun after the sun rises). Based on the results, this could lead to further in situ analyses and sample selection for return to Earth.
Acknowledgements
We thank the reviewers from the journal and reviewers at the US Geological Survey (USGS) and NASA for constructive comments that greatly improved this paper. This paper is dedicated to the late Imre Friedmann, who discovered the cryptoendolithic microorganisms in the Antarctic Dry Valleys and pioneered fieldwork at Linnaeus Terrace.
Financial support
Field samples were collected as part of a project supported by the US National Science Foundation grant OPP 91-18730 to E.I. Friedmann. CPM acknowledges support from the NASA Astrobiology Program. The USGS Spectral Library and Remote Sensing Projects and the NASA programme W15805 (RNC, Principle Investigator) also provided support. Fluorescence and ultraviolet reflectance were measured in RNC's Planetary Science Institute laboratory.
Competing interests
The authors declare no competing interests.
Disclaimer
Any use of trade, firm or product names in this publication is for descriptive purposes only and does not imply endorsement by the US Government.
Author contributions
GAS and CPM conceived of the investigation. GAS and RNC performed the spectroscopy. All authors contributed to the analysis and writing of the paper.