Introduction
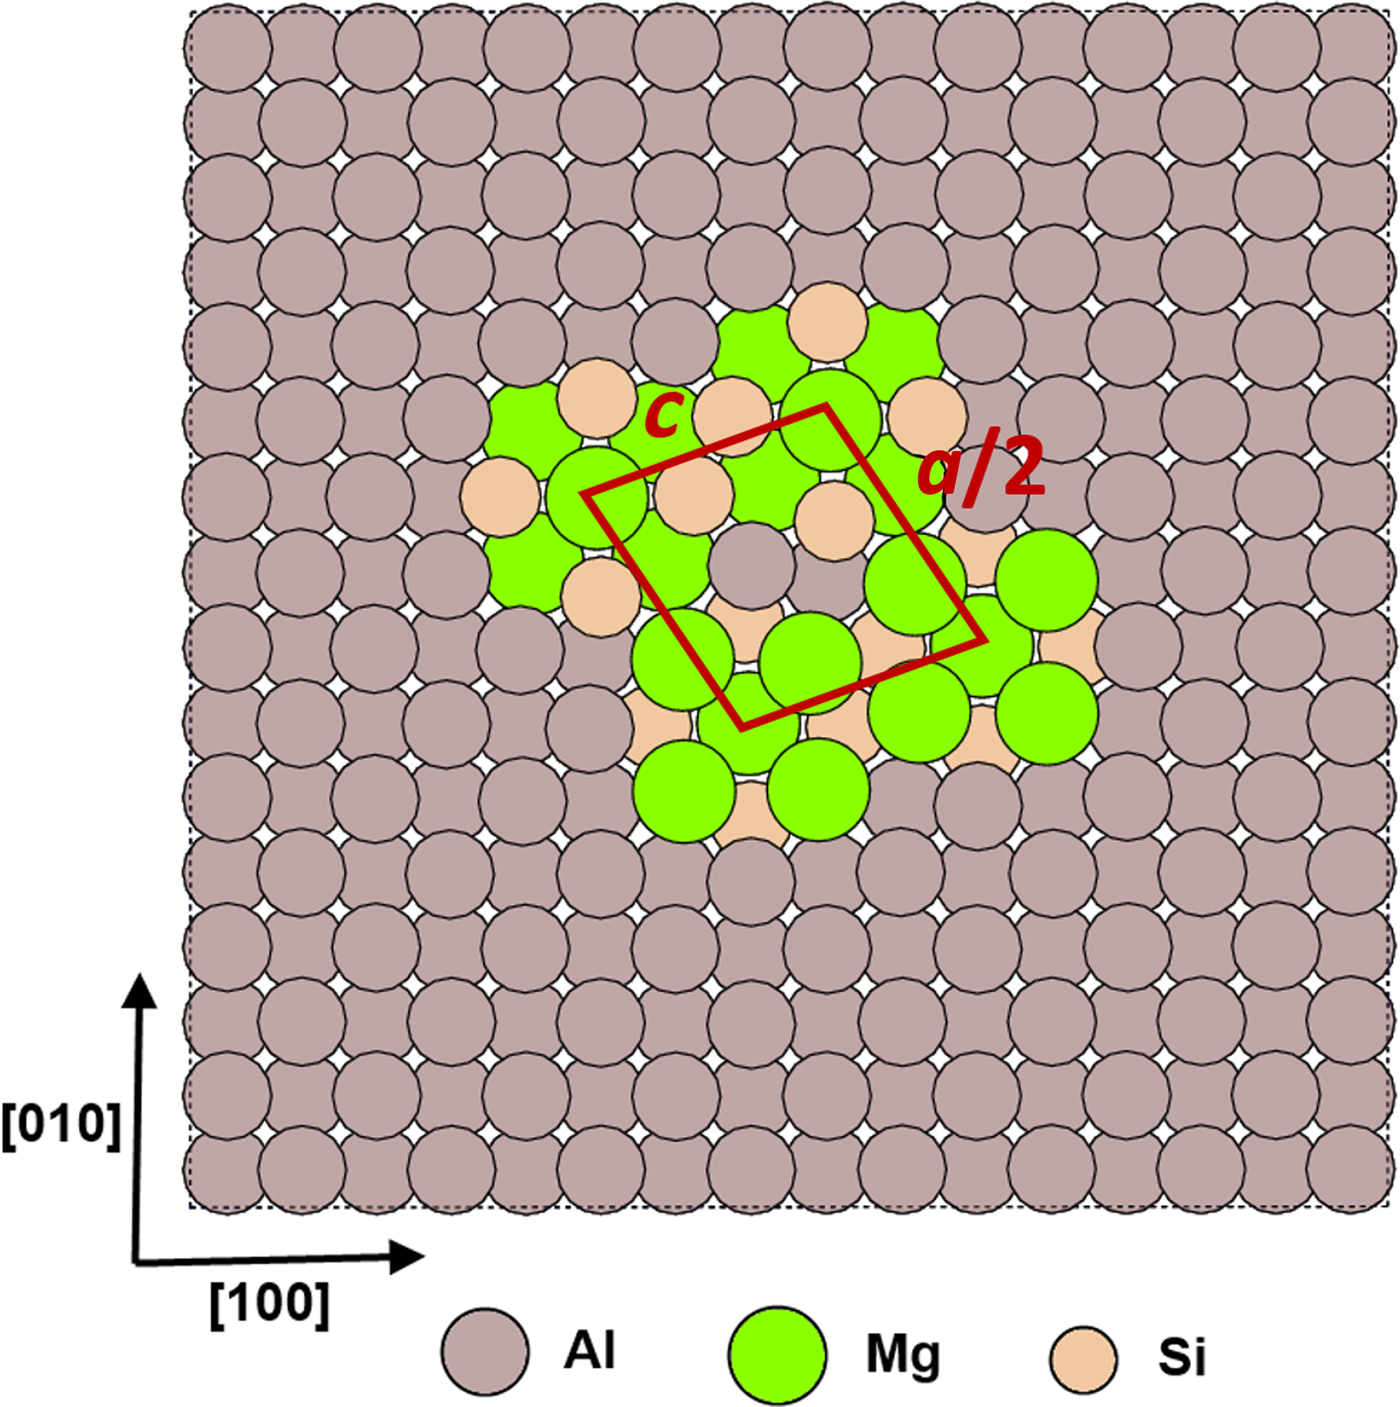
Precipitation strengthening is the most important strengthening mechanisms in age-hardenable aluminum alloys. Precipitation of the β-Mg2Si secondary phase and its precursors from solid solution has been examined in great detail,[Reference Edwards, Stiller, Dunlop and Couper1–Reference Zandbergen, Andersen and Jansen4] because they are responsible for the AA6XXX class of alloys being the strongest aluminum alloys in relation to the amount of solute elements added. The initial stage of the formation of Mg2Si includes the formation of atomic clusters and Guinier–Preston zones. Subsequently, β″ precipitates form as coherent needles in the 〈001〉Al crystallographic directions, typically giving Al–Mg–Si alloys their maximum strength.[Reference Marioara, Nordmark, Andersen and Holmestad5] The β″ needles eventually transform into semi-coherent β′ rods, and ultimately, these rods transform into β-Mg2Si platelets,[Reference Marioara, Nordmark, Andersen and Holmestad5] which represent the true equilibrium phase. The most likely composition for β″ particles appears to be Mg5Al2Si4,[Reference Hasting, Frøseth, Andersen, Vissers, Walmsley, Marioara and Holmestad6, Reference Wenner, Jones, Marioara and Holmestad7] whose unit-cell cross-section in the [001] plane is shown in Fig. 1, and which will be the structure considered in this work.
a × 2c β″ precipitate embedded in Al. Half of a conventional unit cell (centered on Mg1 sites) is marked in the figure. The unit cell of the Mg5Al2Si4 building block has dimensions a = 1.516 nm, b = 0.405 nm, and c = 0.674 nm. The monoclinic angle is 105.3°.[Reference Zandbergen, Andersen and Jansen4]

The observed shape of these precipitates is acicular, with quadrilateral cross-sections on the face-centered cubic (fcc) crystallographic plane.[Reference Chakrabarti and Laughlin8] Although coherent with the surrounding matrix on {001} planes, β″ precipitates behave as impenetrable particles to gliding dislocations. Hardening then results from the increased shear stress required for dislocations to bypass these obstacles, the so-called “dispersed barrier hardening” mechanism. Dislocations detach from obstacles by leaving Orowan loops behind surrounding the precipitates in the glide plane. These Orowan loops are stable above a minimum precipitate size, obtained from a force balance between the loop self-stress and the stress needed to shear the obstacle. From ref. Reference Ashby9, this is equal to:  $\left. {\mu {\rm b/}2\pi r} \right\vert_{{\rm Al}} \,\approx \left. {\mu {\rm /}30} \right\vert_{\beta {\prime}{\prime}}, $ which results in a value of
 $r = 15{\rm b/}\pi \left( {\mu _{{\rm Al}} /\mu _{\beta {\prime}{\prime}}} \right) \approx 1.1\,{\rm nm}$ (μ Al = 28.0 GPa, while
 $\mu _{\beta {\prime}{\prime}} \approx {\rm 33}.{\rm 5}\,{\rm GPa}$ for shearing on {111} planes, which results in |Δμ| ≈ 5.5 GPa.[Reference Ehlers, Dumoulin and Holmestad10]) Consequently, we assume that the precipitates are impenetrable and surrounded by stable Orowan loops for sizes larger than this critical value.
Despite the importance of β″ precipitates in strengthening Al alloys, the nature of their strain fields and their effect on dislocation glide has not been rigorously quantified, due to the complex geometry involved and the difficulty in modeling such a long-range interaction in a metallic solid. Here, we combine experimental characterization with dislocation dynamics (DD) simulations to couple precipitate displacement fields to dislocation–obstacle interactions. The full methodology is then used to conduct a systematic study of β″-precipitate strengthening as a function of precipitate size, dislocation line length, and dislocation character. In Section 2, we describe the methods used, and their implementation and parameterization. We present the experimental results in Section 3, followed by the DD simulation results and a discussion about the main findings. We finalize with the conclusions in Section 5. Details on the derivation of the method implemented can be found in the Supplementary Information.
Methods
DD simulations
The numerical study of precipitate hardening has received substantial attention over the last decade or so, using techniques ranging from analytical studies.[Reference Ashby9, Reference Ardell11] molecular dynamics (MD) simulations,[Reference Osetsky and Bacon12] DD,[Reference Proville and Bako13–Reference Keyhani, Roumina and Mohammadi17] and crystal plasticity.[Reference Han, Wagoner and Barlat18] Most of these approaches are grounded on variations of the original ideas of Eshelby, who provided the first self-consistent framework for the elastic treatment of inclusions in a material.[Reference Eshelby19]
Implementations of precipitate displacement fields in elastic media must use continuously differentiable functions that satisfy elastic equilibrium. This ensures the existence of finite stresses and the stability of the particles. As an approximation imposed by our use of isotropic linear elasticity, we assume circular cross-sections. As our results show, this is a quantitatively reasonable approximation after only a few atomic distances away from the interface. One can then take advantage of spherical symmetries for the solution of the associated strains and stresses. The displacement field u(r) in spherical coordinates assuming angular symmetry is obtained by integrating the following (equilibrium) equation:
 $$\displaystyle{d \over {{\rm d}r}}\left( {\displaystyle{1 \over {r^2}} \displaystyle{d \over {{\rm d}r}}\left( {r^2 u\left( r \right)} \right)} \right) = 0,$$
where r is the distance from the center of the precipitate. Further, we assume that the displacement takes a size-dependent value at the precipitate/matrix interface, and decays to zero at long distances, u(∞) = 0. The solution to Eq. (1) that satisfies these boundary conditions is simply:
 $$u\left( r \right) = k\left( {\displaystyle{R \over r}} \right)^2, $$
where k is a fitting parameter and R is the precipitate radius. For coherent precipitates with isotropic lattice misfit m with Al, k(R) = mR, where m is a constant. Strains are straightforward to derive from Eq. (2) by integrations. The only independent strain components are
 $$\varepsilon _{rr} = \displaystyle{{{\rm d}u} \over {{\rm d}r}}\;{\rm and}\;\varepsilon _{\theta \theta} = \varepsilon _{\phi \phi} = \displaystyle{u \over r}.$$
For their part, the stresses are found assuming isotropic linear elasticity from Hooke's law as
 $$\eqalign{ \sigma _{rr} & = \displaystyle{E \over {\left( {1 + \nu} \right)\left( {1 - 2\nu} \right)}}\left[ {\left( {1 - \nu} \right)\varepsilon _{rr} - 2\nu \varepsilon _{\theta \theta}} \right] \cr & = - \displaystyle{{2ER^2 k} \over {(1 + \nu )r^3}},} $$
 $$\eqalign{\sigma _{\theta \theta} & = \sigma _{\phi \phi} = \displaystyle{E \over {\left( {1 + \nu} \right)\left( {1 - 2\nu} \right)}}\left[ {\varepsilon _{\theta \theta} + \nu \varepsilon _{rr}} \right] \cr & = \displaystyle{{ER^2 k} \over {(1 + \nu )r^3}}} $$
from which the force f on a dislocation segment can be obtained by recourse to Peach–Köhler's formula. The final expressions for the forces and the associated derivations are provided in the Supplementary Information. The displacements, strains, and stresses are all singular at the center of the precipitate, but can be safely used in the surrounding matrix in the case of unshearable particles.
The dislocations move in response to the applied forces according to the following viscous equation:
 $${\bi v} = {\bi Mf}_{\rm t}, $$
where M−1 = B((n × t) ⊗ (n × t)) is the inverse mobility tensor, B is the drag coefficient for dislocation glide, and n and t are unit vectors representing the glide plane normal and the line direction. The total force ft contains contributions from all sources of stress, including self-stresses, other line segments, the spherical inclusion (f), and the applied stress; see Supplementary Information. A detailed description of the DD formulation employed here is provided in Refs. Reference Arsenlis, Cai, Tang, Rhee, Oppelstrup, Hommes, Pierce and Bulatov20 and Reference Martinez, Marian, Arsenlis, Victoria and Perlado21.
Next, we use experimental observations specifically tailored to the models to justify our assumptions of sphericity and impenetrability.
Transmission electron microscopy (TEM) characterization of β″ precipitates
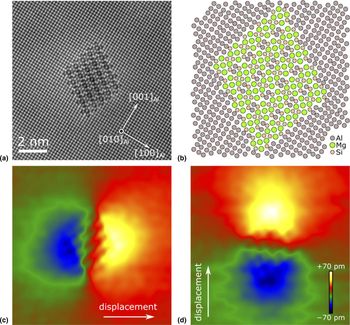
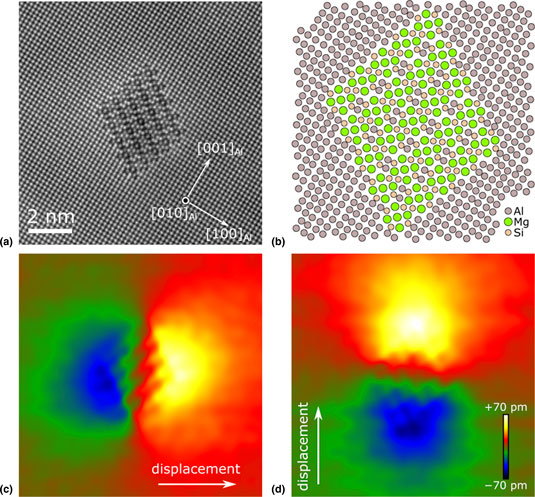
A systematic study of β″ precipitates using distortion-corrected high-resolution scanning transmission electron microscopy (HR-STEM) has been performed to ascertain their structure, shape, and associated displacement fields. Experiments were performed on peak-aged AA6060 alloys, which are seen to develop precipitates with an average radius of 2.7 nm.[Reference Mørtsell, Marioara, Andersen, Røyset, Reiso and Holmestad22] Detailed information about the HR-STEM observations can be found in Ref. Reference Wenner and Holmestad23. The images have been used to measure the displacement and strain fields around the precipitates. By way of example, Fig. 2 shows a 5a × 5c precipitate and its measured displacement fields in a two-dimensional projection.
Experimental input for strain field modeling. (a) STEM image of β″ precipitate of 5a × 5c unit cross-sectional size.[Reference Wenner and Holmestad23] (b) Projected atomic model of the same precipitate. (c–d) Atomic displacement of the Al matrix, calculated from (a) via the GPA method,[Reference Hÿtch, Snoeck and Kilaas24] with a 0.6 nm mask. The precipitate is imaged along their main growth/coherency direction, parallel to 〈001〉Al.
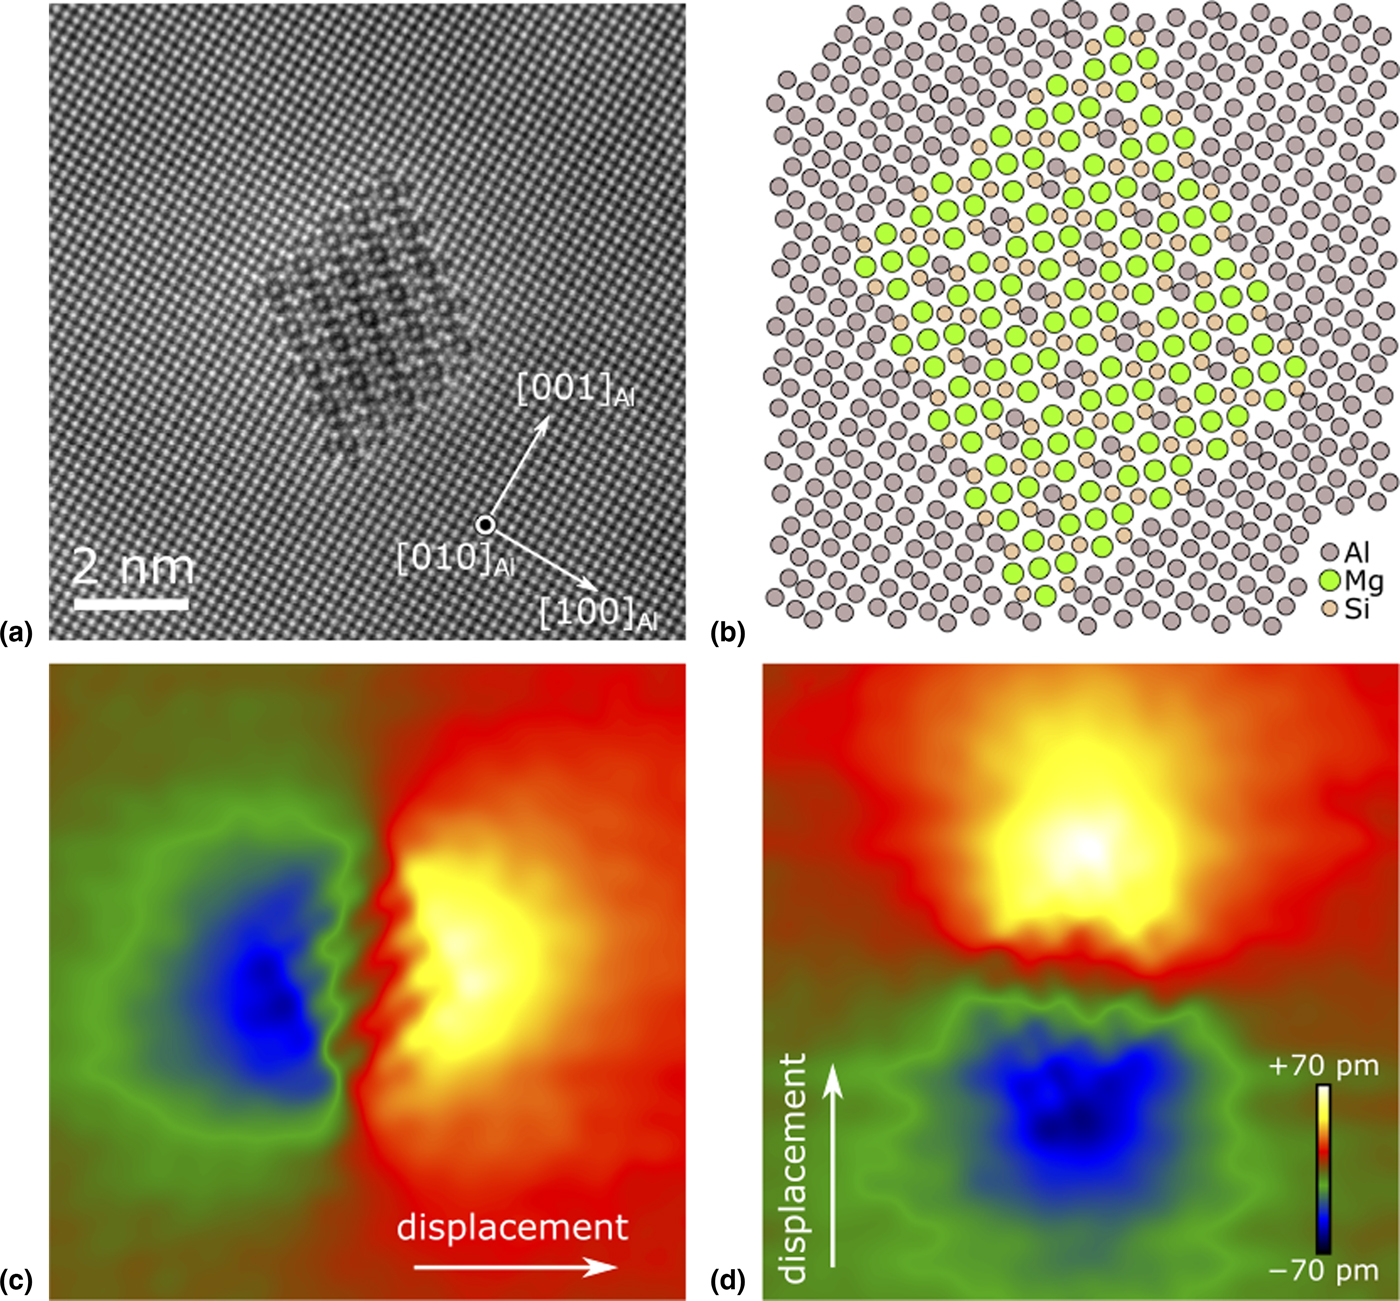
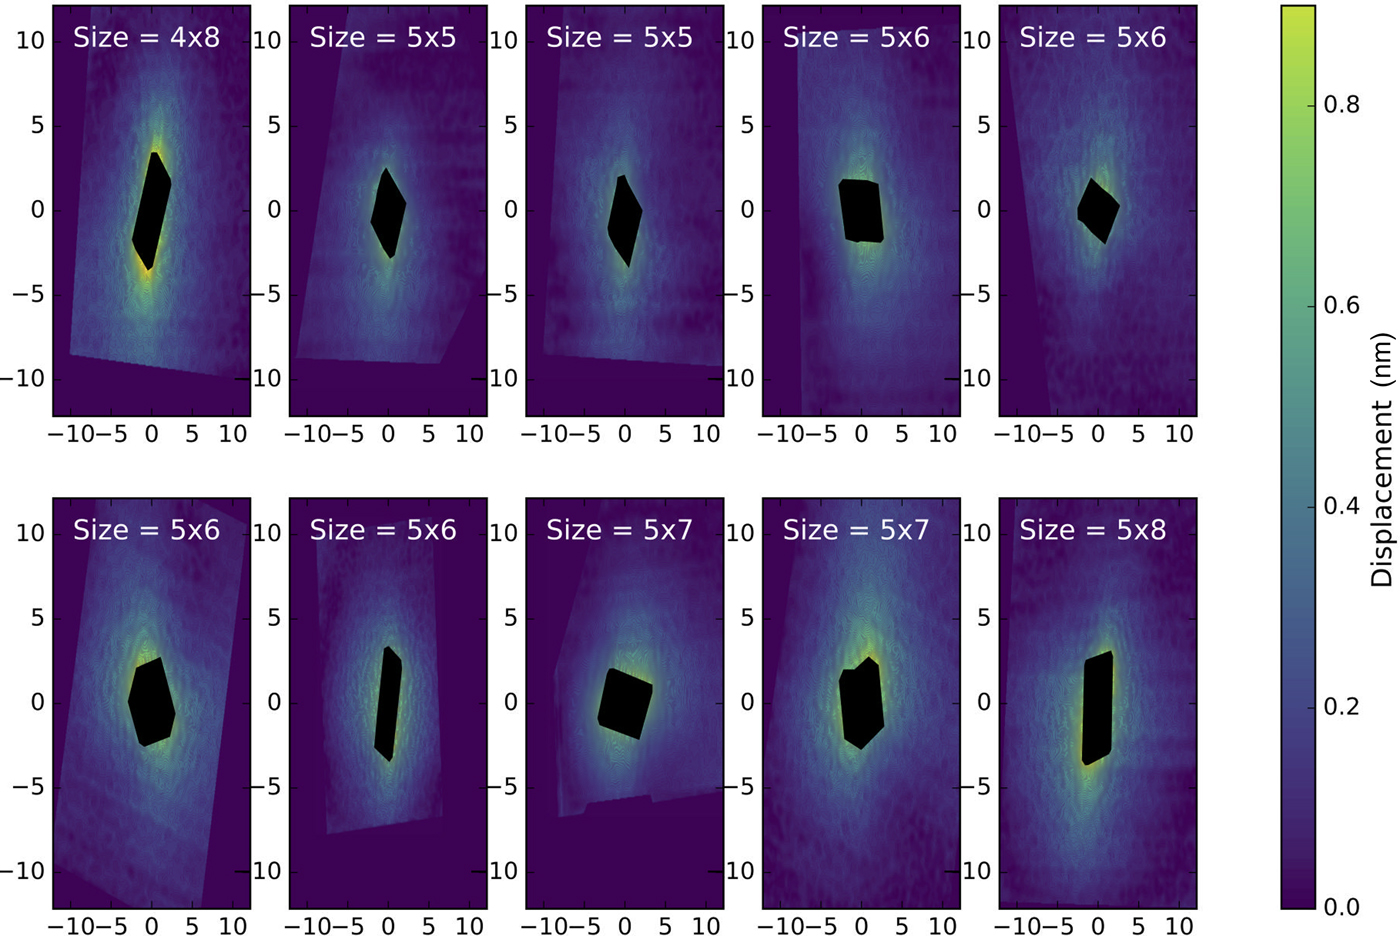
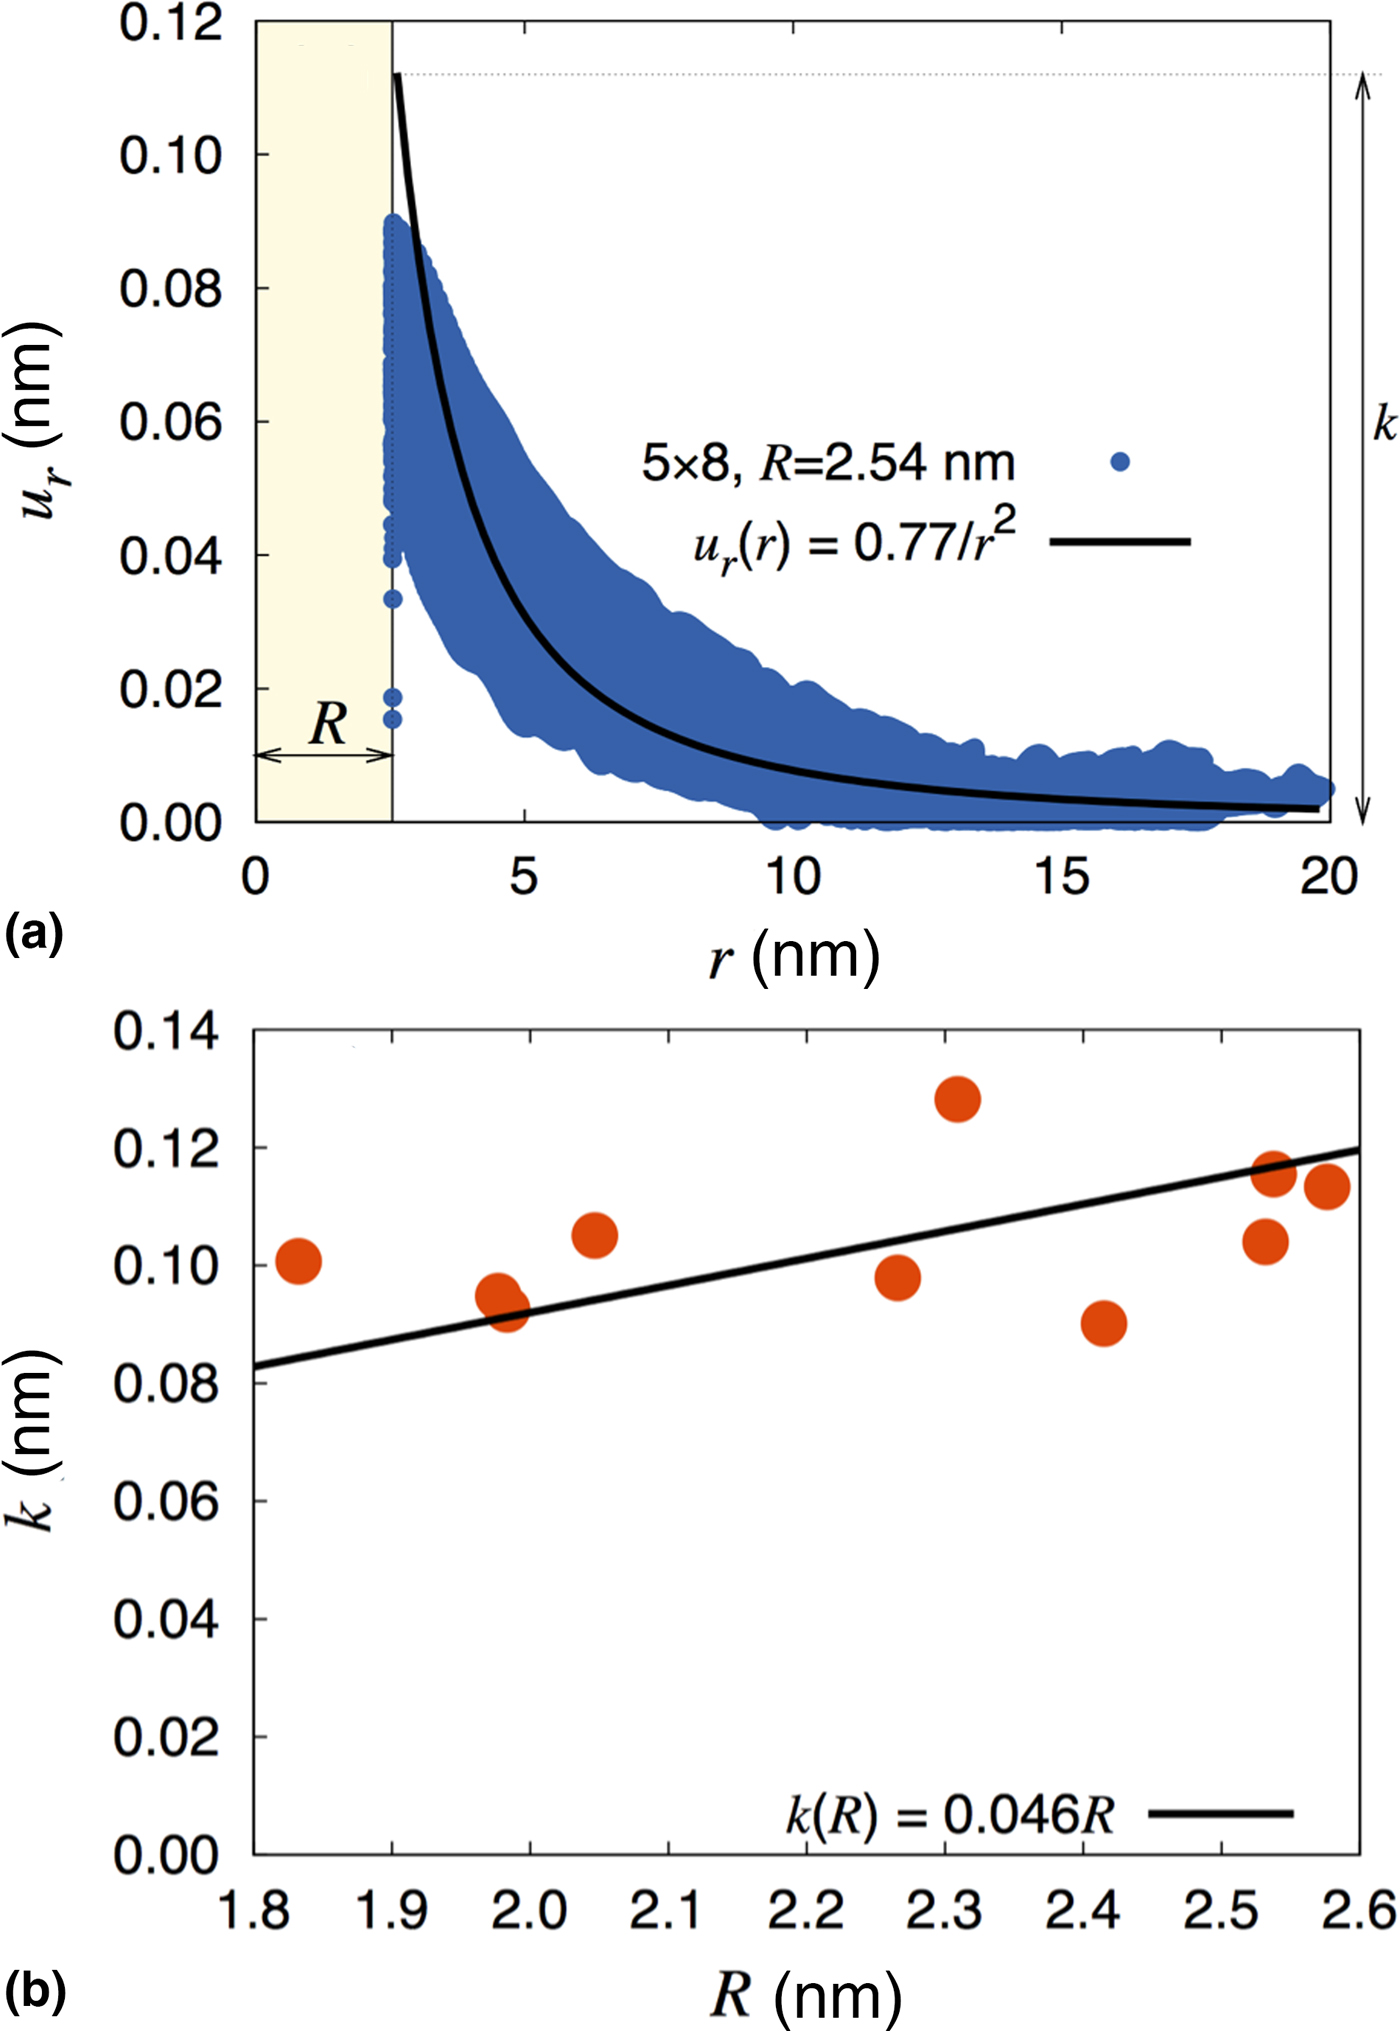
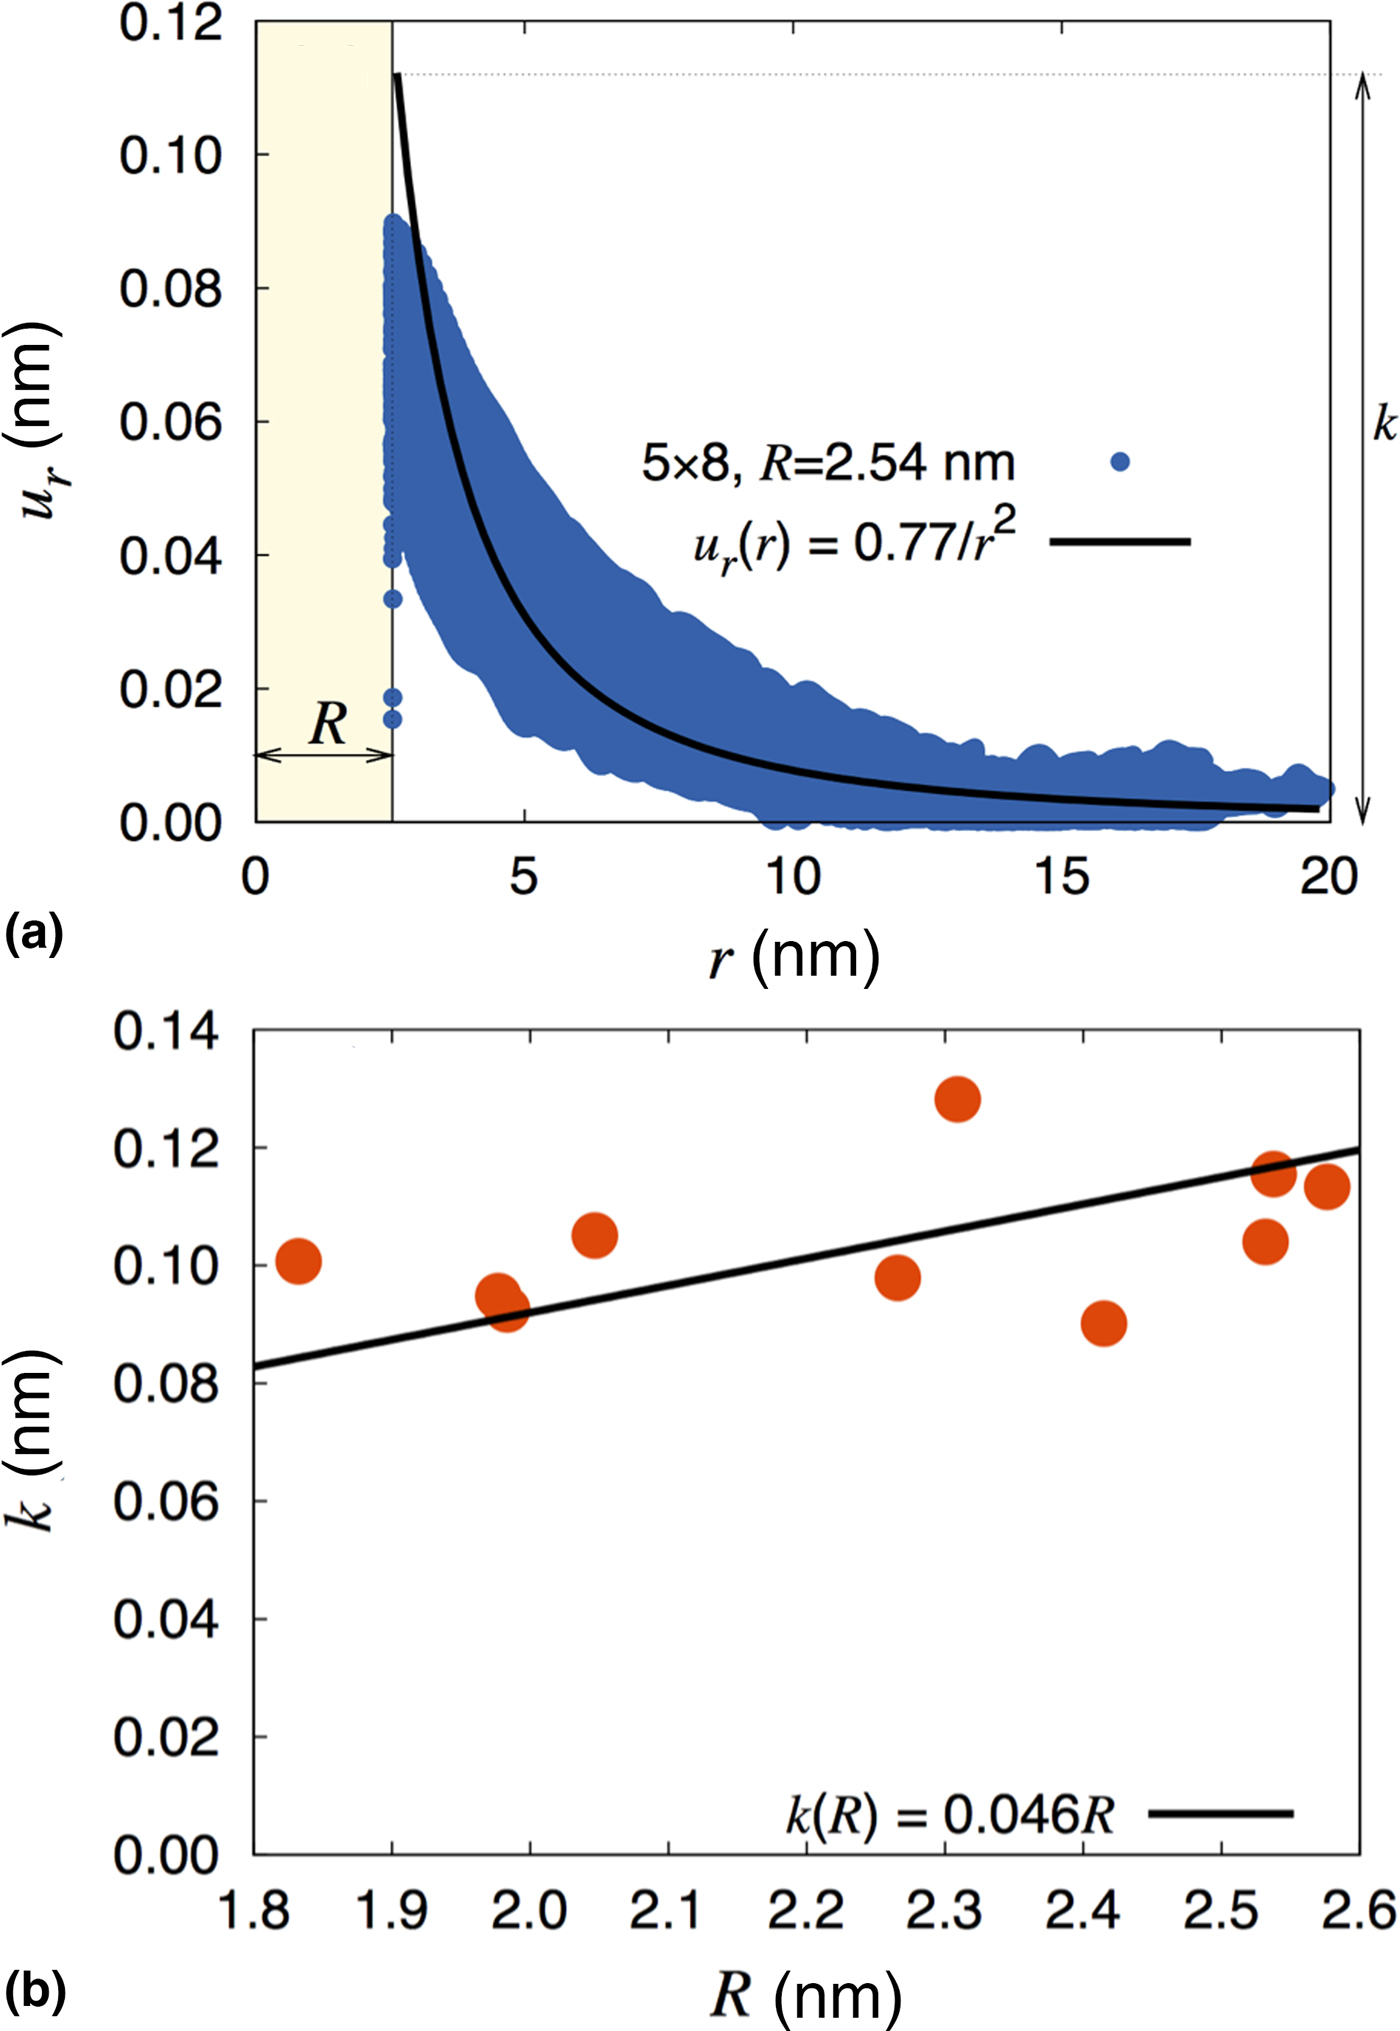
The associated displacement field magnitudes for a number of precipitates were measured using “geometrical phase analysis” (GPA),[Reference Hÿtch, Snoeck and Kilaas24] on the HR-STEM images are shown in Fig. 3. The β″ phase is slightly less dense than Al, which results in compressive stresses in the matrix. The figure clearly shows that, despite the faceted structure of the precipitate, the displacement fields tend to become angularly symmetric and thus dominated by the radial component after only a few atomic distances away from the interface. Thus, in the glide plane of the dislocation that intersects a precipitate, the assumption of angular invariance is considered satisfactory. The displacement fields of ten precipitates of the 5a × 8c kind are plotted in Fig. 4a against the distance from their centers. Although there is a fair amount of variability in the measurements, the data can be cleanly fitted to Eq. (2) to extract the value of the constant k as a function of precipitate radius. The equivalent precipitate radius was calculated as the radius of a circle with the same area as the precipitate cross-section on the {100} plane. The results can be found in Fig. 4b, with k taking a value of 0.05 in the 1.8–2.6 nm size range.
Radial displacement field of several selected β″ precipitates. These are calculated from the experimental input as shown in Fig. 2. The displacements inside the precipitates are ignored, and the radial displacement is calculated as the square root of the x-displacement squared and the y-displacement squared. The precipitate is imaged along their main growth/coherency direction, parallel to 〈001〉Al.
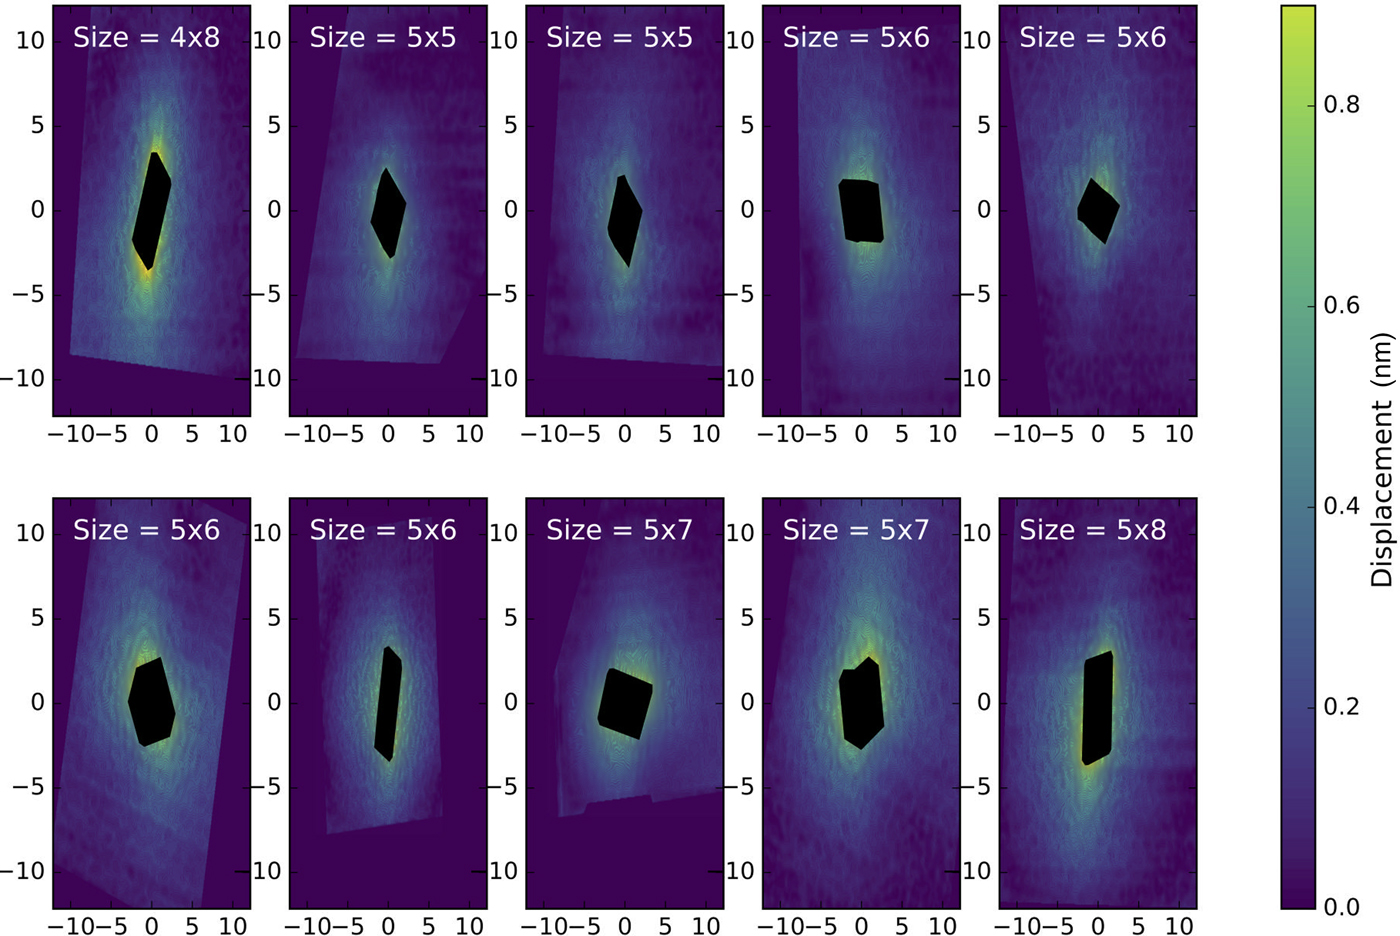
(a) Radial displacement field of one specific β″ precipitate size analyzed as a function of distance from the center of the obstacle, and fitted to Eq. (2), to obtain the fitting constant k. (b) k plotted against the radius for all precipitates studied and fitted to a linear equation k(R) = mR, with m ≈ 0.05. The value of  ${\cal {R}}^2$ for the fit shown in the figure is 0.987.
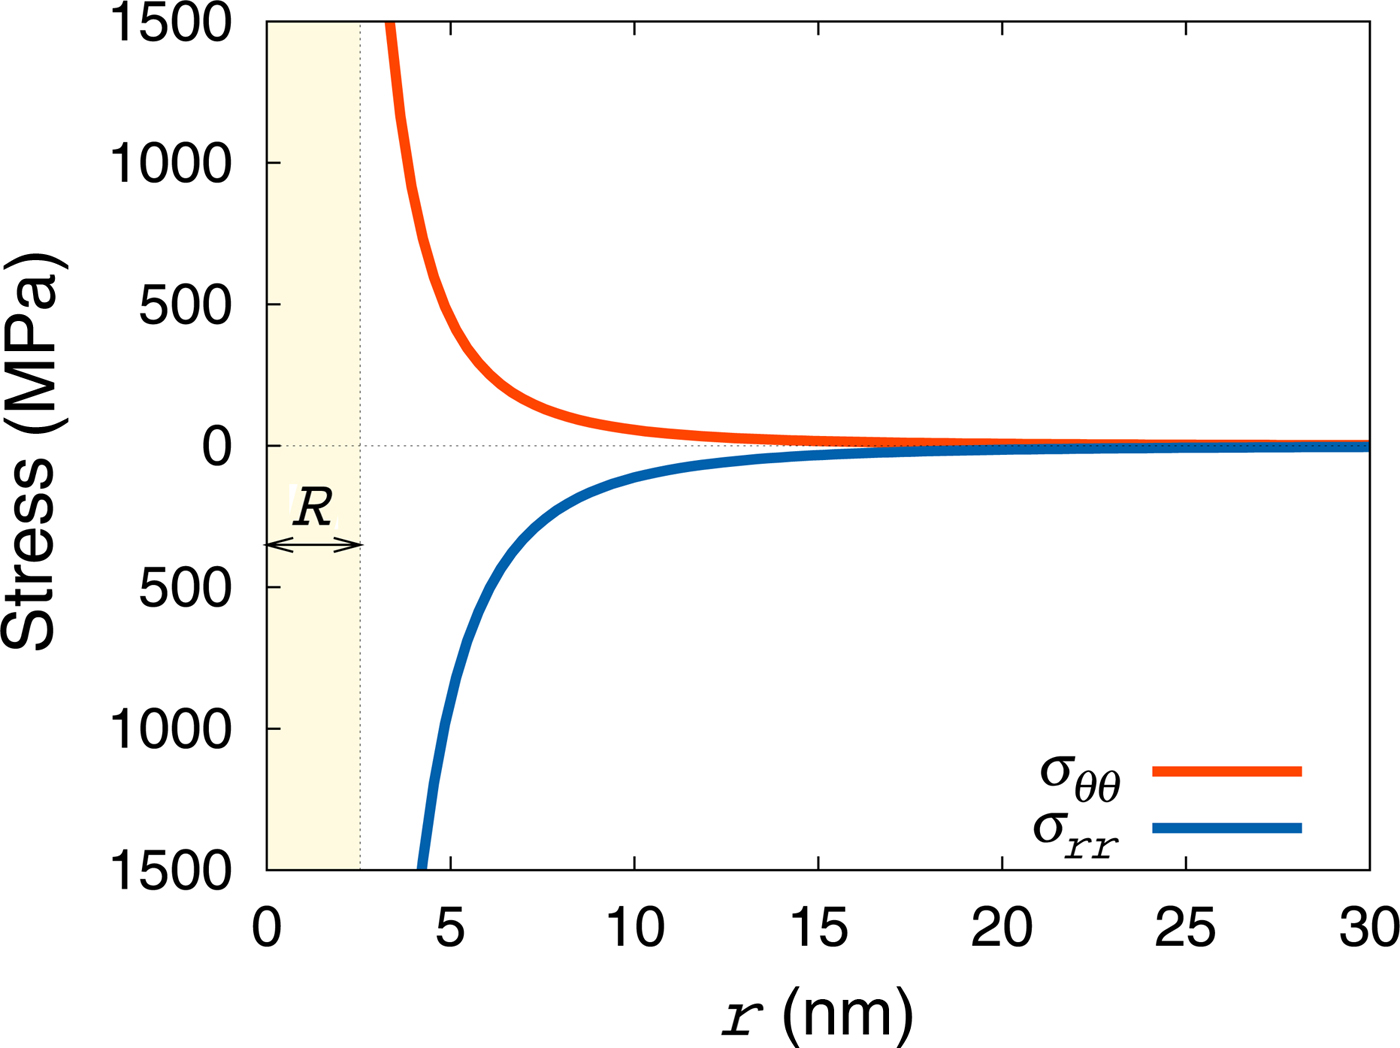
With this, the stresses created by a precipitate in the matrix are shown in Fig. 5. As Eqs (4) and (5) illustrate, these axial stresses decay as r –3 and take finite values at the precipitate/matrix interface.

Results
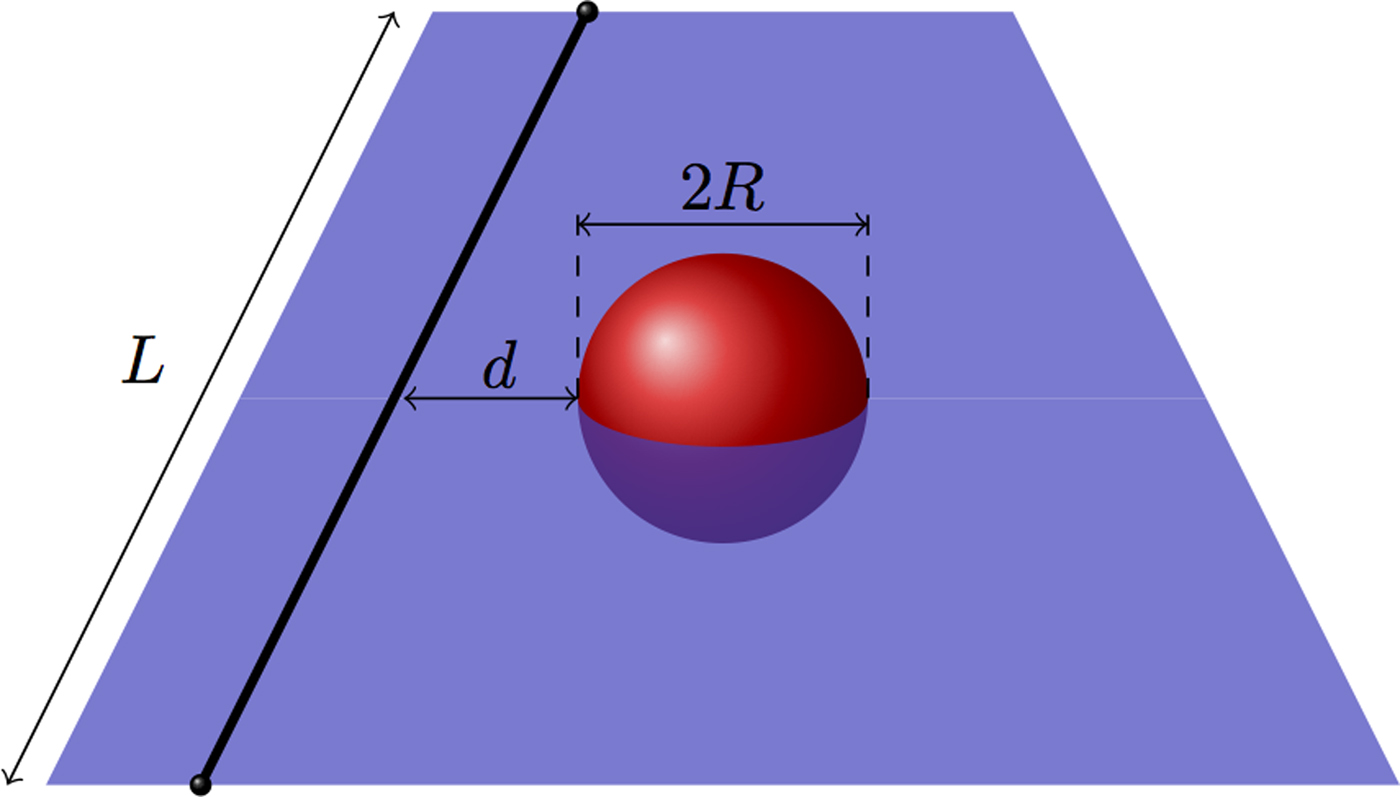
The simulation setup involves Frank–Read (FR) sources of length L with either pure edge or screw dislocation character, situated at a distance d (see Fig. 6) from a spherical precipitate. Although DD formulations that account for dislocation partials in fcc crystals exist,[Reference Martinez, Marian, Arsenlis, Victoria and Perlado21, Reference Marian, Martinez, Lee and Wirth25] for simplicity here we consider perfect dislocations of the 1/2[110] type. (Also, considering the relatively high stacking fault energy of Al leads to a reduced dissociation propensity.) The precipitates investigated range in size from 1.2 to 5.2 nm—which encompasses the average precipitate size of the alloys studied here of 2.7 nm—while L ranges between 40 and 65 nm. L is connected to the average precipitate density as 2Rρ p ≈ L −2, which for an average radius of 2.7 nm corresponds to particle densities in the 4.4 × 10²²-to-1.2 × 10²³ m–3 range. By way of comparison, the experimental estimate is 3.2 × 10²¹.[Reference Mørtsell, Marioara, Andersen, Røyset, Reiso and Holmestad22] All simulations are performed at a temperature of 300 K. Figure 6 shows a schematic diagram of the starting configuration. The model parameters are given in Table I with the method used to obtain each one of them and the source indicated in each case:
Schematic diagram showing the starting configuration of DD simulations. The FR source (initial dislocation line) is shown as a thick black line. The red sphere represents the spherical precipitate, and the shaded plane represents the glide plane.

List of parameters employed for AI in this work with the source and method indicated where appropriate.

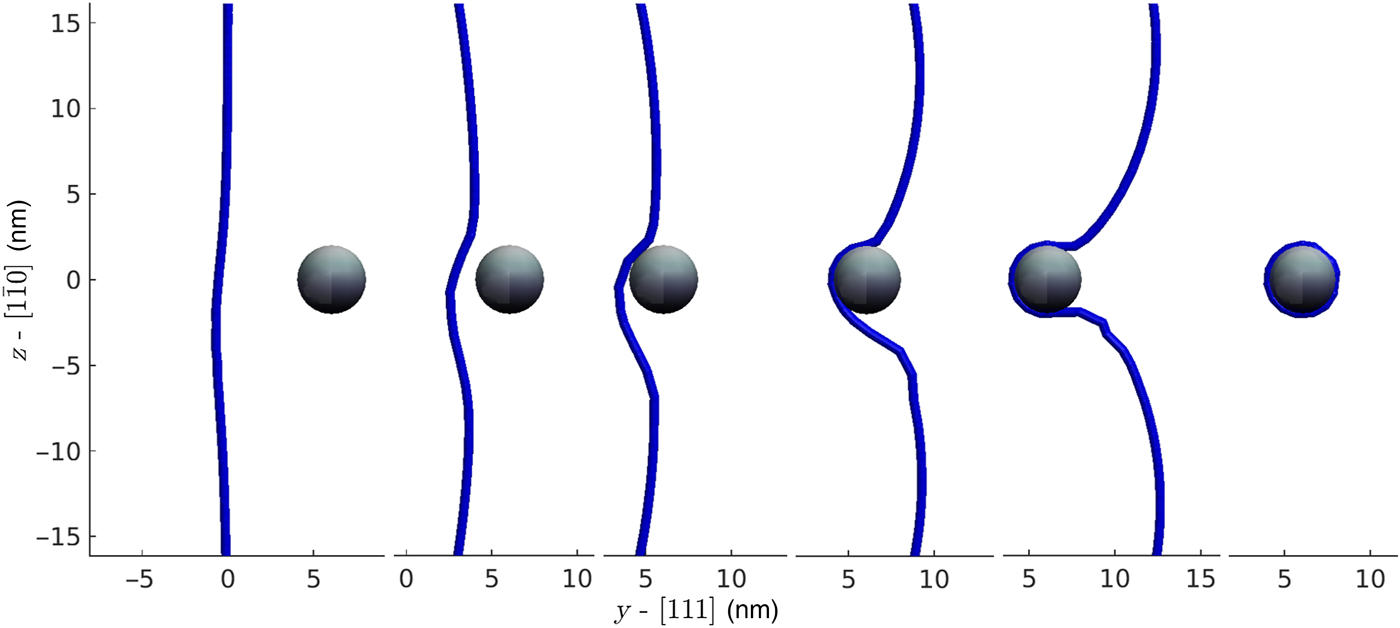
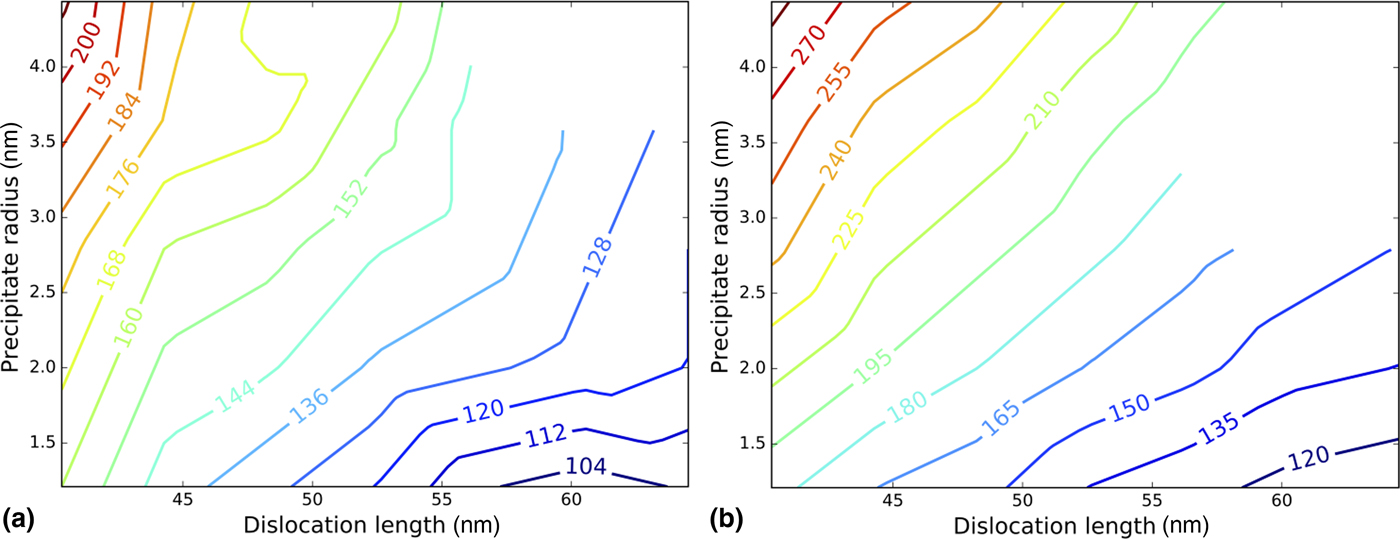
A sequence of frames of a DD simulation of a screw dislocation of length 56.4 nm interacting with a precipitate of size 4.03 is shown in Fig. 7. The effect of the precipitate stress field on the dislocation line before contact can be clearly appreciated in the figure. The subsequent approach, bowing, and creation of a closed Orowan loop are also shown. The simulated precipitate strengths for edge and screw FR sources of various lengths are shown in Fig. 8 as contour maps in the R−L space. The strengths range from approximately 100–200 MPa for screw dislocations and 105–295 MPa for edge dislocations. We emphasize that these are results for precipitate sizes above the critical shearing radius of 1.1 nm. In any case, our results show that β″ precipitates can act as considerable sources of hardening in AA6XXX alloys.
Sequence from a DD simulation between a screw dislocation of length 56.4 nm and a precipitate of diameter 4.03 nm. Showing approach, impact, bowing, and the precipitate plus Orowan loop.

Contour maps of the precipitate strength (critical stress) as a function of FR source length and precipitate radius. (a) Edge dislocations. (b) Screw dislocations.

Next, we analyze our results in the context of established hardening theories. The most widely used model of precipitate strength is the Bacon–Kocks–Scattergood (BKS) model,[Reference Bacon, Kocks and Scattergood29] which expresses the yield stress increase due to an array of equally-spaced precipitates of diameter D interacting with an edge dislocation as
 $$\Delta \tau = A\displaystyle{{\mu b} \over {l - D}}\ln \displaystyle{{\bar D} \over {2b}},$$
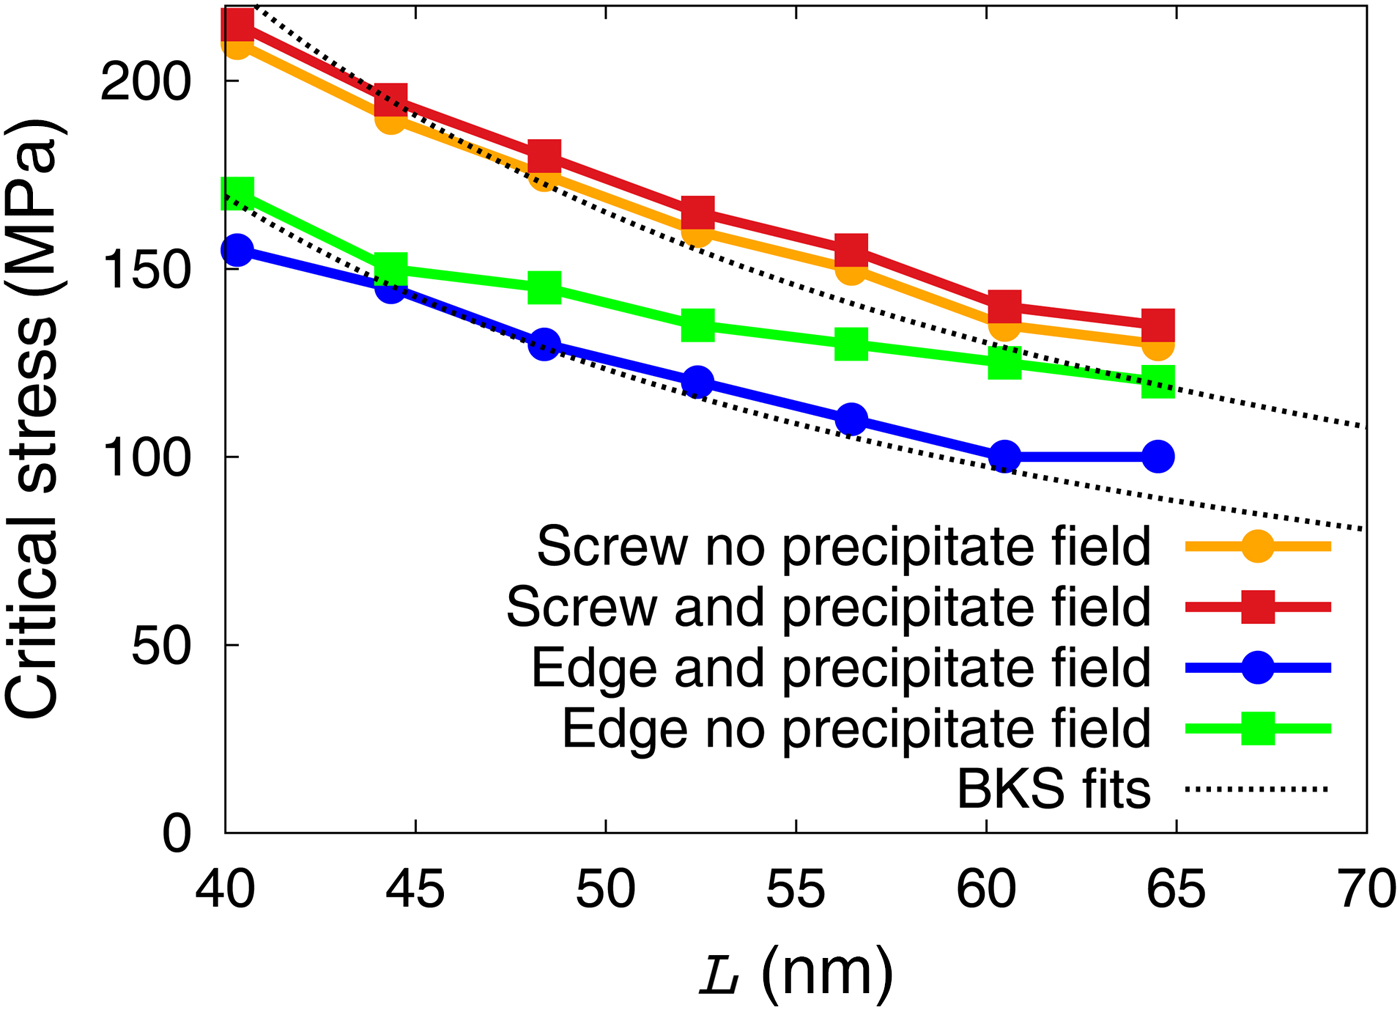
where A is a constant, l is the inter-precipitate distance, and  $\bar D = Dl/l + D\; $ is the harmonic average of l and D. This formula cannot be directly applied to our case, as we have finite length FR sources, as opposed to a nominally infinite dislocation segment, as the BKS model assumes. However, a reasonable matching can be found by assuming L ≈ 2l and leaving A as a fitting parameter. An example for a precipitate with radius 4.03 nm is given in Fig. 9. We find values of A = 1.37 and 1.024 for screw and edge dislocations, respectively, when stresses are expressed in MPa and lengths in nm. As the figure shows, the dependence with L of the precipitate strength obtained via DD simulations closely matches that of the BKS formula in Eq. (7). Changing the precipitate size results in qualitatively similar results. The results also show that obstacles exert a higher resistance to edge dislocations than to screw dislocations (ignoring the effect of cross-slip), which we here can observe through the larger difference between the precipitate strength with and without a precipitate stress field. This is a fact to be expected since edge dislocations are more sensitive to dilatational strain fields. In any case, the differences between the critical stress with and without precipitates are of only about 15%. This clearly shows that particle strengthening is felt primarily via the inter-particle spacing (which is primarily controlled by the precipitate number density), which sets the available segment length l, while the strengthening due to the precipitate strain field is a second-order effect.
Precipitate strength for precipitates with diameter = 4.03 nm as a function of FR source length with and without a precipitate stress field and fitting to the BKS formula.

Discussion
Experimental characterization of the microstructure of materials has reached a degree of resolution and quantitative accuracy on par with atomistic simulation techniques. In this work, we take advantage of high-resolution TEM imaged Mg–Al–Si precipitate examinations in AA6XXX alloys to define their displacement field in the surrounding Al matrix with nanometric precision. The results are then adapted into a DD model of dislocation-obstacle interaction to characterize their strength to dislocation glide. DD captures many of the fine details of the lattice deformation processes associated with elastic defects, yet it is sufficiently coarse to allow for dislocation lines of the order of hundreds of nanometers, which is reasonably close to the dislocation densities measured in engineering metallic materials. Unraveling the obstacle strength from macroscopic stress measurements can be exceedingly difficult. Our approach provides a pathway to doing precisely such a thing. Mapping the precipitate strength as a function of radius and dislocation line length can give engineers an idea of the level of aging and/or cold-working necessary to reach a given material strength. As well, it can be used to define sampling functions in parametric DD simulations,[Reference Han, Ghoniem and Wang30, Reference Ghoniem, Tong and Sun31] to achieve a higher level of efficiency and reach longer simulated strains. This is the subject of ongoing work by the authors.
Although β″ precipitates are known to be elongated with quadrilateral cross-section, our TEM examinations show that their displacement fields are reasonably-well described by angular symmetric solutions on the dislocation glide plane. This simplifies the calculation of stresses and forces within DD, yet captures the essential physics of the process. Further, we have justified the assumption of impenetrability of the precipitates even though they are coherent with the lattice on {100} planes. This is justified in terms of the internal structure of the precipitates, which are significantly stronger than the matrix and are considered impassable by the dislocations. As such, the observed strengthening mechanism is Orowan loop formation, which can be quantified reasonably well by analytical models, as we have shown above. In accordance with these models, edge dislocations suffer a larger degree of resistance than screw dislocations, ≈10% compared with approximately 3% as estimated by our DD calculations. A key difference between edge and screw dislocations is of course the propensity of the latter to cross-slip, which is not captured in the simulations presented here. However, we are unsure about the relevance of this mechanism due to: (i) their dissociated nature in fcc metals, and (ii) the—in reality—elongated (cylindrical) shape of β″ precipitates. In aluminum, cross-slip may be relatively easier, due to its high stacking fault energy, and so we note that it may play a role not considered in this work. Another aspect not included in this work is the successive accumulation of Orowan loops from the passage of a train of dislocations emanating from a single FR source.[Reference Shin, Fivel, Verdier and Oh32]
The coupling between experimental measurements and modeling—where experimental data is used to parameterize a model—has been discussed in the literature going back to the 1980s, although it has not become a generalized practice except perhaps in the realm of atomistic interatomic potentials.[Reference Tersoff33, Reference O'Connor and Biersack34] We emphasize that experimental data is used here not to fit the model to a desired range of strength values (“end-way” fitting), but to parameterize the model with fundamental information without prior knowledge of its effect on the response quantity. Validation of these calculations then involves implementation of these results into parametric DD or crystal plasticity models to predict the macroscopic response of deformed material specimens.[Reference Cereceda, Diehl, Roters, Raabe, Perlado and Marian35] Alternatively, precise in situ TEM observations of dislocation–obstacle interactions could be attempted, as it has been done for several materials.[Reference Clark, Robertson, Dougherty, Ahn and Sofronis36, Reference Nogiwa, Yamamoto, Fukumoto, Matsui, Nagai, Yubuta and Hasegawa37]
Conclusions
• Fine-scale measurements of displacement fields around β″ precipitates have been used to parameterize DD simulations to measure isolated precipitate strength.
• The precipitates have been implemented as impenetrable spherical inclusions with a displacement field that preserves elastic equilibrium.
• β″ precipitates can cause considerable hardening, 100–200 MPa in the 1–4-nm size range.
• The DD simulations predict a dependence on L captured by analytical models based in isotropic elasticity. This is expected for processes governed by non-shearable particles that leave closed loops around precipitates.
• Our simulations clearly show that precipitate strengthening is governed by the inter-particle distance, with the precipitate strain field representing only a second-order effect.
• Our precipitate strength R–L maps will be used in more homogenized models of material strength.
Supplementary material
The supplementary material for this article can be found at: https://doi.org/10.1557/mrc.2017.78