RESEARCH BACKGROUND AND SETTING
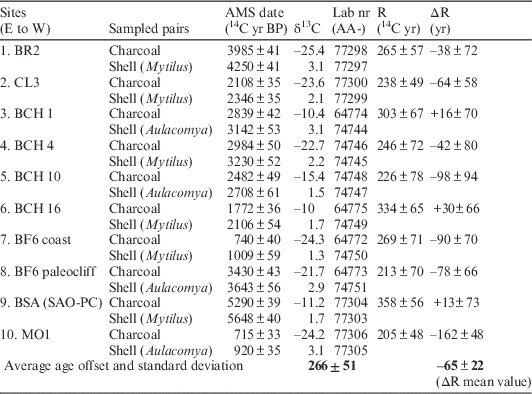
Archaeological work carried out since 2004 at the San Matías Gulf (northern Patagonia, Argentina) uncovered plentiful evidence of exploitation of marine resources since Mid-Holocene times by hunter-gatherer groups. The most conspicuous archaeological deposits are shell-middens, which contain faunal remains, lithic artifacts, and numerous charcoal fragments. These shell-middens are discrete accumulations of valves related to events that record the consumption of mussels (Mytilus edulis and Aulacomya ater). According to ethnographic references and archaeological studies, mussels were dropped into small fires for opening the valves and consumed immediately, discarding the shells in the same fire context (Caviglia and Borrero Reference Caviglia and Borrero1978; Orquera Reference Orquera1999). This practice enables us to compare ages of valves and charcoal to establish reservoir age estimates, also evidenced by other studies (Favier Dubois et al. Reference Favier Dubois, Borella, Steffan and Ortega2015). The high temporal resolution of these anthropic accumulations enables them to be a good choice for evaluating age offsets due to the marine reservoir effect (MRE). Stuiver et al. (Reference Stuiver, Pearson and Braziunas1986) define R as the difference between marine and atmospheric radiocarbon (14C) ages of material that sampled each reservoir at the same time. Stuiver and Braziunas (Reference Stuiver and Braziunas1993) developed the first model relating calibrated terrestrial ages and coexisting marine material, with this age difference defined as ΔR. The dataset obtained from this study was initially published in a regional magazine (Favier Dubois Reference Favier Dubois2009) but in order to make these results available to an international audience they are presented in this report, with calculated ΔR values.
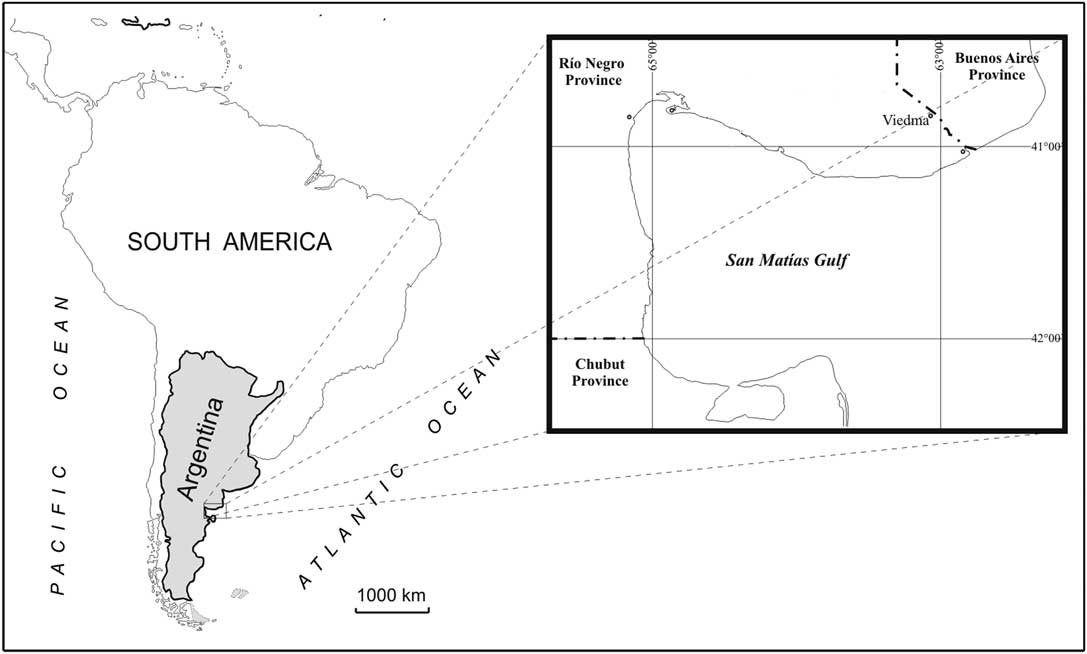
The San Matías Gulf is located in the northern Patagonian Atlantic coast, comprised mainly by the Río Negro province, Argentina (Figure 1). The area has a semiarid climate with a mean annual temperature of 15ºC and a mean annual precipitation of 300 mm. Strong winds blow from the southwest, dominating littoral currents and coastal dune morphology. Tides are semidiurnal and have a macro tidal regime, with mean amplitudes of 6.71 m and maxima of 9.43 m at syzygies at the port of San Antonio Este, on the Bahía de San Antonio (Servicio de Hidrografía Naval 2016). Vegetation is shrubby, corresponding to the Patagonian Monte, where Larrea spp. predominates (Cabrera and Willink Reference Cabrera and Willink1980).
Location of the San Matías Gulf.

MATERIALS AND METHODS
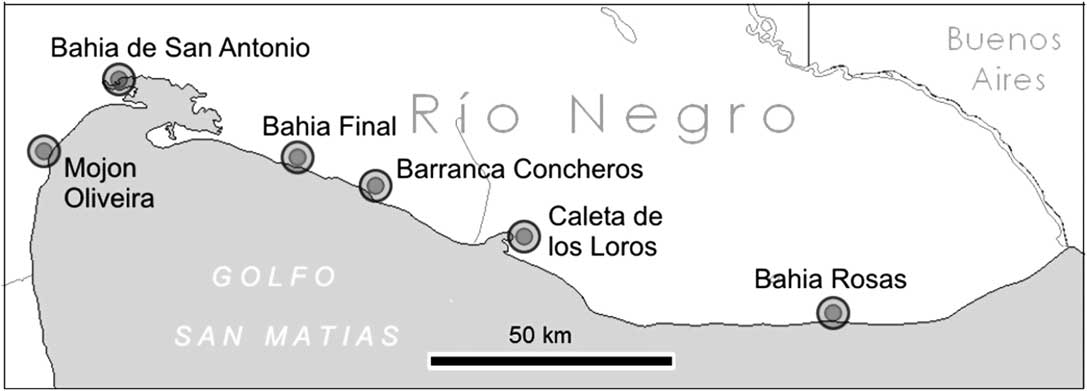
For local MRE evaluation, shell and charcoal pairs were selected from archaeological shell-middens dated between ca. 5300 and ca. 700 14C yr BP. In each pair, one sample is in equilibrium with the atmospheric reservoir (charcoal) and the other with the marine reservoir (mollusk). Marine samples correspond to meso and infra-littoral bivalves belonging to the Mytilidae family: Mytilus edulis (blue mussel) and Aulacomya ater (ribbed mussel). They live attached on the rocky littoral platform (i.e. Tertiary siltstones and Quaternary conglomerates) that runs along this coast. Terrestrial samples (charcoal) correspond to burned shrub species that are common in the area, as Larrea spp. (Jarilla), Prosopis sp. (Alpataco), and Schinus sp. (Molle). They are still used today as a source of firewood. Each shell-charcoal pair comes from a single stratigraphic unit (artificial level of 5 cm). Pairs were taken from 10 shell-middens corresponding to six different archaeological localities along the San Matías Gulf (Figure 2).
Archaeological localities sampled for MRE studies in northern San Matias Gulf.

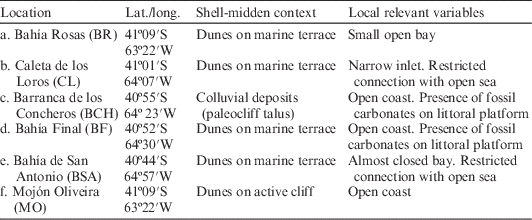
Samples were chosen following two criteria: (1) specimens from the most ancient to most recent archaeological localities to evaluate possible changes in MRE through time; and (2) specimens corresponding to localities placed in different geographical/geological settings along the northern coast of the San Matias gulf (Table 1), to check local factors. All samples were dated by accelerator mass spectrometry (AMS) at the NSF Arizona AMS Facility laboratories, according to established procedures.
Position and contextual information of sampled localities.

RESULTS
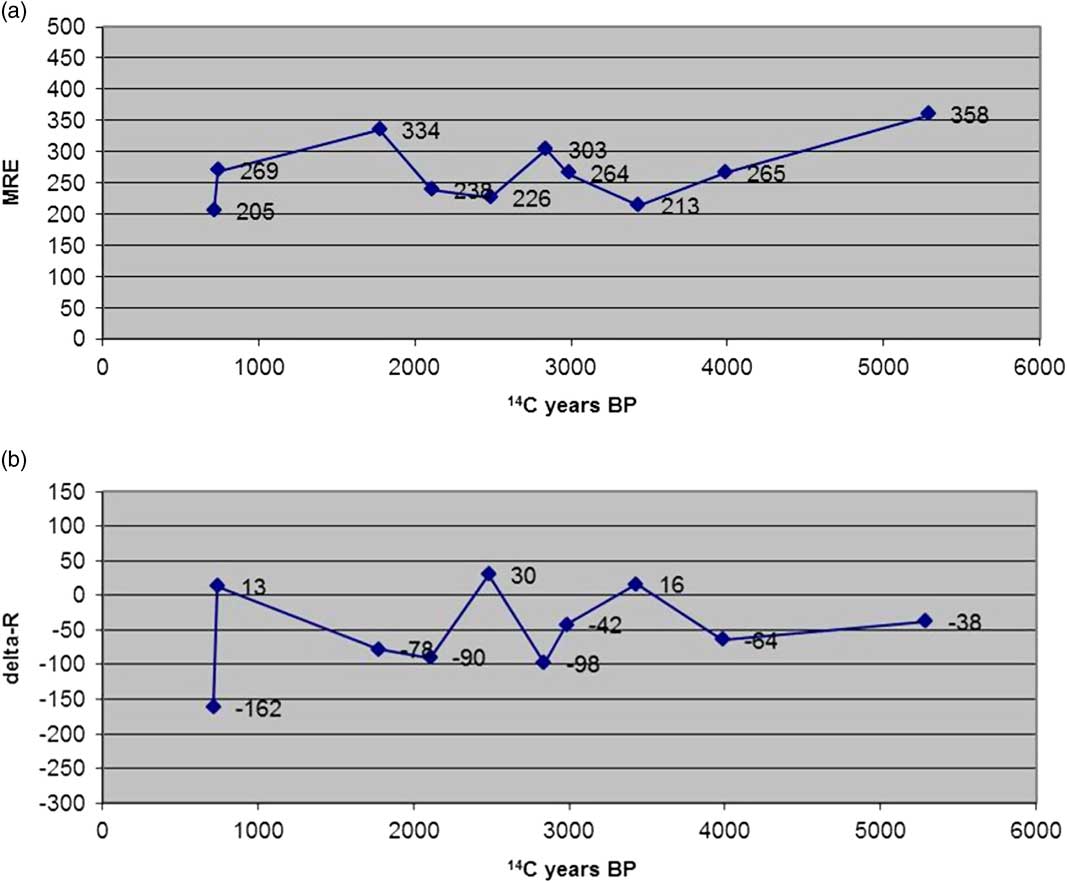
The dating of the archaeological pairs provided 20 AMS ages and 10 age offsets between ca. 5300 to ca. 700 14C yr BP (Table 2). The age offsets are considered primarily due to changes in the MRE, which we refer to as R (Stuiver et al. Reference Stuiver, Pearson and Braziunas1986). These values do not show noticeable temporal tendencies, fluctuating between 205 and 358 yr (Table 2 and Figure 3). We have also calculated values of ΔR (Stuiver and Braziunas Reference Stuiver and Braziunas1993; Reimer and Reimer Reference Reimer and Reimer2001) using the online interface at calib.org/deltar (Reimer and Reimer 2016). The results do not suggest either a marked influence of local effects as restricted connection with open sea or the presence of fossil carbonates. Our results can be compared to Gomez et al. (Reference Gómez, Borel, Aguirre and Martínez2008), who measured ΔR values of –40±46 to +143±46 yr in the Bahia Blanca estuary, to the north of our sampling location.
Variation in (a) MRE and (b) ΔR values from ca. 700 yr BP to ca. 5300 14C yr BP.

MRE values from ca. 700 yr BP to ca. 5300 14C yr BP in northern San Matías Gulf.

FINAL REMARKS
The continental Patagonian coast, which is more than 3000 km long, shows a significant variability in ΔR values. This was highlighted by 20 modern shell-plant pairs collected from northern Patagonia to Tierra del Fuego showing 14C age offsets from 80 to 1100 yr (Cordero et al. Reference Cordero Otero, Panarello, Lanzelotti and Favier Dubois2003). We also note that Gomez et al. (Reference Gómez, Borel, Aguirre and Martínez2008) measured large values of ΔR from the Quequén River estuary, as well as on the coast of Mar del Plata and Punta Mogotes in Buenos Aires Province. Both these studies demonstrate a marked influence of local factors in some locations along the Argentine coast. In southern Tierra del Fuego (Beagle Channel, Argentina) a MRE archaeological evaluation was carried out on Mytilus sp. from prehispanic shell-middens, obtaining a mean value of 551±61 14C yr BP (Albero et al. Reference Albero, Angiolini and Piana1987). This value would reflect the latitudinal variation in the MRE between Mytilidae specimens from northern Patagonia (40º/41º lat. S, this contribution) and southern Tierra del Fuego (54º lat. S). However, it is also possible that the relative low R values obtained at the San Matías Gulf might be explained in part by the high tidal range of the region, which traduces in extensive intertidal areas, and the frequent occurrence of strong winds. The conjunction of these situations would result in a more effective mixture of atmospheric CO2 with seawater resulting in a lower R values than in deeper open waters.
These studies highlight the increasing importance of MRE estimations for obtaining local representative values. Our results provide a mean value useful for correcting dates on shells from Mid-Late Holocene sites in northern Patagonia, where differences in centuries may be important for interpreting the timing and correlations of cultural events.
Acknowledgments
These investigations were funded by National Geographic Society CRE Grant 8171-07 and PIP CONICET 6415 (Argentina). The work at the University of Arizona was supported in part by NSF grant EAR 0929458. The work at Debrecen was supported by the European Union and the State of Hungary, co-financed by the European Regional Development Fund in the project of GINOP-2.3.2-15-2016-00009 ‘ICER’. We thank the anonymous reviewers for their help in improving the manuscript.