1. Introduction
The swash zone is a very dynamic region in which the flow changes rapidly from sub- to supercritical, in which the beachface is repeatedly submerged and then dried, and in which considerable sediment is also transported, as both bed and suspended load. The bed load maintains either continuous or intermittent contact with the bed (Masselink & Hughes Reference Masselink and Hughes2003), and it responds to change in flow instantaneously, as therefore does the beach itself. The velocity and volumetric rate of bed-load sediment transport are difficult to quantify, and an empirical formula is usually used to describe this process. Suspended load is transported by the flow at the flow velocity, so the primary unknown is the concentration of sediment. Since it takes time for sediment to entrain into/settle out of the water column, both suspended sediment concentration in the water column and bed change caused by suspended load cannot in general adjust immediately to change in flow (Pritchard & Hogg Reference Pritchard and Hogg2005). This means that the two modes of transport lead to a distinct swash zone morphodynamics, which governs beach evolution in this region (also known as the beachface). Earlier papers (Pritchard & Hogg Reference Pritchard and Hogg2005; Kelly & Dodd Reference Kelly and Dodd2010) have considered suspended load in isolation, or coupled bed load only with beach change. In this paper we present the first study to bring together bed- and suspended-load transport, and beach change, in a mathematical model, to describe and understand the dynamics of this region.
Sediment transport in the swash zone has been investigated in a number of field campaigns (e.g. Masselink et al. Reference Masselink, Austin, Tinker, O’Hare and Russell2008), but it is difficult to isolate physical processes in these energetic environments, and so analytical and numerical descriptions have been used to obtain an understanding of erosive and depositional processes during single swash events. The beach change under one single swash event (that of Peregrine & Williams (Reference Peregrine and Williams2001), henceforth PW01) was examined by Pritchard & Hogg (Reference Pritchard and Hogg2005) (henceforth PH05) by uncoupled simulations (i.e. simulations in which there is no feedback of bed change onto the flow within the swash event). It should be noted that the mathematical solution embodied in the PW01 event was originally derived by Shen & Meyer (Reference Shen and Meyer1963) for a wave approaching a beach; see also § 3. Pritchard & Hogg (Reference Pritchard and Hogg2005) examined only suspended load, with a series of sediment transport formulae. The results revealed the importance of settling lag (i.e. the time taken for sediment to settle out from suspension) in promoting deposition in the upper swash, as well as that of pre-suspended sediment (from the surf zone, or perhaps from the initial collapse of the bore at the base of the swash) in possibly dominating deposition. Without these effects the PW01 event was erosive for all sediment transport formulae examined.
Kelly & Dodd (Reference Kelly and Dodd2010), henceforth KD10, examined beach change under the same initial PW01 event considering bed load only but fully coupling this with bed change. This approach is equivalent to assuming no settling lag and no pre-suspended sediment. This yielded net erosion throughout the swash, consistent with PH05, but with significantly less erosion than the equivalent uncoupled simulation. Zhu & Dodd (Reference Zhu and Dodd2013) subsequently examined a range of bed-load-type formulae for PW01, as well as the influence of bed shear stress (as represented through a quadratic drag law description). All formulae yielded net erosion across the swash, although, generally, again reduced compared with equivalent uncoupled descriptions; bed shear stress was noted to reduce this erosion further (due to decreased velocities) and, especially in the mid-swash, to promote deposition, particularly if the drag coefficient in the backwash were reduced, consistent with some observations, and the beach mobility reduced accordingly.
Guard & Baldock (Reference Guard and Baldock2007) questioned the suitability of the PW01 event for describing most swash events, and presented a modified family of swash events, which allow for a more sustained flow up the beach. Pritchard (Reference Pritchard2009) examined the implications of this for erosion and deposition, noting that differences were quantitative rather than qualitative. Zhu, Dodd & Briganti (Reference Zhu, Dodd and Briganti2012) examined the beachface evolution under the swash event of Hibberd & Peregrine (Reference Hibberd and Peregrine1979), hereinafter HP79, using a similar, fully coupled, bed-load simulation to that in Kelly & Dodd (Reference Kelly and Dodd2010). This event yields large onshore momentum in the uprush (note that it is not the same as the uniform bore of Guard & Baldock (Reference Guard and Baldock2007), because the bore originates on a constant depth region). Significantly, Zhu et al. (Reference Zhu, Dodd and Briganti2012) observed the formation of a bed step (discontinuity in bed level), formed at the backwash bore (Hibberd & Peregrine Reference Hibberd and Peregrine1979).
In this paper, we aim to bring together these strands of research by developing a mathematical model of the swash zone that, for the first time, includes shallow water hydrodynamics, fully coupled bed change, bed-load transport and suspended-load transport (concentration). The purpose is to understand the roles of both modes of sediment transport in the swash, and to see how they affect beach evolution during one swash event. In particular, we focus on the development of a beach bed step, which is a common feature of the swash (Larson & Sunamura Reference Larson and Sunamura1993). To this end, we initially focus on the PW01 event, in order to allow comparison with earlier studies, and to examine the effects of bed and suspended load. Thereafter, we focus on the bed-step formation, by examining a swash event due to a solitary wave, which is a commonly used realistic model for a wave approaching the beach. We also use field measurements of beach change under single swash events on a natural beach to calibrate the unknown model parameters.
In § 2 we present the model equations. We then examine the PW01 event in § 3. In § 4 we present the solitary wave event, and in § 5 we estimate model parameters. Finally, we discuss our conclusions.
2. Model development
2.1. Governing equations
The nonlinear shallow water equations including bed shear stress described by a drag law (Soulsby Reference Soulsby1997) are utilised to describe the flow in the swash zone,
 $$\begin{eqnarray}\displaystyle & \displaystyle {\hat{h}}_{\,\hat{t}}+{\hat{u}}{\hat{h}}_{\,\hat{x}}+{\hat{h}}{\hat{u}}_{\,\hat{x}}=0, & \displaystyle\end{eqnarray}$$
 $$\begin{eqnarray}\displaystyle & \displaystyle {\hat{u}}_{\,\hat{t}}+{\hat{u}}{\hat{u}}_{\,\hat{x}}+g{\hat{h}}_{\,\hat{x}}+g\hat{B}_{\,\hat{x}}=-\frac{c_{d}|{\hat{u}}|{\hat{u}}}{{\hat{h}}}, & \displaystyle\end{eqnarray}$$
where
 $\hat{x}$
represents cross-shore distance
 $(\text{m})$
,
 $\hat{t}$
is time (s),
 ${\hat{h}}$
represents the water depth (
 $\text{m}$
),
 ${\hat{u}}$
is a depth-averaged horizontal velocity (
 $\text{m s}^{-1}$
),
 $\hat{B}$
is the bed level (
 $\text{m}$
),
 $g$
is the acceleration due to gravity (
 $\text{m s}^{-2}$
) and
 $c_{d}$
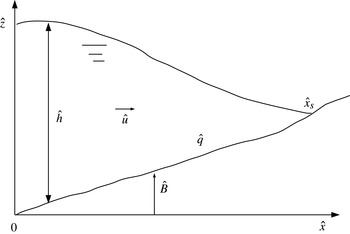
is a dimensionless drag coefficient. In figure 1 we illustrate the situation that is considered.
The bed-evolution (sediment conservation) equation including both bed and suspended load is
 $$\begin{eqnarray}\hat{B}_{\,\hat{t}}+{\it\xi}\hat{q}_{b\hat{x}}={\it\xi}(\hat{D}-{\hat{E}}),\end{eqnarray}$$
where
 $\hat{q}_{b}$
is sediment flux due to bed load (
 $\text{m}^{2}\ \text{s}^{-1}$
), which, in general, is strongly dependent on
 ${\hat{u}}$
and a weak function of
 ${\hat{h}}$
,
 $\hat{D}$
is the dimensional deposition rate (
 $\text{m s}^{-1}$
) and
 ${\hat{E}}$
is the dimensional erosion (or entrainment) rate (
 $\text{m s}^{-1}$
). Here,
 ${\it\xi}=1/(1-p)$
, where
 $p$
is the bed porosity.
The governing equation for the transport of suspended sediment is
 $$\begin{eqnarray}{\hat{c}}_{\,\hat{t}}+{\hat{u}}\,{\hat{c}}_{\,\hat{x}}=\frac{1}{{\hat{h}}}({\hat{E}}-\hat{D}),\end{eqnarray}$$
where
 ${\hat{c}}$
is volumetric concentration, and
 ${\hat{h}}{\hat{c}}$
therefore represents the volume of sediment per unit area of seabed (
 $\text{m}$
).
The Meyer-Peter–Müller formula (see Yalin Reference Yalin1977; Soulsby Reference Soulsby1997), which is commonly used in engineering problems, is employed,
 $$\begin{eqnarray}\hat{q}_{b}={\hat{A}}\left(\frac{{\hat{u}}^{2}-{{\hat{u}}_{crb}}^{2}}{{\hat{u}}_{0}^{2}}\right)^{3/2}\frac{\mid {\hat{u}}\mid }{{\hat{u}}},\end{eqnarray}$$
where
 ${\hat{u}}_{0}$
is a representative velocity scale and
 ${\hat{A}}$
is a dimensional (
 $\text{m}^{2}\ \text{s}^{-1}$
), empirically determined, representative bed-load sediment transport rate. Here,
 ${\hat{u}}_{crb}$
is the threshold velocity for sediment motion as bed load (
 $\text{m s}^{-1}$
). It should be noted that
 ${\hat{A}}=A{\hat{u}}_{0}^{3}$
, where
 $A$
is the equivalent dimensional constant of KD10.
We employ the entrainment model in Pritchard & Hogg (Reference Pritchard and Hogg2003) and Pritchard & Hogg (Reference Pritchard and Hogg2005), taking the entrainment rate
 ${\hat{E}}=\hat{m}_{e}\left(({\hat{u}}^{2}-{\hat{u}}_{crs}^{2})/{\hat{u}}_{0}^{2}\right)$
, with
 $\hat{m}_{e}$
the parameter of the sediment entrainment rate (
 $\text{m s}^{-1}$
) of suspended load and
 ${\hat{u}}_{crs}$
the threshold velocity for sediment motion as suspended load (
 $\text{m s}^{-1}$
). It should be noted that we set
 ${\hat{u}}_{crb}={\hat{u}}_{crs}=0$
in all the simulations in the present work for simplicity. We anticipate that this simplification will not significantly affect beach morphodynamics except, perhaps, for shingle beaches, whereon permeability effects not considered here are also significant; see appendix A.
The deposition rate of suspended load is (also following Pritchard & Hogg Reference Pritchard and Hogg2005)
 $\hat{D}={\hat{w}}_{s}{\hat{c}}$
, with
 ${\hat{w}}_{s}$
the effective settling velocity of suspended sediment (
 $\text{m s}^{-1}$
).
Therefore, (2.3) and (2.4) become
 $$\begin{eqnarray}\displaystyle & \displaystyle \hat{B}_{\,\hat{t}}+3{\it\xi}\frac{{\hat{A}}}{{\hat{u}}_{0}^{3}}{\hat{u}}^{2}{\hat{u}}_{\,\hat{x}}={\it\xi}\left({\hat{w}}_{s}{\hat{c}}-\hat{m}_{e}\frac{{\hat{u}}^{2}}{{\hat{u}}_{0}^{2}}\right), & \displaystyle\end{eqnarray}$$
 $$\begin{eqnarray}\displaystyle & \displaystyle {\hat{c}}_{\,\hat{t}}+{\hat{u}}{\hat{c}}_{\,\hat{x}}=\frac{1}{{\hat{h}}}\left(\hat{m}_{e}\frac{{\hat{u}}^{2}}{{\hat{u}}_{0}^{2}}-{\hat{w}}_{s}{\hat{c}}\right). & \displaystyle\end{eqnarray}$$
Schematic diagram for a general swash.

2.2. Non-dimensionalisation
The non-dimensional variables are
 $$\begin{eqnarray}x=\frac{\hat{x}}{{\hat{h}}_{0}},\quad t=\frac{\hat{t}}{{\hat{h}}_{0}^{1/2}g^{-1/2}},\quad h=\frac{{\hat{h}}}{{\hat{h}}_{0}},\quad u=\frac{{\hat{u}}}{{\hat{u}}_{0}},\quad B=\frac{\hat{B}}{{\hat{h}}_{0}}\quad \text{and}\quad c=\frac{{\hat{c}}}{{\hat{c}}_{0}},\end{eqnarray}$$
where
 ${\hat{h}}_{0}$
is a length scale,
 ${\hat{c}}_{0}$
is a reference concentration and
 ${\hat{u}}_{0}=(g{\hat{h}}_{0})^{1/2}$
.
Substitution of (2.8a−f ) into the governing equations (2.1), (2.2), (2.6) and (2.7) gives
 $$\begin{eqnarray}\displaystyle & \displaystyle h_{t}+uh_{x}+hu_{x}=0, & \displaystyle\end{eqnarray}$$
 $$\begin{eqnarray}\displaystyle & \displaystyle u_{t}+uu_{x}+h_{x}+B_{x}=-\frac{c_{d}|u|u}{h}, & \displaystyle\end{eqnarray}$$
 $$\begin{eqnarray}\displaystyle & \displaystyle B_{t}+\frac{3{\it\xi}{\hat{A}}}{{\hat{h}}_{0}(g{\hat{h}}_{0})^{1/2}}u^{2}u_{x}=\frac{{\it\xi}}{(g{\hat{h}}_{0})^{1/2}}({\hat{w}}_{s}{\hat{c}}_{0}c-\hat{m}_{e}u^{2}), & \displaystyle\end{eqnarray}$$
 $$\begin{eqnarray}\displaystyle & \displaystyle c_{t}+uc_{x}=\frac{1}{(g{\hat{h}}_{0})^{1/2}{\hat{c}}_{0}}\frac{1}{h}(\hat{m}_{e}u^{2}-{\hat{w}}_{s}{\hat{c}}_{0}c). & \displaystyle\end{eqnarray}$$
Let
 ${\hat{c}}_{0}=\hat{m}_{e}/{\hat{w}}_{s}$
,
 ${\it\sigma}={\it\xi}{\hat{A}}/({\hat{h}}_{0}(g{\hat{h}}_{0})^{1/2})$
,
 $M={\it\xi}(\hat{m}_{e}/(g{\hat{h}}_{0}^{1/2}))$
and
 ${\tilde{E}}={\hat{w}}_{s}/(g{\hat{h}}_{0}^{1/2})$
, so that (2.11) and (2.12) become
 $$\begin{eqnarray}\displaystyle & \displaystyle B_{t}+3{\it\sigma}u^{2}u_{x}=M\left(c-u^{2}\right), & \displaystyle\end{eqnarray}$$
 $$\begin{eqnarray}\displaystyle & \displaystyle c_{t}+uc_{x}=\frac{1}{h}{\tilde{E}}\left(u^{2}-c\right). & \displaystyle\end{eqnarray}$$
It should be noted that here
 ${\tilde{E}}=E\tan {\it\alpha}$
, where
 $E$
is the exchange rate parameter of Pritchard & Hogg (Reference Pritchard and Hogg2005) and
 $\tan {\it\alpha}$
is the beach slope. Therefore
 ${\tilde{E}}$
governs the response time of the suspended sediment to changes in flow conditions. Here,
 $M$
represents bed mobility with regard to suspended-load transport and
 ${\it\sigma}$
the equivalent quantity for bed-load transport.
When the sediment concentration
 $c$
is only determined by instantaneous
 $u$
, it is denoted
 $c_{eq}$
to represent suspended sediment concentration in an instantaneous equilibrium state (i.e. when there is neither erosion nor deposition); here,
 $c_{eq}=u^{2}$
. In (2.14), when
 ${\tilde{E}}/h\rightarrow \infty$
, the adjustment of
 $c$
to
 $c_{eq}$
becomes immediate. It should be noted that
 $c_{eq}=c_{eq}(x,t)$
.
The vector form of these four non-dimensional governing equations is
 $$\begin{eqnarray}\boldsymbol{U}_{t}+\boldsymbol{A}(\boldsymbol{U})\boldsymbol{U}_{x}=\boldsymbol{S},\end{eqnarray}$$
with
 $$\begin{eqnarray}\displaystyle \boldsymbol{U}=\left[\begin{array}{@{}c@{}}h\\ u\\ B\\ c\end{array}\right],\quad \boldsymbol{A}(\boldsymbol{U})=\left[\begin{array}{@{}cccc@{}}u & h & 0 & 0\\ 1 & u & 1 & 0\\ 0 & 3{\it\sigma}u^{2} & 0 & 0\\ 0 & 0 & 0 & u\end{array}\right],\quad \boldsymbol{S}=\left[\begin{array}{@{}c@{}}0\\ -\displaystyle \frac{c_{d}|u|u}{h}\\ M(c-u^{2})\\ \displaystyle \frac{1}{h}{\tilde{E}}(u^{2}-c)\\ \end{array}\right]. & & \displaystyle\end{eqnarray}$$
The eigenvalues of
 $\boldsymbol{A}$
are the roots of the polynomial equation
 $$\begin{eqnarray}({\it\lambda}-u)({\it\lambda}^{3}-2u{\it\lambda}^{2}+(u^{2}-3{\it\sigma}u^{2}-h){\it\lambda}+3{\it\sigma}u^{3})=0.\end{eqnarray}$$
The polynomial equation (2.17) has four roots, one of which,
 ${\it\lambda}_{4}\equiv u$
, corresponds to the transport of suspended load. The other three roots of (2.17) are denoted
 ${\it\lambda}_{1}$
,
 ${\it\lambda}_{2}$
and
 ${\it\lambda}_{3}$
, such that
 ${\it\lambda}_{1}\leqslant {\it\lambda}_{3}\leqslant {\it\lambda}_{2}$
. It should be noted that if
 ${\it\sigma}\neq 0$
and
 $h\neq 0$
, when
 $u>0$
, we have
 ${\it\lambda}_{1}<{\it\lambda}_{3}<{\it\lambda}_{4}<{\it\lambda}_{2}$
; when
 $u<0$
,
 ${\it\lambda}_{1}<{\it\lambda}_{4}<{\it\lambda}_{3}<{\it\lambda}_{2}$
. Moreover,
 ${\it\lambda}_{1}<0$
and
 ${\it\lambda}_{2}>0$
as long as
 ${\it\sigma}\neq 0$
. For the solution of
 ${\it\lambda}_{1}$
,
 ${\it\lambda}_{2}$
and
 ${\it\lambda}_{3}$
we refer to Kelly & Dodd (Reference Kelly and Dodd2009, Reference Kelly and Dodd2010).
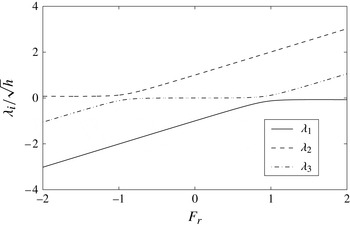
Figure 2 illustrates the variation of
 ${\it\lambda}_{1,2,3}$
characteristics with Froude number when
 ${\it\sigma}=0.01$
. It should be noted that individual characteristics,
 ${\it\lambda}_{1,2,3}$
, can ‘behave’ as hydro- or morphodynamic characteristics, depending on the Froude number. It can be seen that there are sudden changes in these roles at critical flow conditions. From simple wave theory (Jeffrey Reference Jeffrey1976), a shock exists when the characteristics of the same family intersect, and it is a
 ${\it\lambda}_{i}$
shock if it is the
 ${\it\lambda}_{i}$
characteristics that intersect.
Variation of dimensionless wave velocities with Froude number (
 $F_{r}=u/\sqrt{h}$
) for a system with bed-load transport
 $q=u^{3}$
(
 ${\it\sigma}=0.01$
).

2.3. Numerical method
The specified time interval method of characteristics (STI MOC) (Kelly & Dodd Reference Kelly and Dodd2009, Reference Kelly and Dodd2010), which can resolve shocks very accurately, is used to solve (2.9), (2.10), (2.13) and (2.14) simultaneously. As the
 ${\it\lambda}_{1,2,3}$
characteristic fields associated with (2.9), (2.10) and (2.13) are genuinely nonlinear, and the
 ${\it\lambda}_{4}$
associated with (2.14) is genuinely linear, (2.9), (2.10) and (2.13) are combined to obtain total derivatives (i.e. the characteristic form) of
 $h$
,
 $u$
and
 $B$
with respect to time, and (2.14) is used to find the total derivative of
 $c$
with respect to time. Thus,
 $$\begin{eqnarray}\text{Re}^{(k)}={\it\lambda}_{k}\frac{\text{d}u}{\text{d}t}+\frac{{\it\lambda}_{k}}{{\it\lambda}_{k}-u}\frac{\text{d}h}{\text{d}t}+\frac{\text{d}B}{\text{d}t}=-{\it\lambda}_{k}\frac{c_{d}|u|u}{h}+M(c-u^{2}),\quad \text{along }\frac{\text{d}x}{\text{d}t}={\it\lambda}_{k},\quad k=1,2,3,\end{eqnarray}$$
and (2.14) is written as the total derivative of
 $c$
with respect to time,
 $$\begin{eqnarray}\frac{\text{d}c}{\text{d}t}=\frac{1}{h}{\tilde{E}}(u^{2}-c),\quad \text{along }\frac{\text{d}x}{\text{d}t}={\it\lambda}_{4}=u.\end{eqnarray}$$
These four equations of (2.18) and (2.19) are solved numerically to obtain
 $h$
,
 $u$
,
 $B$
and
 $c$
in the combined load system.
2.3.1. Initial conditions
Initial conditions are given for each case examined, but one general point concerns initial values for
 $c$
and
 $B$
. Any pre-suspended sediment must be included as an initial condition:
 $c=c(x,0)$
. It should be noted that, depending on whether
 $c(x,0)$
is less than or greater than
 $c_{eq}$
, the initial
 $B$
will immediately erode or accrete due to suspended load. Here,
 $c(x,0)=c_{eq}$
in all simulations unless otherwise specified.
2.3.2. Seaward boundary condition
The seaward boundary is chosen so as to be far enough away from the shore that
 $h$
and
 $u$
at that point are uninfluenced by any wave reflected from the shore throughout the computation time. Consequently, the seaward boundary is chosen at
 $x=-150$
. It should be noted that for both events examined there is therefore a region of uniform flow adjacent to this boundary, in which the flow can be specified analytically. Other dependent variables at the seaward boundary may be extrapolated from values at neighbouring points. Thus, we have
 $h(-150,t)=h_{off}$
and
 $u(-150,t)=u_{off}-\tan {\it\alpha}_{off}t$
, where
 $\tan {\it\alpha}_{off}$
is the bed slope at
 $x=-150$
, and
 $B$
and
 $c$
are extrapolated from neighbouring points. It should be noted that this boundary is therefore not specified based on incoming and outgoing characteristics, although characteristics at this location can be calculated straightforwardly.
2.3.3. Wet–dry boundary treatment
At the tip (shoreline),
 $x=x_{s}(t)$
,
 $h(x_{s})=0$
and
 $c(x_{s})=c_{eq}=u_{s}^{2}$
. For the solution of
 $x_{s}$
,
 $u_{s}=u(x_{s})$
and
 $B_{s}=B(x_{s})$
we refer the reader to Zhu & Dodd (Reference Zhu and Dodd2013).
2.4. Shock conditions
For derivations of shock conditions for mass and momentum conservation we refer to Kelly & Dodd (Reference Kelly and Dodd2010) and Zhu et al. (Reference Zhu, Dodd and Briganti2012); the shock conditions are
 $$\begin{eqnarray}\displaystyle & h_{R}u_{R}-h_{L}u_{L}-(h_{R}-h_{L})W=0, & \displaystyle\end{eqnarray}$$
 $$\begin{eqnarray}\displaystyle & \displaystyle W(h_{R}u_{R}-h_{L}u_{L})-\left(h_{R}u_{R}^{2}+\frac{h_{R}^{2}}{2}-h_{L}u_{L}^{2}-\frac{h_{L}^{2}}{2}\right)-\frac{1}{2}(B_{R}-B_{L})(h_{R}+h_{L})=0,\qquad & \displaystyle\end{eqnarray}$$
where
 $L$
and
 $R$
represent variables on the left and right sides of a shock, and
 $W$
is the shock velocity.
For the bed evolution, the change of bed level in the fixed domain [
 $x_{1}$
,
 $x_{2}$
] is balanced by the net sediment flux into (out of) that domain, and also the net sediment settlement onto (or entrainment from) it, thus
 $$\begin{eqnarray}\frac{\text{d}}{\text{d}t}\int _{x_{1}}^{x_{2}}B\text{d}x+[{\it\sigma}u^{3}]_{x_{1}}^{x_{2}}=\int _{x_{1}}^{x_{2}}M(c-u^{2})\text{d}x.\end{eqnarray}$$
Here, it is also assumed that a shock located at
 ${\it\zeta}(t)$
lies between
 $x_{1}$
and
 $x_{2}$
, i.e.
 $x_{1}<{\it\zeta}<x_{2}$
. In the limit
 $x_{1}\rightarrow {\it\zeta}$
and
 $x_{2}\rightarrow {\it\zeta}$
, (2.22) becomes
 $$\begin{eqnarray}-W[B]_{x_{1}}^{x_{2}}+[{\it\sigma}u^{3}]_{x_{1}}^{x_{2}}=0.\end{eqnarray}$$
It is found that suspended load has no contribution to the shock condition for the bed evolution.
The suspended sediment in the water column in the domain [
 $x_{1}$
,
 $x_{2}$
] is balanced by the net suspended sediment flux inflow across the
 $x_{1}$
and
 $x_{2}$
sections and the entrainment from (settlement onto) the bed, thus
 $$\begin{eqnarray}\displaystyle & \displaystyle \frac{\text{d}}{\text{d}t}\int _{x_{1}}^{x_{2}}(hc)\text{d}x+[huc]_{x_{1}}^{x_{2}}=\int _{x_{1}}^{x_{2}}M(u^{2}-c)\text{d}x & \displaystyle \nonumber\\ \displaystyle & \Rightarrow \ [-hcW+hcu]_{x_{1}}^{x_{2}}=0. & \displaystyle\end{eqnarray}$$
 $$\begin{eqnarray}\displaystyle & (B_{R}-B_{L})W-{\it\sigma}(u_{R}^{3}-u_{L}^{3})=0, & \displaystyle\end{eqnarray}$$
 $$\begin{eqnarray}\displaystyle & h_{R}c_{R}(u_{R}-W)-h_{L}c_{L}(u_{L}-W)=0. & \displaystyle\end{eqnarray}$$
It should be noted that the shock condition of the bed evolution (2.25) in the combined load system is identical to that without suspended load in Kelly & Dodd (Reference Kelly and Dodd2010).
For a
 ${\it\lambda}_{1,2,3}$
shock, if
 $h_{L}\neq 0$
,
 $h_{R}\neq 0$
,
 $u_{L}\neq W$
and
 $u_{R}\neq W$
, from (2.20), the shock condition for the transport of suspended load (2.26) is simplified as
 $$\begin{eqnarray}c_{R}-c_{L}=0.\end{eqnarray}$$
This implies that the sediment concentration across a
 ${\it\lambda}_{1,2,3}$
shock is continuous, and it is determined by the genuinely linear characteristic field associated with the transport of suspended sediment.
For a
 ${\it\lambda}_{4}$
shock, which is a contact wave, we have
 $h_{L}=h_{R}$
,
 $u_{L}=u_{R}$
,
 $B_{L}=B_{R}$
and
 $c_{L}\neq c_{R}$
.
For the shock fitting method, we refer the reader to Kelly & Dodd (Reference Kelly and Dodd2010), who have described the technique in great detail.
2.5. Model testing
The model is verified against both suspended- and bed-load-only models. In appendix B, we compare with the PH05 results, which are for suspended load, on a nearly fixed bed. Testing of the bed-load-only model is presented in Zhu et al. (Reference Zhu, Dodd and Briganti2012).
3. PW01 swash event
In this section, we aim to elucidate the effects of bed and suspended load as represented by
 ${\it\sigma}$
,
 $M$
and
 ${\tilde{E}}$
by modelling a swash event morphodynamically. We examine the PW01 event here. As noted earlier, although this event is not considered representative of many swash events (Guard & Baldock Reference Guard and Baldock2007), in terms of sediment transport it can be considered to be qualitatively similar (Pritchard Reference Pritchard2009). Furthermore, its use allows us to verify against earlier work (see appendix B), and also to examine a swash event in which no significant interior shock formation takes place. Therefore, we consider a swash event with the same initial conditions as the PW01 swash, which then evolves morphodynamically; we refer to it hereafter as the PW01 event. It should be noted that this shoreline motion was originally derived by Shen & Meyer (Reference Shen and Meyer1963). We refer to it here as the PW01 event because these authors, who extended the analytical solution for the shoreline motion to the whole swash and examined overtopping due to this event, provided it in a more accessible form, and made the connection with the same swash motion as the result of a dam-break problem, which interpretation we make use of as our initial condition.
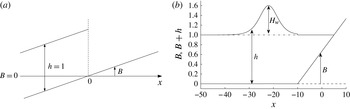
The initial conditions of the PW01 swash are described by a dam-break problem over an erodible beach of initially uniform slope
 $B=\tan {\it\alpha}_{off}x=0.1x$
(Kelly & Dodd Reference Kelly and Dodd2010) (see figure 3). The dam is situated at
 $x=0$
with still water on the seaward side and none on the shoreward side. The water depth behind the dam is
 $h\,(x<0,t=0)=1$
. The dam is assumed to collapse at
 $t=0$
, and the flow is dominated by gravity.
Initial conditions for PW01 (a) and solitary wave swash (b).

3.1. Suspended load
A suspended-load-only simulation is achieved by setting the bed mobility parameter for bed load
 ${\it\sigma}=0$
in the combined load model.
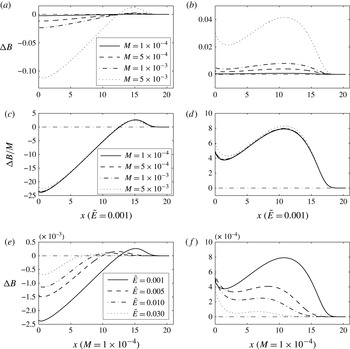
The final bed changes after one swash event for various
 $M$
values (
 ${\it\sigma}=0$
) with and without pre-suspended sediment are shown in figure 4(a,b). The effect of varying
 $M$
can be seen. For
 ${\it\sigma}=0$
, (2.13) shows the linear relationship between bed change and suspended-load mobility
 $M$
: as long as the flow remains largely unaffected by the bed change (
 ${\tilde{E}}$
is constant),
 $c$
will remain similarly unaffected by varying
 $M$
, and a change in
 $M$
results in a similar but amplified pattern of erosion and deposition, i.e.
 ${\rm\Delta}B\propto M$
(where
 ${\rm\Delta}B$
is the change in the bed level). The swash flow is largely unaffected by suspended load, see figure 22 in appendix D. This point is illustrated in figure 4(c,d), which shows the normalised beach changes against
 $M$
, both with and without pre-suspended sediment. Only for
 $M=0.005$
do we see a noticeable change in the resulting beach change profile (see figure 4
c,d).
(a,b) Bed change after one PW01 swash event for various
 $M$
values (
 ${\tilde{E}}=0.001$
), for (a) only locally entrained sediment and (b) both locally and pre-suspended sediment (
 $c_{0}=1$
). (c,d) Bed changes for the same simulations shown, respectively, in (a) and (b), normalised by
 $M$
. (e,f) Bed changes after one PW01 swash event for various
 ${\tilde{E}}$
values (
 $M=1\times 10^{-4}$
), for (e) only locally entrained sediment and ( f) both locally and pre-suspended sediment (
 $c_{0}=1$
)
.

The effect of
 ${\tilde{E}}$
on the net sediment flux was discussed in depth by Pritchard & Hogg (Reference Pritchard and Hogg2005). In figure 4(e,f), we show a variety of resulting profiles for different values of
 ${\tilde{E}}$
, now with a fully mobile bed. As
 ${\tilde{E}}$
increases there is less net movement overall. This is due to the erosion/deposition term in (2.13) (
 $c-u^{2}$
) being near zero for larger
 ${\tilde{E}}$
(consistent with PH05) for most of the swash event, because
 $c\approx c_{eq}$
(because of the more rapid adjustment as
 ${\tilde{E}}$
increases). Therefore, overall beach change is reduced (for fixed
 $M$
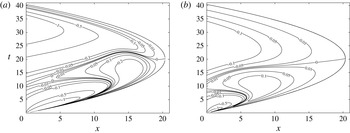
) (see also figure 21 for verification against PH05 in terms of net fluxes). This is illustrated in figure 5.
Contour plots for
 $c-u^{2}$
for the simulations in figure 4: (a)
 ${\tilde{E}}=0.001$
; (b)
 ${\tilde{E}}=0.03$
.

Additionally, when pre-suspended sediment is present (figure 4
f) the net change increasingly favours deposition at the base of the swash. This is again consistent with PH05, and stems from the fast response time for larger
 ${\tilde{E}}$
causing initially entrained sediment to be immediately deposited (in the lower swash).
When no pre-suspended sediment is present (figure 4
e) the proportion of deposited to eroded sediment volume (deposited volume/eroded volume) for
 $x>0$
varies from 0.06 (
 ${\tilde{E}}=0.03$
) to 0.05 (
 ${\tilde{E}}=0.001$
), peaking at approximately 0.07 (
 ${\tilde{E}}\approx 0.01$
) in between. It should be noted that Pritchard & Hogg (Reference Pritchard and Hogg2005) also observed a peak in the maximum positive net flux across the swash zone caused by locally entrained sediment, which essentially is a measure of the total amount of deposition in the swash zone. Moreover, the work of Pritchard & Hogg (Reference Pritchard and Hogg2005) (see figure 11a,c of PH05) has further indicated a peak value in the proportion of deposited to eroded sediment flux/volume. For
 ${\tilde{E}}\rightarrow \infty$
, this ratio tends to
 $0$
, as expected.
3.2. Suspended and bed load
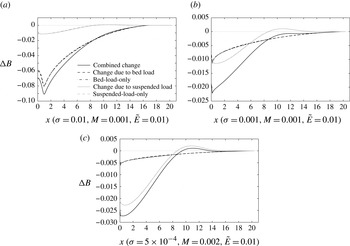
If we include both suspended and bed load we can now examine their effects on the beach during this event. The final bed changes in three combined load simulations are shown in figure 6, and correspond to beaches in which either bed or suspended load is dominant, or they are approximately equal. Also shown are the bed changes caused by the equivalent bed-load-only and suspended-load-only simulations, and that due only to those same components of the combined load simulation. It should be noted that, for the parameters chosen here, each mode of sediment transport has little effect on the other, and each has a distinct morphodynamical signature, and these are consistent with the results of Pritchard & Hogg (Reference Pritchard and Hogg2005) and Kelly & Dodd (Reference Kelly and Dodd2010).
Bed changes in the combined load simulations and comparisons with bed-load-only and suspended-load-only simulations after one single PW01 swash: (a) bed-load dominance; (b) bed- and suspended-load approximate parity; (c) suspended-load dominance.

4. Swash event with shock formation
In this section, a swash event that involves shock formation in the swash zone is simulated to examine the effect of a more representative swash event on an erodible beach, and, in particular, to study the bed-step development associated with the backwash bore (Hibberd & Peregrine Reference Hibberd and Peregrine1979; Zhu et al. Reference Zhu, Dodd and Briganti2012). Initially we exclude bed shear stress, and focus on the shallow water dynamics and backwash bore and bed-step developments, and consider what happens when the shoreline encounters this feature. Thereafter we introduce bed shear stress and consider the shock dynamics that contributes to the bed-step development. A swash event driven by a solitary wave is examined. The event represents a simplified but physically appropriate model of a surface gravity wave encountering a beach.
4.1. Solitary wave event
A solitary wave of height
 $H_{w}=0.6$
on a still water depth of
 $h_{st}=1$
, with its crest located at
 $x=-22$
when
 $t=0$
, is considered, see figure 3. In the region
 $x\leqslant -10$
the bed is flat (
 $\tan {\it\alpha}_{off}=0$
), while for
 $x\geqslant -10$
the beach is of a uniform slope
 $\tan {\it\alpha}=0.0667$
. For
 $x\geqslant -10$
,
 $h(x,t=0)=1-\tan {\it\alpha}(x+10)$
,
 $u(x,t=0)=0$
and
 $B(x,t=0)=\tan {\it\alpha}(x+10)$
. In the region
 $x<-10$
, the water depth is determined according to the surface profile for a solitary wave given by Mei (Reference Mei1990), with
 $h(x<-10,t=0)=1+H_{w}\ \text{sech}^{2}(0.3\left((3H_{w})/(4h_{st}^{3})\right)^{1/2}(x+22))$
. The water velocity is then determined by the hydrodynamic Riemann invariant along the backward characteristic:
 $u(x<-10,t=0)=2(\sqrt{h(x,t=0)}-1)$
. The bed level is adjusted to the water flow with
 $B(x<-10,t=0)={\it\sigma}((u(x,t)^{3})/\sqrt{h(x,t)})$
. However, the water flow is assumed not to be affected by the bed change at the initial time. Across the domain,
 $c(x,t=0)=c_{eq}(x,t=0)=u^{2}(x,t=0)$
is assumed.
4.2. Simulation without bed shear stress
The flow structure as a solitary wave travels shorewards over an erodible beach (
 ${\it\sigma}=0.01$
,
 $M=0.001$
and
 ${\tilde{E}}=0.01$
) simulated by the combined load model is shown in figure 7. When the solitary wave travels shorewards, it breaks and forms a shock (bore) travelling to the shore. The shock then collapses at the initial shoreline position (
 $x=5$
), and then the water climbs up the dry beach. The water velocity reaches its maximum when the shock collapses, and then decreases when the flow climbs up the dry beach. The flow (in the region
 $x>5$
) is similar to that in the PW01 swash (cf. figures 7
a and 22). This is because the wave breaks at the base of the swash with little water momentum behind it, similarly to the PW01 event (see Guard & Baldock Reference Guard and Baldock2007).
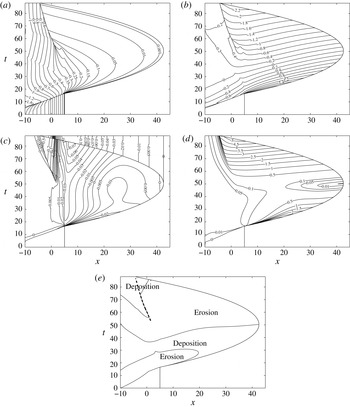
Contour plots for the combined load solitary wave swash simulation over an erodible beach (
 ${\it\sigma}=0.01$
,
 $M=0.001$
and
 ${\tilde{E}}=0.01$
): (a)
 $h$
; (b)
 $u$
; (c)
 ${\rm\Delta}B$
; (d)
 $c$
; (e) instantaneous deposition/erosion distribution due to suspended load. The thick black dashed line in (e) represents the backwash bore path.

The bore collapse at
 $x=5$
causes considerable entrainment into the water column, which is then moved onshore. Erosion prevails at the base throughout the computation time; see figure 7(c). In the early uprush,
 $c<c_{eq}$
in the lower swash, and so sediment is transported to the upper swash (figure 7
d,e). Conversely, in the later stages of the uprush,
 $c>c_{eq}$
, and suspended sediment begins to settle out and
 $c$
decreases. The overall picture is similar to that depicted for moderate/small
 ${\tilde{E}}$
values by Pritchard & Hogg (Reference Pritchard and Hogg2005).
It should be noted that at the shoreline
 $c=c_{eq}=u_{s}^{2}$
and at the maximum inundation it is 0. This is because as the tip is approached
 ${\tilde{E}}/h\rightarrow \infty$
, so that there is an instantaneous adjustment of
 $c$
to
 $c_{eq}$
. For the whole backwash (for
 $x>5$
),
 $c<c_{eq}$
, and sediment is entrained into the water column and moved seawards, and the beach is eroded; see figure 7(d,e).
Bed-load transport results in erosion everywhere (not shown) (because
 ${q_{b}}_{x}>0$
everywhere), except at the shoreline, where there is instantaneous increase (decrease) in
 $B$
due to the sediment bore advancing (receding) (see Kelly & Dodd Reference Kelly and Dodd2010; Zhu et al.
Reference Zhu, Dodd and Briganti2012).
The shoreline reaches the maximum inundation
 $x\approx 42.6$
at
 $t\approx 50.3$
. The accelerating offshore flow rapidly becomes supercritical, and, flowing into slowly retreating deeper water, results in a backwash bore (Hibberd & Peregrine Reference Hibberd and Peregrine1979; Guard & Baldock Reference Guard and Baldock2007; Antuono & Hogg Reference Antuono and Hogg2009; a hydraulic jump), which is also found in the morphodynamic bed-load-only simulations for the HP79 swash event (Zhu et al.
Reference Zhu, Dodd and Briganti2012). The development of a backwash bore can be seen in figure 7(a,b). The strength gradually increases, with increasing differences in
 $h$
,
 $u$
and
 $B$
on the two sides of the shock, and therefore leads to the development of a bed step coincident with the bore; this shock moves offshore and gradually slows. The shoreline eventually catches up with this shock, leading to a fully developed bed step at the base of a dry beach; see § 4.3.
Across the shock
 $u$
is discontinuous, and is
 $c$
continuous, (2.20), (2.21) and (2.27), which results in entrainment and erosion (deposition and accretion) on the shoreward (seaward) side of the bed step as (from) suspended load (see (2.13)). This continues until the sediment concentration
 $c$
on the shoreward side exceeds
 $c_{eq}$
, at which point the boundary between suspended-load erosion and accretion departs from the shock path (figure 7
e).
It is the bed load that is most closely linked with the bed-step development, however, as this responds instantly to all flow changes in the vicinity of the shock. Across the shock the massively different bed-load transport rates (
 $q_{b}$
) result in accretion immediately seaward of the shock, and development and offshore propagation of the bed step. It should be noted, however, that shoreward of the shock there is also local accretion due to convergence of bed-load transport. This is caused by corresponding initially small gradients in
 $u$
(figure 7
b) shoreward of the shock, which instantly affect
 $q_{b}$
(unlike
 $q_{s}$
), leading to local deposition. Thus, the bed step both advances seawards and grows in height.
It should be noted that although suspended load can affect a moving bed discontinuity through changed erosion/accretion rates across the shock, and by modifying the beach profile generally, the bed-step height and velocity are directly linked to bed-load transport (as long as
 $W\neq 0$
; see (2.25)).
4.3. Analysis of when the shoreline catches up with the backwash bore
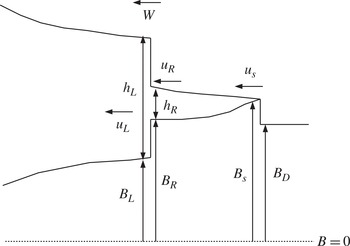
In the simulation without bed shear stress, the shoreline eventually catches up with the backwash bore. As there is a sediment bore at the shoreline, this is a shock–shock collision. In this situation there are three regions, with the rightmost being dry, and in which the right shock (the shoreline) is wet–dry and the left (backwash bore/bed step) is a wet–wet shock; see figure 8.
Schematic diagram for two-shock collision.

As the two shocks come closer, the middle region gradually vanishes, and in the limiting case this region converges to one point, such that the values of dependent variables on the left and right extremities of this region become equal. Therefore, at the moment of the two shocks colliding, the middle region is assumed to disappear and the flow has only one newly formed discontinuity; however, the shock conditions are then usually not satisfied at this new discontinuity, which is therefore not stable and collapses, with the resulting states found by solution of a local Riemann problem. This is not pursued here.
As the middle region width tends to
 $0$
,
 $h_{R}\rightarrow 0$
and
 $u_{R}\rightarrow \text{d}x_{s}/\text{d}t=u_{s}$
. As the numerical code cannot proceed when the two shocks are very close, the numerical solution is only an approximation for the case of zero middle region width. The analytical solution for the backwash bore (appendix E), of which one side is a nearly dry bed but with water of finite velocity, can be utilised to obtain the limit flow structure right before the shock collision.
From appendix E, when the shoreline approaches the backwash bore
 $$\begin{eqnarray}B_{R}-B_{L}\rightarrow h_{L}-h_{R}\rightarrow h_{L}.\end{eqnarray}$$
Across the sediment bore at the shoreline we have
 $B_{D}=B_{R}-{\it\sigma}u_{s}^{2}$
. Thus, as the shoreline approaches the bed step
 $$\begin{eqnarray}B_{D}-B_{L}=B_{D}-B_{R}+B_{R}-B_{L}=h_{L}-{\it\sigma}u_{s}^{2}.\end{eqnarray}$$
Therefore, the resulting (post-collision, unstable) bed-step height will be slightly lower than the water depth on the seaward side
 $h_{L}$
. The water on the seaward side may overtop the bed step, depending on the velocity and also bed mobility.
4.4. The inclusion of bed shear stress
The contour plots for the solitary wave simulation with bed shear stress (
 ${\it\sigma}=0.01$
,
 $M=0.001$
,
 ${\tilde{E}}=0.01$
and
 $c_{d}=0.01$
) are shown in figure 9. It should be noted that the shoreline does not recede in the backwash (Antuono, Soldini & Brocchini Reference Antuono, Soldini and Brocchini2012; Zhu & Dodd Reference Zhu and Dodd2013), because of bed friction, and the swash zone is always wet once wetted. It should be noted that the corresponding swash period is much longer than for
 $c_{d}=0$
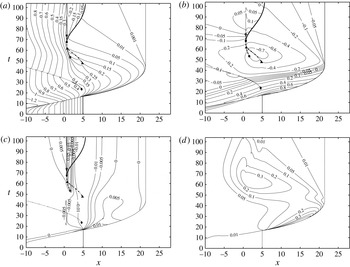
. The flow structure in the uprush is similar to that in the simulation without bed shear stress, with an overall deeper flow and smaller velocity. However, bed shear stress greatly reduces the seaward velocity of the backwash flow, and the backwash duration exceeds that of the uprush. The bed shear stress also modifies the flow structure in the backwash, and more shocks are formed in the backwash. The shock paths (including inception and termination points) are illustrated in figure 9(a–c). It should be noted that the first shock to form (a
 ${\it\lambda}_{1}$
shock) does so at about
 $t=23.5$
. It quickly propagates offshore, and has no influence on the subsequent bed-step development, so we ignore it hereafter. It should be noted that the values of
 $c$
in figure 9(d) are considerably reduced compared with those in figure 7(d), especially during the backwash, consistent with reduced backwash velocities.
Contour plots for solitary wave simulations with bed shear stress over an erodible beach (
 ${\it\sigma}=0.01$
,
 $M=0.001$
,
 ${\tilde{E}}=0.01$
and
 $c_{d}=0.01$
): (a)
 $h$
; (b)
 $u$
; (c)
 ${\rm\Delta}B$
; (d)
 $c$
. In (a–c) we show the shock paths of the
 ${\it\lambda}_{3}$
and
 ${\it\lambda}_{2}$
shocks, with their points of inception and termination. Dotted line:
 ${\it\lambda}_{1}$
shock; dot-dashed line: first
 ${\it\lambda}_{3}$
(weak) shock; dashed line: second
 ${\it\lambda}_{3}$
shock (backwash bore); solid line:
 ${\it\lambda}_{2}$
shock.

In the backwash, a bore (
 ${\it\lambda}_{3}$
shock) develops (the backwash bore), which initially travels seawards (see figure 9). This is a robust feature of the backwash (see also figure 7
a). At
 $t\approx 61.4$
, another weaker
 ${\it\lambda}_{3}$
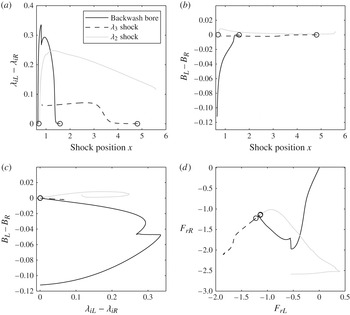
shock collides with the backwash bore. Here, we treat the shock collision by neglecting the weaker shock when it is in close proximity to the backwash bore. This approach shows good agreement with the idealised Riemann solution. The collision increases the backwash bore (
 ${\it\lambda}_{3}$
) shock strength slightly; see figure 10. Thereafter, the backwash bore slows, and decreases in strength (see figure 10).
Shock strength and Froude number for
 ${\it\lambda}_{2}$
and
 ${\it\lambda}_{3}$
shocks in the backwash. A ○ represents the inception of a shock.

At
 $t\approx 67.7$
, a
 ${\it\lambda}_{2}$
shock develops on the shoreward side of the backwash bore/bed step, the strength of which rapidly increases (see figure 10), and which propagates shorewards, as the flow in the later backwash diminishes. Thereafter it diminishes and slows, in effect re-establishing a ‘shoreline’ boundary between the sea and water still draining back. It should be noted that, as with all morphodynamical shocks, this
 ${\it\lambda}_{2}$
shock is accompanied by a bed discontinuity, which travels with the shock, but which is much smaller than the bed step associated with the original
 ${\it\lambda}_{3}$
backwash bore/bed step; see figure 10.
At
 $t\approx 73.9$
, the backwash bore/bed step (
 ${\it\lambda}_{3}$
shock) is brought to rest:
 $W=0$
. This is the point of reversal. From the shock conditions, a bed discontinuity with
 $W=0$
exists only when
 $u_{L}=u_{R}=0$
. Furthermore,
 $h_{L}+B_{L}=h_{R}+B_{R}$
when
 $W=0$
, indicating the continuous surface level across the bed step (
 ${\it\lambda}_{3}$
shock) at the point of stationary state. Thus, there is at this instant only the bed step, and an associated change in depth, with other quantities being continuous. Thereafter
 $u_{L}$
and
 $u_{R}$
increase, but the backwash bore (
 ${\it\lambda}_{3}$
shock) vanishes, because the characteristics on either side of the bed step diverge, thus allowing the shock conditions only to be satisfied by a non-physical shock (i.e., one with diverging characteristics). Mathematically, the structure at the former bed-step position after reversal could be derived from an idealised dam-break problem, and (seaward to shoreward) is a
 ${\it\lambda}_{1}$
shock, a
 ${\it\lambda}_{3}$
rarefaction fan and a
 ${\it\lambda}_{2}$
shock. The rarefaction fan is almost stationary, and the change in variables across it is much larger than that across the two (weak) shocks (which are not shown here). Thus, the previous bed discontinuity acquires a continuous structure; however, the observed bed-step profile is little changed.
This process of the original seaward moving
 ${\it\lambda}_{3}$
shock (backwash bore/bed step) slowing, and the creation of a fast-moving mainly hydrodynamical
 ${\it\lambda}_{2}$
shock, is equivalent to the reversal of a hydraulic jump on an immobile bed but here results in a bed step (Larson & Sunamura Reference Larson and Sunamura1993) feature being left, almost inert, on the lower beachface as the hydraulic jump reverses. Finally, it should be noted that all three shocks are formed at approximately critical conditions (
 $F_{r}\approx -1$
) (figure 10
d). It is for these conditions that the dispersion curves for the
 ${\it\lambda}_{2}$
and
 ${\it\lambda}_{3}$
waves (figure 2) change slope rapidly, implying that relatively small changes in flow may result in convergence of characteristics. Further, it should be noted that as an initially small shock passes through critical conditions it is likely to grow, for the same reason (it should be noted that the definition of shock strength here is the jump in characteristic slope across the shock); see also figure 10(a,d). It should be noted that the weak
 ${\it\lambda}_{3}$
shock does not pass through critical conditions.
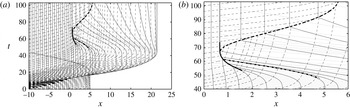
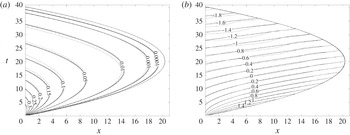
Finally, in figure 11 we show the characteristic fields associated with the shock dynamics described above. The characteristic convergence and shock formation can clearly be seen.
Characteristics diagram for the solitary wave simulation with bed shear stress: (a) for the whole domain; (b) for the vicinity of the reversing shock. Grey solid lines:
 ${\it\lambda}_{1}$
characteristics; black dashed line:
 ${\it\lambda}_{2}$
characteristics; black solid lines:
 ${\it\lambda}_{3}$
characteristics. The thick black solid, dashed, dash-dotted and dotted lines represent the paths of the backwash bore,
 ${\it\lambda}_{2}$
shock,
 ${\it\lambda}_{3}$
shock and
 ${\it\lambda}_{1}$
shock, respectively.

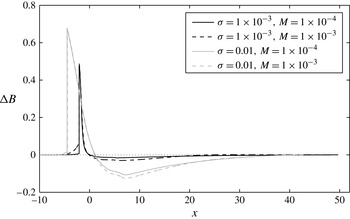
Final beach changes for solitary wave simulations without bed shear stress for two different values of
 ${\it\sigma}$
and
 $M$
.

4.5. Final beach change and bed-step development
The beach changes due to different
 ${\it\sigma}$
, and
 $M$
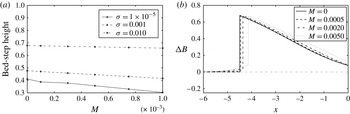
when the shoreline catches up with the backwash bore in the simulations without bed shear stress are shown in figure 12. For all the cases examined, a bed step forms, the height of which decreases as
 ${\it\sigma}$
decreases. The bed-step height decreases slightly as
 $M$
increases, due almost entirely to the increased bed level on the seaward side of the bed step, which itself is due to greater sediment deposition for increased
 $M$
. Thus, bed load (
 ${\it\sigma}$
) dictates crest level (figure 12), but suspended load (
 $M$
) can affect height. This is also shown by figure 13. The effect of
 $M$
on the step height is not large compared with that of
 ${\it\sigma}$
, but becomes more pronounced for small
 ${\it\sigma}$
. It should be noted, however, that these heights refer to the size of the jump in
 $B$
(
 $B_{R}-B_{L}$
); the overall prominence of the step is dictated by
 ${\it\sigma}$
(figure 13). One should note also the increased erosion shoreward of the step for larger
 $M$
(figure 12).
Bed-step heights and final beach changes for solitary wave simulations without bed shear stress for different
 ${\it\sigma}$
and
 $M$
values (
 ${\tilde{E}}=0.01$
);
 ${\it\sigma}=0.01$
in (b).

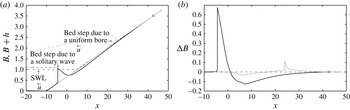
To examine the importance of the swash event to the bed-step generation, the final water surface profiles and bed changes for both the present solitary wave simulation and the HP79 swash (see Zhu et al.
Reference Zhu, Dodd and Briganti2012) (both for
 $c_{d}=0$
) are illustrated in figure 14. It should be noted that both events have the same wave height, but that the HP79 event is essentially an adjustment in water level, so that the backwash (and therefore backwash velocities) is (are) much reduced compared with the uprush. It should be noted also that the bed steps for the solitary wave case including friction (figure 15), in which backwash velocities are significantly reduced and no longer dependent solely on maximum run-up, are consistent with those for the frictionless HP79 case. The bed-step heights in both swashes are close to but slightly smaller than the water depths due to the sediment bore at the tip, consistent with the analysis in § 4.3.
Beach profiles (a) and changes (b) under a solitary wave (black) and the HP79 swash (grey) with
 ${\it\sigma}=0.01$
,
 $M=0.001$
and
 ${\tilde{E}}=0.01$
(
 $c_{d}=0$
).

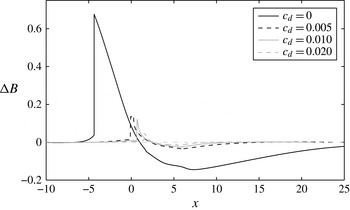
In figure 15, we show final bed changes for various
 $c_{d}$
values. (Profiles are deemed ‘final’ when
 $h_{R}\leqslant 0.006$
, where here
 $h_{R}$
is the water depth on the shoreward side of the shock nearest to the shoreline.) Increasing bed friction strongly influences the bed-step development, both the step size and its location, by reducing backwash velocities, and thereby the
 ${\it\lambda}_{3}$
shock strength and its accompanying bed-step size. Finally, it should be noted that the bed step shown in figure 15 (except that for
 $c_{d}=0$
) is no longer a discontinuity, but in fact a rapid variation in
 $B$
.
Final beach changes for solitary wave simulations with bed shear stress for various
 $c_{d}$
values (
 ${\it\sigma}=0.01$
,
 $M=0.001$
and
 ${\tilde{E}}=0.01$
).

5. Estimation of
 $M$
and
${\it\sigma}$
from field experiments


Finally, we note that it is difficult to evaluate
 $M$
for real beaches (
 ${\tilde{E}}$
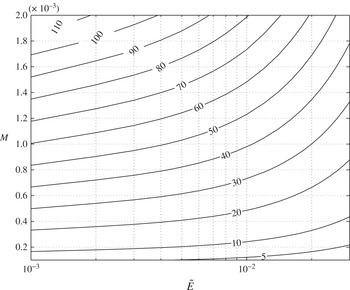
may more straightforwardly be evaluated from settling velocities). In an attempt to do this we present figure 16, in which we show a contour plot of net onshore flux of suspended sediment entrained in the uprush only at a location in the mid-swash (
 $x=13$
) of the solitary wave swash event (
 $Q_{en,up}(13)$
; see appendix C for the definition of net flux
 $Q$
) with bed shear stress (
 $c_{d}=0.01$
) as a function of
 $M$
and
 ${\tilde{E}}$
. This position is roughly equivalent to that of the sediment traps in Masselink & Hughes (Reference Masselink and Hughes1998) and Hughes, Masselink & Brander (Reference Hughes, Masselink and Brander1997). Both studies, which were for grain sizes and beach slopes of, respectively, 0.5 mm and 0.14, and 0.3 mm and 0.12, yielded representative average onshore fluxes in moderate wave conditions of
 ${\sim}30\ \text{kg m}^{-1}$
over one swash uprush. Thus, a grain size of 0.4 mm (
 $w_{s}\approx 0.05\ \text{m s}^{-1}\Rightarrow {\tilde{E}}\approx 0.02$
if
 ${\hat{h}}_{0}=1\ \text{m}$
) corresponds to a value of
 $M\approx 0.001$
.
Contour plot of dimensional suspended-load flux
 $\hat{Q}_{en,up}\,{\it\rho}_{s}{\hat{h}}_{0}^{2}{\hat{c}}_{0}Q_{en,up}\,(x=13)$
as a function of
 ${\tilde{E}}$
and
 $M$
after the uprush of one single solitary wave swash with
 $c_{d}=0.01$
(units:
 $\text{kg m}^{-1}$
).

As with determining
 $M$
, determining
 ${\it\sigma}$
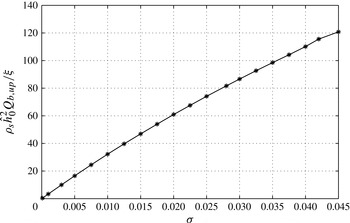
is an uncertain process, but its effect can be quantified similarly to that of
 $M$
in the variation of the net uprush bed-load flux
 $$\begin{eqnarray}Q_{b}(x)=\int _{t_{in}}^{t_{de}}{\it\sigma}u^{3}\text{d}t\end{eqnarray}$$
in the mid-swash (where
 $t_{in}$
(
 $t_{de}$
) is the time of inundation (denudation)); see figure 17. A net flux of
 $30\ \text{kg m}^{-1}$
due to bed load thus corresponds to
 ${\it\sigma}\approx 0.01$
. Further, it should be noted that figure 6 implies that assuming that suspended- and bed-load transport do not significantly affect each other, as done in figures 16 and 17, is reasonable.
Variation of dimensional bed-load flux
 $\hat{Q}_{b,up}={\it\rho}_{s}{\hat{h}}_{0}^{2}Q_{b,up}/{\it\xi}\,(x=13)$
as a function of
 ${\it\sigma}$
after the uprush of one single solitary wave swash with
 $c_{d}=0.01$
(units:
 $\text{kg m}^{-1}$
).

Figures 16 and 17 thus allow a determination of
 $M$
and
 ${\it\sigma}$
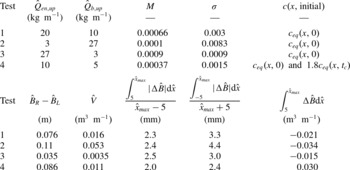
based on a representative bore-driven swash event on a sandy beach. Although we can obtain representative mid-swash uprush fluxes from the field measurements of Masselink & Hughes (Reference Masselink and Hughes1998) and Hughes et al. (Reference Hughes, Masselink and Brander1997), we do not know the proportion of bed and suspended load in these experiments, and the above estimates implicitly assume that all transport is by one mode only. The consensus appears to be that both modes are important in the uprush (Horn & Mason Reference Horn and Mason1994; Masselink & Hughes Reference Masselink and Hughes1998), in which case we may apportion sediment load equally, thereby obtaining
 $M=0.00066$
and
 ${\it\sigma}=0.003$
. It is nonetheless instructive to examine how assuming different proportions of each mode within this representative event affects the resulting concentrations and the eventual bed-step geometry.
Bed mobility parameters
 $M$
and
 ${\it\sigma}$
, and initial concentrations for four scenarios in which the net mid-swash onshore flux is
 $30\ \text{kg m}^{-1}$
. Also shown are the height of the resulting bed step the volume of sand (
 $\hat{V}$
) in the step, the average bed change magnitude from the initial shoreline position (
 $\hat{x}=5$
) to the maximum inundation (
 $\hat{x}_{max}$
) and that from
 $\hat{x}=-5$
to
 $\hat{x}_{max}$
(therefore, that including the bed step), and the net volumetric sediment transport relative to the initial shoreline position.

5.1. Proportions of bed and suspended load
We use figures 16 and 17 to allocate a proportion of the nominal
 $30\ \text{kg m}^{-1}$
to each mode. These allocations are summarised in table 1, and correspond roughly to a scenario in which bed and suspended load are both significant (test 1), which therefore comprises our best estimate of reality, and two further ones in which bed (test 2) or suspended (test 3) load dominates. Finally, in test 4, we consider a case in which pre-suspended load dominates. Therefore, for test 4, we reduce the local bed- and suspended-load
 $\hat{Q}$
values (and therefore
 $M$
and
 ${\it\sigma}$
) and then impose
 $c$
at the time of bore collapse at the shore:
 $t=t_{c}$
. This is to reproduce the large local concentrations that might be expected due to bore turbulence, which is not present in the mathematical model. The approach here is to impose
 $c(x,t=0)=c_{eq}(x,0)$
and
 $c(x,t_{c})=nc_{eq}(x,t_{c})$
, and to determine
 $n$
such that the net total mid-swash onshore flux is
 $30\ \text{kg m}^{-1}$
. This results in
 $n=1.8$
. It should be noted that pre-suspended load exists in tests 1–3 too, but only at equilibrium values (at
 $t=0$
). Therefore, much of the sediment initially present falls out of suspension prior to bore collapse; see § 4.1. The volume of sand in each bed step (
 $\hat{V}$
) is also presented in table 1, and is calculated from the base on the left side
 ${\rm\Delta}B={\rm\Delta}B_{L}$
to the position on the right side such that
 ${\rm\Delta}B_{R}={\rm\Delta}B_{L}$
, see figure 19(b).
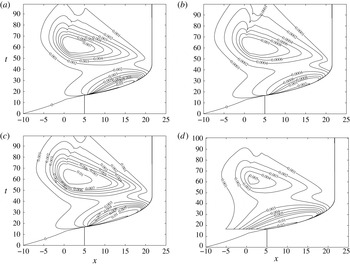
Contour plots of non-scaled concentration
 ${\hat{c}}$
for the combined load solitary wave swash simulation for test 1 (a), test 2 (b), test 3 (c) and test 4 (d).

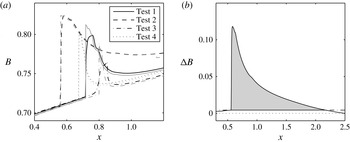
Final beach profiles for solitary wave simulations with bed shear stress for four test cases. (a) Beach profile
 $B$
; (b) schematic diagram for calculation of the sediment volume in the bed step. The grey lines in (a) represent beach profiles at
 ${\it\lambda}_{3}$
shock reversal (
 $W=0$
).

5.2. Concentrations and final bed profiles
The contour plots of
 ${\hat{c}}$
for four test cases are shown in figure 18. The suspended-load dominant case test 3 has the largest concentration with a maximum of
 ${\sim}0.01$
. In the uprush the effect of the pre-suspended sediment can still be seen, but not in the backwash (figure 18
d).
The corresponding final beach profiles for these four tests are shown in figure 19. In figure 19(a) we show bed changes at the point of
 ${\it\lambda}_{3}$
shock reversal (
 $W=0$
), at which point the bed step achieves peak magnitude. At this instant the bed-step height is directly proportional to
 ${\it\sigma}$
, as noted earlier, as is the volume (see table 1). Thereafter, the degree to which the bed step is modified depends on
 $M$
primarily, with the largest reworkings in test 3 (
 $M=0.0009$
) and test 1 (
 $M=0.00066$
); see figure 19(a).
If
 ${\hat{h}}_{0}=1\ \text{m}$
, we obtain average bed change magnitudes in the region shoreward of the initial shoreline position of about 2 mm, with moderately larger values including the bed step. Masselink & Hughes (Reference Masselink and Hughes1998) and Hughes et al. (Reference Hughes, Masselink and Brander1997) do not record the bed change due to individual events, but Blenkinsopp et al. (Reference Blenkinsopp, Turner, Masselink and Russell2011), on a beach with a grain diameter of
 $0.4\ \text{mm}$
, but of slope 0.067, record most (
 ${\sim}60$
, 75, 95 % moving from seaward to shoreward in the swash) individual swash events with a zero (or at least non-measurable) net beach level change at three cross-shore locations across the swash zone. These negligible changes would appear to include beach changes similar to the average magnitudes calculated here, from the initial shoreline position (figure 7 of Blenkinsopp et al. (Reference Blenkinsopp, Turner, Masselink and Russell2011)). Nonetheless, there is a significant proportion that has non-zero net change (both positive and negative) up to an occasional extreme of
 ${\sim}4\ \text{cm}$
. Based on this comparison the changes recorded here are a little larger than those observed, particularly at the beach step, but only moderately so. It is not clear where the measurements of bed-level change were made relative to where a bed step might form, but it seems likely that some of them might have been made at such a location, because the measurements of Blenkinsopp et al. (Reference Blenkinsopp, Turner, Masselink and Russell2011) were made over tidal cycles.
Finally, it should be noted that the values of
 ${\hat{c}}$
in figure 18 are consistent with values measured in some field experiments (Masselink et al.
Reference Masselink, Evans, Hughes and Russell2005; Butt et al.
Reference Butt, Russell, Puleo and Masselink2005).
6. Concluding remarks
A mathematical model in which, for the first time, the 1D shallow water equations (with bed shear stress) are fully coupled both to an Exner equation and a concentration advection equation is presented.
Numerical simulations of one single PW01 swash reveal that the sediment entrainment rate parameter
 $M$
controls the amount of erosion/deposition caused by suspended load, and that the resulting beach change patterns are similar, with amplitude
 $\propto M$
(if
 ${\tilde{E}}$
, the parameter governing the sediment response rate, is constant). Simulations also reveal that coupling with suspended load has only a minor feedback on the flow itself. Furthermore, bed- and suspended-load transport do not significantly affect each other.
Simulations of a single solitary wave swash event reveal some important features of swash flow. A bed step associated with a backwash bore (a
 ${\it\lambda}_{3}$
shock in the present system) is formed in all simulations, with height proportional to
 ${\it\sigma}$
(bed-load mobility) and inversely proportional to
 $c_{d}$
(Chezy coefficient). The results show that suspended load can also affect bed-step height, although only slightly, by changing the bed level on the seaward side due to sediment deposition. This is consistent with the analytical result that suspended load has no direct effect on the shock conditions. However, subsequent sediment entrainment after flow reversal, when the bed step is transformed into a (steep) rarefaction fan, can modify its height.
The bed step grows as the backwash bore gradually slows down, and achieves a maximum amplitude at a stationary state with
 $u_{L}=u_{R}=W=0$
. After this point the backwash bore (i.e. shock) vanishes and the flow starts to move shorewards. The previous bed discontinuity acquires a continuous structure, although the observed bed-step profile is little changed.
Near to where the point of reversal of the bed step is encountered, but before it, a shoreward propagating
 ${\it\lambda}_{2}$
shock forms (i.e. near the end of the swash event). It grows rapidly and is the main mechanism for re-establishing the shoreline as the swash motions decay. Both
 ${\it\lambda}_{3}$
and
 ${\it\lambda}_{2}$
shocks form near to and grow rapidly as they pass through critical conditions. This process of the original seaward moving
 ${\it\lambda}_{3}$
shock (backwash bore/bed step) slowing, and the creation of a fast-moving mainly hydrodynamical
 ${\it\lambda}_{2}$
shock, is equivalent to the reversal of a hydraulic jump on an immobile bed, but here results in a bed-step feature being left on the lower beachface.
There are a number of limitations to the present study. The most obvious is the swash event itself and the fact that
 $M$
and
 ${\it\sigma}$
as evaluated here are therefore empirical values. It is likely that different swash events will yield rather different pictures of erosion and accretion in the region. Furthermore, it is noted that the swash events that move the largest amounts of sediment, at least in some studies and on some beaches, are usually those that include one or more interactions (Blenkinsopp et al.
Reference Blenkinsopp, Turner, Masselink and Russell2011). Therefore, some circumspection is required in interpreting the present findings. Nonetheless, a solitary wave is a robust and widely accepted model for a wave approaching the shoreline for steeper beach slopes. Furthermore, the use of uprush sediment transport only as a characterisation of bed mobility is more robust than that of net transport. The value chosen (
 $30\ \text{kg m}^{-1}$
) is consistent with a number of field studies (Hughes et al.
Reference Hughes, Masselink and Brander1997; Masselink & Hughes Reference Masselink and Hughes1998; Blenkinsopp et al.
Reference Blenkinsopp, Turner, Masselink and Russell2011), and such an event might be characterised as a moderately large but not exceptional swash event. It should be noted also that in reality
 $M$
,
 ${\it\sigma}$
,
 ${\tilde{E}}$
and
 $c_{d}$
are all related to grain size.
The present model also neglects bore turbulence, which, as noted earlier, would entrain and suspend more sediment if included. It is therefore possible that
 $M$
might be overestimated here to compensate for this. However, beach mobility will also affect entrainment by bore turbulence, so its basic effect is robust.
As mentioned earlier, the effect of a threshold of motion for sediment is considered in appendix A. It is not considered to be significant.
The formation of a beach (bed) step is one of the most interesting features of the present study. This is a realistic beach feature (Larson & Sunamura Reference Larson and Sunamura1993; Masselink et al.
Reference Masselink, Russell, Blenkinsopp and Turner2010). In the field it has been reported to reach about 0.5 m in height (Masselink et al.
Reference Masselink, Russell, Blenkinsopp and Turner2010), albeit on a more permeable beach with grain size
 ${\sim}5\ \text{mm}$
. The nearly vertical slope predicted here is, of course, unrealistic, but no significance should be read into this because downslope diffusion (avalanching) under gravity is excluded, to allow an understanding of the shock dynamics from which the step forms, and becomes (relatively) inert. In the field angles of
 ${\sim}20^{\circ }$
are typical (Larson & Sunamura Reference Larson and Sunamura1993), although this slope is presumably proportional to grain size, with coarser grained beaches on which steeper slopes will form also being more subject to permeability effects.
It is suggested that future studies should investigate the role of different types of, and multiple, swash events, not least because the backwash bore and bed step are likely also to be important in entrainment (Butt & Russell Reference Butt and Russell2005). Masselink et al. (Reference Masselink, Russell, Blenkinsopp and Turner2010) also report that the berm height (the berm being the depositional region at the top of the swash zone) could be controlled by the step size.
Acknowledgements
The authors would like to thank the China Scholarship Council and The University of Nottingham for providing financial support. The authors would also like to thank the anonymous reviewers for their detailed constructive comments. They are also indebted to Dr D. Pritchard of the University of Strathclyde for making available results from his paper.
Appendix A. Threshold for sediment movement
The threshold for sediment movement is usually determined using the Shields parameter
 $$\begin{eqnarray}{\it\theta}=\frac{{\it\tau}_{0}}{({\it\rho}_{s}-{\it\rho})gD},\end{eqnarray}$$
where
 ${\it\rho}_{s}=2650\ \text{kg m}^{-3}$
and
 ${\it\rho}=1000\ \text{kg m}^{-3}$
are representative sand and water densities,
 $D$
is the grain diameter and
 ${\it\tau}_{0}$
is the bed shear stress. If, as for the model equations, we take
 ${\it\tau}_{0}={\it\rho}c_{d}|{\hat{u}}|{\hat{u}}$
, and note that
 ${\hat{u}}$
scales with
 $\sqrt{g{\hat{h}}}$
in the swash zone, we obtain
 $$\begin{eqnarray}{\it\theta}=\frac{c_{d}{\hat{h}}}{1.65D}.\end{eqnarray}$$
There is some uncertainty surrounding the value of
 $c_{d}$
in the swash region. Here, we take
 $c_{d}=0.01$
, which is consistent with direct (Barnes et al.
Reference Barnes, O’Donoghue, Alsina and Baldock2009) and inferred (Briganti et al.
Reference Briganti, Dodd, Pokrajac and O’Donoghue2011) laboratory measurements at prototype scale on rough slopes. Finally, for
 $0.1\ \text{m}<{\hat{h}}<1\ \text{m}$
and
 $0.25\ \text{mm}<D<5\ \text{mm}$
(medium sand to fine shingle (Soulsby Reference Soulsby1997)) we obtain
 $$\begin{eqnarray}0.12<{\it\theta}<24.2.\end{eqnarray}$$
Since the largest critical value for (non-cohesive) sediment movement (see Soulsby Reference Soulsby1997) is usually taken as
 ${\it\theta}_{cr}=0.055$
, this implies that only for shingle beaches might the effects of a threshold of movement be significant. Alternatively, as long as
 ${\hat{h}}\gtrsim 100D$
we may expect a (bed-load) sediment threshold not to have a significant impact on swash morphodynamics.
There is more uncertainty surrounding the equivalent critical threshold for suspended load,
 ${\it\theta}_{cr,s}\geqslant {\it\theta}_{cr}$
. A reasonable estimate (Van Rijn Reference Van Rijn1993, Reference Van Rijn2006) for
 $0.25\ \text{mm}<D<5\ \text{mm}$
(for smaller grain sizes entrainment is directly as suspended load) is given by
 $$\begin{eqnarray}{\it\theta}_{cr,s}=\frac{w_{s}^{2}}{({\it\rho}_{s}/{\it\rho}-1)gD},\end{eqnarray}$$
and so
 $0.13<{\it\theta}_{cr,s}<0.93$
. There is therefore more likelihood that a (suspended-load) entrainment threshold could affect the swash morphodynamics, although again this is likely only to influence shingle beaches.
Appendix B. PH05 swash event (
${\it\sigma}=1\times 10^{-7}$
and
$M=1\times 10^{-8}$
)


The performance of the combined load model is tested by simulating the PW01 swash event and comparing the results with the uncoupled suspended-load-only simulations in Pritchard & Hogg (Reference Pritchard and Hogg2005) and also Pritchard & Hogg (Reference Pritchard and Hogg2006). In the combined load model,
 ${\it\sigma}=1\times 10^{-7}$
and
 $M=1\times 10^{-8}$
are set to model the nearly fixed bed.
The comparisons of
 ${\tilde{E}}=0.001$
and
 ${\tilde{E}}=0.03$
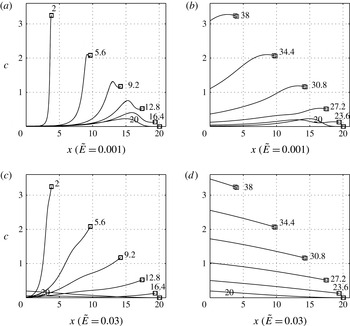
are shown in figure 20. Both comparisons show very close agreement.
Comparison of sediment concentration in the water column under the PW01 swash event with those in the Pritchard & Hogg (Reference Pritchard and Hogg2006) simulation: (a) and (c)
 $t=0{-}20$
(uprush); (b) and (d)
 $t=20{-}40$
(backwash). Black line: present model; grey line: Pritchard & Hogg (Reference Pritchard and Hogg2006) solution. The labels indicate the value of
 $t$
and ▫ indicates the shoreline position.

Appendix C. Separation of locally entrained and pre-suspended load
The net suspended sediment flux
 $x=0$
is defined as
 $$\begin{eqnarray}Q(x)=\int _{t_{in}}^{t_{de}}huc\text{d}t,\end{eqnarray}$$
where
 $t_{in}$
is the inundation time and
 $t_{de}$
is the denudation time. The net flux caused by locally entrained sediment is denoted as
 $Q_{en}$
and that by pre-suspended sediment as
 $Q_{pre}$
. Unlike the model of Pritchard & Hogg (Reference Pritchard and Hogg2005), the model presented here is fully coupled, so we cannot disentangle
 $Q_{pre}$
and
 $Q_{en}$
exactly. Instead, to calculate
 $Q_{pre,en}$
we first run an equivalent simulation with
 $c(x,0)=0$
, and calculate
 $Q_{en}$
. Then the simulation is run for
 $c(x,0)\neq 0$
, and the total net flux,
 $Q_{tot}=\int _{t_{in}}^{t_{de}}huc\text{d}t$
, is calculated. Then,
 $Q_{pre}=Q_{tot}-Q_{en}$
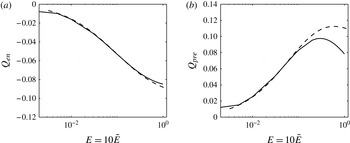
. If the bed changes significantly then this definition works less well, but comparisons with Pritchard & Hogg (Reference Pritchard and Hogg2005) are generally satisfactory; see figure 21.
Net sediment fluxes at
 $x=0$
due to (a) locally entrained sediment
 $Q_{en}$
and (b) pre-suspended sediment
 $Q_{pre}$
, as a function of
 ${\tilde{E}}$
(
 $M=1\times 10^{-4}$
and
 $c(x,0)=1$
). The dashed lines are the equivalent results of Pritchard & Hogg (Reference Pritchard and Hogg2005).

Comparison between suspended-load-only simulations and the PW01 solution under one single PW01 swash: (a)
 $h$
; (b)
 $u$
. Black solid line: suspended-load-only (
 $M=0.001$
and
 ${\tilde{E}}=0.001$
); grey solid line: suspended-load-only (
 $M=0.005$
and
 ${\tilde{E}}=0.001$
); black dashed line: the PW01 solution.

Appendix D. Effect of suspended load on swash flow
In order to investigate the effect of suspended load on the swash flow, we show the comparison of contours of
 $h$
and
 $u$
in the suspended-load-only simulations (
 ${\it\sigma}=0$
,
 $M=0.001/0.005$
and
 ${\tilde{E}}=0.001$
) with the equivalent fixed-bed case (
 ${\it\sigma}=0$
and
 $M=0$
), i.e. the PW01 solution, in figure 22. The flow structure of the suspended-load-only simulation with
 $M=0.001$
is very close to the PW01 solution, although the final bed profile is changed to a certain extent (see figure 4
a); the maximum net beach change
 ${\approx}0.023$
. For
 $M=0.005$
, the flow is changed to a greater extent due to the larger bed change (see figure 4
a) (the maximum net beach change is
 ${\approx}0.11$
). However, the maximum inundation is changed little from that in the PW01 solution. Even though the final bed change for
 $M=0.005$
is comparable with that for
 $0.01<{\it\sigma}<0.0654$
, the flow for the suspended-load-only simulation is little changed in comparison with the bed-load-only simulation. The smaller effect of suspended load on the swash flow indicates the lesser importance of fully coupling for the suspended-load-only simulation.
Appendix E. Shock relation when one side of the shock is a (nearly) dry bed for the combined load system
One special case occurs when one side of the shock is a (nearly) dry bed. Here, we examine the shock behaviour when its right side is becoming dry with
 $h_{R}\rightarrow 0$
. The case of
 $h_{L}>h_{R}$
is considered.
From (2.20), we have
 $$\begin{eqnarray}h_{L}(u_{L}-W)=h_{R}(u_{R}-W)=m,\end{eqnarray}$$
where
 $m$
represents water mass flux across a shock front. As
 $h_{L}>h_{R}$
, we have
 $|u_{R}-W|>|u_{L}-W|$
. If
 $m>0$
, we have
 $W<u_{L}<u_{R}$
, and if
 $m<0$
,
 $u_{R}<u_{L}<W$
.
From (2.21),
 $$\begin{eqnarray}\displaystyle & (W-u_{R})h_{R}u_{R}-(W-u_{L})h_{L}u_{L}-\frac{1}{2}(h_{R}+B_{R}-h_{L}-B_{L})(h_{L}+h_{R})=0 & \displaystyle \nonumber\\ \displaystyle & \qquad \Rightarrow \frac{1}{2}(h_{R}+B_{R}-h_{L}-B_{L})(h_{L}+h_{R})=-m(u_{R}-u_{L}). & \displaystyle\end{eqnarray}$$
 $h_{R}\rightarrow 0$
,
 $m\rightarrow 0$
and the right-hand side of (E 2) approaches 0. Thus, it is possible that
 $h_{R}+B_{R}-h_{L}-B_{L}\rightarrow 0$
or (and)
 $h_{L}+h_{R}\rightarrow 0$
. However, which term approaches 0 at the limit depends on the sign of
 $m$
and
 $W$
. It is therefore classified into the following four cases according to
 $m$
and
 $W$
to find the solution to the shock adjacent to a nearly dry bed.
-
(i)
$m>0$
and
$W>0$
As
$m>0$
and
$W>0$
,
$W<u_{L}<u_{R}\Rightarrow u_{R}-u_{L}>0$
and
$B_{R}-B_{L}={\it\sigma}((u_{R}^{3}-u_{L}^{3})/W)>0$
. (E 3)Hence, with
$$\begin{eqnarray}\displaystyle {\textstyle \frac{1}{2}}(h_{R}+B_{R}-h_{L}-B_{L})(h_{L}+h_{R}) & = & \displaystyle -m(u_{R}-u_{L})<0\nonumber\\ \displaystyle & \Rightarrow & \displaystyle h_{R}+B_{R}-h_{L}-B_{L}<0\nonumber\\ \displaystyle & \Rightarrow & \displaystyle h_{L}>h_{R}+B_{R}-B_{L}>0.\end{eqnarray}$$
$h_{L}>0$
, we have
$h_{L}+h_{R}>0$
, and when
$h_{R}\rightarrow 0$
, i.e.
$m\rightarrow 0$
, it is
$(h_{R}+B_{R}-h_{L}-B_{L})\rightarrow 0$
such that (E 2) is satisfied. Thus, at the limit
$h_{R}\rightarrow 0$
we have
$h_{L}\rightarrow h_{R}+B_{R}-B_{L}>0$
.
-
(ii)
$m>0$
and
$W<0$
When
$m>0$
and
$W<0$
, we also have
$u_{R}-u_{L}>0$
, but
$B_{R}-B_{L}={\it\sigma}((u_{R}^{3}-u_{L}^{3})/W)<0$
. Similarly, we still have (E 4)When
$$\begin{eqnarray}\displaystyle h_{L}>h_{R}+B_{R}-B_{L}. & & \displaystyle\end{eqnarray}$$
$h_{R}\rightarrow 0$
,
$h_{R}+B_{R}-B_{L}<0$
, and as
$h_{L}\geqslant 0$
,
$h_{R}+B_{R}-h_{L}-B_{L}<0$
. Thus, it has to be
$h_{L}+h_{R}\rightarrow 0$
such that (E 2) can be satisfied. This gives
$h_{L}\rightarrow 0$
when
$h_{R}\rightarrow 0$
.
-
(iii)
$m<0$
and
$W>0$
As
$m<0$
and
$W>0$
,
$u_{R}<u_{L}<W\Rightarrow u_{R}-u_{L}<0$
and
$B_{R}-B_{L}={\it\sigma}((u_{R}^{3}-u_{L}^{3})/W)<0$
. Thus, (E 5)Similarly to (ii), when
$$\begin{eqnarray}\displaystyle {\textstyle \frac{1}{2}}(h_{R}+B_{R}-h_{L}-B_{L})(h_{L}+h_{R}) & = & \displaystyle -m(u_{R}-u_{L})<0\nonumber\\ \displaystyle & \Rightarrow & \displaystyle h_{R}+B_{R}-h_{L}-B_{L}<0\nonumber\\ \displaystyle & \Rightarrow & \displaystyle h_{L}>h_{R}+B_{R}-B_{L}.\end{eqnarray}$$
$B_{R}-B_{L}<0$
and
$h_{R}\rightarrow 0$
, we have
$h_{L}\rightarrow 0$
.
-
(iv)
$m<0$
and
$W<0$
When
$m<0$
and
$W<0$
, we also have
$u_{R}-u_{L}<0$
, but
$B_{R}-B_{L}={\it\sigma}((u_{R}^{3}-u_{L}^{3})/W)>0$
. Similarly to (i), we have
$h_{L}\rightarrow h_{R}+B_{R}-B_{L}>0$
when
$h_{R}\rightarrow 0$
.


In summary, the shock solution at the limit can be obtained according to the travelling direction of the shock and that of the water mass across the shock front. In cases (i) and (iv),
 $h_{L}\rightarrow h_{R}+B_{R}-B_{L}\rightarrow B_{R}-B_{L}$
when
 $h_{R}\rightarrow 0$
; meanwhile, in cases (ii) and (iii),
 $h_{L}\rightarrow 0$
as
 $h_{R}\rightarrow 0$
.
From (E 1),
 $W=u_{L}+((h_{R}(W-u_{R}))/h_{L})$
. As
 $h_{R}<h_{L}$
,
 $h_{R}/h_{L}\rightarrow 0$
when
 $h_{R}\rightarrow 0$
, and we have
 $W\rightarrow u_{L}$
regardless of whether
 $h_{L}\rightarrow 0$
or not. The two shock conditions (2.20) and (2.21) have been simplified into two relations when
 $h_{R}\rightarrow 0$
. Furthermore, (2.25) is also used to solve the shock. Thus, the system is determined. When the signs of
 $m$
and
 $W$
are determined, the shock solution is unique for a shock with nearly dry bed on its right side. According to the criterion for a physical shock that the characteristics must converge, cases (i) and (ii) are not physical.
For the backwash bore,
 $m<0$
,
 $W<0$
and
 $u_{R}-u_{L}<0$
, and it corresponds to case (iv). Thus, we have
 $h_{L}\rightarrow B_{R}-B_{L}>0$
as
 $h_{R}\rightarrow 0$
.
Finally, we also note that using (2.20), (2.21) and (2.25) we may write
 $$\begin{eqnarray}(h_{R}-h_{L})(-W^{2}+\overline{u^{2}}+\overline{h})=(B_{R}-B_{L})\biggl(-\overline{h}-\frac{2\overline{h}\overline{u}W}{{\it\sigma}(2\overline{u}^{2}+\overline{u^{2}})}\biggr),\end{eqnarray}$$
where an overbar denotes a simple average (e.g.
 $\overline{h}=(h_{R}+h_{L})/2$
), which gives us a direct relationship between
 $h_{R}-h_{L}$
and
 $B_{R}-B_{L}$
.