1. Introduction
Which models of legislative politics best explain the outcomes of the negotiations over the economic governance of the European Union (EU)? Which factors best explain bargaining success? The establishment of these rules has given rise to contrasting claims. Several analyses assign a dominant influence to the German government (Heipertz and Verdun, Reference Heipertz and Verdun2010; Schimmelfennig, Reference Schimmelfennig2015; Bernhard and Leblang, Reference Bernhard and Leblang2016; Steinberg and Vermeiren, Reference Steinberg and Vermeiren2016; Schoeller, Reference Schoeller2017), but other scholars doubt that this presumed pre-eminence has translated into bargaining success because of the counterbalancing clout of other governments and institutions (Segers and van Esch, Reference Segers and van Esch2007; Schure and Verdun, Reference Schure and Verdun2008; Schild, Reference Schild2013; Camisão, Reference Camisão2015; Bressanelli and Chelotti, Reference Bressanelli and Chelotti2016; Degner and Leuffen, Reference Degner and Leuffen2019).
In this article, we assess the accuracy of models of EU legislative politics in predicting the outcomes of the economic governance reforms that took place between 1997 and 2013. Economic governance constitutes a key pillar of the monetary union. It currently comprises an excessive deficit procedure (EDP) for breaches of national deficit and debt rules, a set of measures—collectively named stability and growth pact (SGP)—which aims to ensure sound medium-term budgets and appropriate responses to correct breaches, a directive on national budgetary frameworks, two Eurozone-specific measures (called two-pack) on budgetary transparency, coordination, and management of countries under financial pressure, and, lastly, a procedure for monitoring macroeconomic imbalances (see the full list in online appendix Table A1, we cover here only EU secondary legislation, disregarding treaties and other intergovernmental instruments).
Although no study has carried out such a longitudinal analysis of these negotiations, we share common ground with Finke and Bailer (Reference Finke and Bailer2019) and Lundgren et al. (Reference Lundgren, Bailer, Dellmuth, Tallberg and Târlea2019). These scholars have similar research questions but they limit their attention to the most recent reforms. For the set of measures that overlaps with our study, Finke and Bailer (Reference Finke and Bailer2019: 126–9) find that a procedural (agenda-setting) model that accounts for the status quo or reference point most accurately explains the reform outcomes. Lundgren et al. (Reference Lundgren, Bailer, Dellmuth, Tallberg and Târlea2019) find no clear winners and losers across member states and show how preference centrality and proximity to the position of the European Commission significantly affect bargaining success, especially in the ordinary legislative procedure (OLP).
Following Thomson et al. (Reference Thomson, Stokman, Achen and König2006) and Thomson (Reference Thomson2011), we outline in the next section the expectations of two procedural and five bargaining models. An important distinguishing feature is the extent to which models incorporate the reference point. Despite the importance of this theoretical construct, its empirical relevance in the broader literature is not robust (e.g., Thomson, Reference Thomson2011: 229–51; Cross, Reference Cross2013; Arregui, Reference Arregui2016). These negotiations are therefore of particular interest because they have been plausibly characterized by high costs of no-agreement, as pointed out in detailed qualitative studies (e.g., Heipertz and Verdun, Reference Heipertz and Verdun2010; Schimmelfennig, Reference Schimmelfennig2015; Franchino and Mariotto, Reference Franchino and Mariotto2020). In 1997, failure to adopt the SGP would have most probably led to the exclusion of some countries from the Eurozone. In 2005, no reform meant continuing the abeyance of the EDP. And during the European sovereign debt crisis, lack of reform would have delayed the adoption of bailout measures, with the associated risk of breaking up the Eurozone.
The empirical analysis is based on data on governmental and institutional positions over 35 controversial issues that emerged during these reforms. In line with the literature, results corroborate the accuracy and robustness of the compromise bargaining model. But they also show that a procedural model with a costly reference point performs well, especially in terms of point predictive accuracy. Misestimation of the cost of no agreement appears therefore to be a likely reason for the commonly reported poorer accuracy of procedural models. On the other hand, these models are more sensitive to measurement errors. The last section builds on these results and investigates the determinants of bargaining success. Results indicate that both models are useful in predicting success and that the conditional influence of the European Parliament should not be ignored.
2. Models of legislative politics
2.1 Procedural models
The predictions of procedural models depend on the sequential features of the legislative process, the differing prerogatives, and the preferences of the actors that are entitled to propose, amend, and adopt a new measure as well as the location of the reference point or status quo, that is, the outcome in case of no agreement (König and Proksch, Reference König, Proksch, Thomson, Stokman, Achen and König2006; Steunenberg and Selck, Reference Steunenberg, Selck, Thomson, Stokman, Achen and König2006).
Consider the procedure which has been employed for the SGP corrective regulation: consultation with unanimity voting in the Council. Here, the Commission proposes a measure that is amended and approved unanimously by the Council. Following Crombez (Reference Crombez1996: 204), the Commission enjoys the monopoly of making proposals, but it does not have the power of gatekeeping. Also, while the European Parliament issues an opinion on the proposal, ministers and the Commission are not bound by it. To establish the outcomes that are predicted by the procedural model, we follow Steunenberg (Reference Steunenberg1994) and Crombez (Reference Crombez1996). As an illustration, we employ Tsebelis and Garrett (Reference Tsebelis and Garrett2000)'s stylized representation depicted in Figure 1.
An illustration of procedural models.
Note: x 1…7, EP and COM: ideal policies of governments, European Parliament and Commission. sq: status quo or reference point. u, q: policies which are utility equivalent to sq for the pivotal government under unanimity and qualified majority voting in the Council. U, Q, C, L: sets of policies that can be adopted under unanimity and qualified majority consultation, cooperation, and ordinary legislative procedures.

Assume that the Council is composed of n governments with ideal positions x i for i = 1…n distributed along a unidimensional policy space X = ℝ1. The governments have single-peaked Euclidean preferences, that is, the closer a measure to their ideal, the higher the utility. The Commission and the Parliament have similarly specified utility functions. Actors have complete information. The procedural model requires the identification of (a) the minimal winning coalition, comprising of the actors whose approval is necessary and sufficient for a policy change, and (b) the acceptance set of this coalition's most conservative actor(s), comprising of the policies this actor weakly prefers to the status quo sq. This so-called pivotal actor(s) can help to pinpoint the predicted outcome (pivotal actors may be more than one, depending on the direction of the policy shift and location of the status quo).
In the unanimity variant of the consultation procedure, the minimum winning coalition comprises all the governments, and the most conservative member is the government with the ideal position that is closest to the status quo (Steunenberg, Reference Steunenberg1994; Crombez, Reference Crombez1996: 209). In Figure 1, it is government 1. This government supports any policy p in its acceptance set A 1 = {p|sq ≤ p ≤ u}, where sq and u are equidistant to its ideal x 1. The government is indifferent between sq and u and opposes proposals outside [sq, u], the line segment from sq to u inclusive. In Figure 1, proposals in A 1 are also preferred to sq by all the other governments. Finally, let S = {p|x 1 ≤ p ≤ x n} be the support set of policies p such that no policy is weakly preferred to an element of S by all governments. We can derive the intersection $U = A_1\mathop \cap \nolimits S$ as the set of proposals that can be adopted under the unanimity-based consultation procedure. In other words, a proposal must belong to the acceptance set A 1 and to the support set S to become law. If the status quo is an element of the support set, U is empty and no reform is possible.
One can generate a more precise prediction. Since the Commission is positioned at the right end of the policy spectrum in Figure 1, it will want to move the policy rightward as much as possible and propose a measure close to u. If we assume that governments support proposals that are utility equivalent to sq, the Commission's proposal and predicted outcome would be u. Clearly, such an outcome would change with different configurations of preferences.
The qualified majority voting (qmv) variant of the consultation procedure, employed for the adoption of the EDP regulations and the budgetary frameworks directive, differs only slightly. A qualified majority in the Council suffices for the adoption of the Commission's proposal. Consequently, the minimum winning coalition comprises of the Commission and the governments that make up such a majorityFootnote 1 (Steunenberg, Reference Steunenberg1994; Crombez, Reference Crombez1996: 209). The pivotal member(s) is the government that is closest to the status quo and can form a blocking minority. In Figure 1, it is government 3 if a qualified majority requires, say, five out of seven votes. This government supports any policy p in its acceptance set A 3 = {p|sq ≤ p ≤ q}, where sq and q are equidistant to its ideal x 3. Proposals in A 3 are also preferred to the sq by the governments to its right. Its elements are therefore also proposals that are preferred to the status quo by a qualified majority. And $Q = A_3\mathop \cap \nolimits S$ is the set of proposals that can be adopted under the qualified majority-based consultation procedure, while a more precise predicted outcome would be q, given the preference configuration of Figure 1.
The preventive SGP measures of 1997 and 2005 have been adopted following the now-repealed cooperation procedure. Its key innovation was the opportunity for the Parliament to insert amendments to a draft text adopted by a qualified majority of the Council. If these changes were accepted by the Commission, the Council could either adopt them by a qualified majority or modify them unanimously (Tsebelis, Reference Tsebelis1994). The Parliament, therefore, becomes a member of the minimum winning coalition (Crombez, Reference Crombez1996: 214–8) and, with reference to Figure 1, the set of proposals that can be adopted under cooperation is $C = A_3\mathop \cap \nolimits ( {A_p\mathop \cup \nolimits A_1} ) \mathop \cap \nolimits S$ , where A p is the Parliament's acceptance set. C is a subset of Q, but they can be equal as in Figure 1. Here, the predicted outcome is q as well, but it may obviously differ under different preference configurations.
Lastly, the remaining six-packFootnote 2 and two-pack measures have been adopted following the OLP, as specified in the Treaty of Amsterdam. This procedure establishes that the Council and the Parliament have formally equal power as co-legislators. In case of protracted disagreement, a conciliation committee composed of ministers and parliamentary representatives is set up to produce a joint text that must be approved by the Council and Parliament to become law. The minimal winning coalition, therefore, comprises of a qualified majority in the Council and an absolute majority in the Parliament. Considering Figure 1, let M = {p|min (x 3, EP) ≤ p ≤ max (x 5, EP)} be the support set of policies p such that no policy is weakly preferred to an element of M by a qualified majority of governments and the Parliament. The set of proposals that can be adopted is $L = A_3\mathop \cap \nolimits A_p\mathop \cap \nolimits M$ (Crombez, Reference Crombez1997: 107–9). Under this preference configuration, a proposal q would be approved.
In the empirical section, we will consider two variants of procedural models that differ with regard to the relevance given to the status quo, but first, we introduce the family of bargaining models.
2.2 Bargaining models
Bargaining models offer alternative predictions, abstracting away the procedural features of a legislative process and the prerogatives of the actors involved. One way to put it is that these rules are endogenized, rather than ignored. Since they reflect political power, their application simply replicates the will of powerful actors (Achen, Reference Achen, Thomson, Stokman, Achen and König2006b: 91). Others characterize these models as offering predictions when procedural prerogatives are de facto widely dispersed across actors to have no impact on outcomes (e.g., Predtetchinski, Reference Predtetchinski2011).
We consider here a set of bargaining models that have been subject to empirical corroboration by Thomson et al. (Reference Thomson, Stokman, Achen and König2006) and Thomson (Reference Thomson2011). We begin with the Nash bargaining solution (NBS), which is the dominant approach in cooperative bargaining games. Adapting the earlier setting, let x i for i = 1…n be the ideal positions of n actors involved in bargaining, distributed along a unidimensional policy space X = ℝ1, with quadratic utility functions. In line with several studies (Achen, Reference Achen, Thomson, Stokman, Achen and König2006b: 100; Bailer and Schneider, Reference Bailer, Schneider, Thomson, Stokman, Achen and König2006: 162; Thomson, Reference Thomson2011: 167), a specification of the NBS is the policy

In other words, NBS is the outcome $\dot{p}$ that maximizes the product of actors' utilities, where s i is the salience attached to the issue by actor i. The first part of Equation 1 captures the utility originating from the status quo and the second part the utility loss from a given policy. The utility is maximized when a policy is located on an actor's ideal position, i.e. p = x i. If an actor were to prefer the status quo, any other measure would generate a loss.
In case of a very high cost of no agreement, Achen (Reference Achen, Thomson, Stokman, Achen and König2006b: 94, 117) demonstrates that the NBS is approximated by the salience-weighted mean of actors' ideal policies. A quasi-utilitarian formulation is the following

NBS is the outcome $\dot{p}$ that maximizes the salience-weighted sum of actors' utilities. The compromise model of Van den Bos (Reference Van den Bos1991) adds to Equation 2 a second weight parameter v i measuring the power of actors, as follows

If we set v i and s i in Equation 3 equal to one, the predicted outcome becomes the mean position that maximizes simply the sum of actors' utilities. This prediction bases its theoretical foundation on Caplin and Nalebuff (Reference Caplin and Nalebuff1991)'s mean voter theorem according to which the mean position is an equilibrium outcome in a multidimensional setting with supermajority voting (Thomson, Reference Thomson2011: 173).
The last model we consider is the minimax solution which minimizes the maximum utility loss of any actor. With quadratic utility functions, this outcome can be formalized as follows

This solution has its normative foundation on the Rawlsian theory of justice whereby outcomes should minimize the utility loss of the actor that is disadvantaged the most.Footnote 3
3. Controversial issues, positions, and research design
The EDP has been modified thrice since 1993, while the 1997 SGP has been amended in 2005 and 2011. Five more measures make up part of the 2011 six-pack and the 2013 two-pack. We have identified 35 controversial issues—including disagreements that produced no changes—emerging during these reforms. They are listed in the online appendix (Table A2), along with references to the specific provisions that were under negotiation. Our analysis relies on information on the positions of government ministers and institutions at the beginning of negotiations. Given the information-rich environment of such deliberations, scholars tend to consider these preferences to be sincere and free from strategic considerations (e.g., Moravcsik, Reference Moravcsik1998: 61; Bailer, Reference Bailer2004; Târlea et al., Reference Târlea, Bailer, Degner, Dellmuth, Leuffen, Lundgren, Tallberg and Wasserfallen2019). According to Lundgren et al. (Reference Lundgren, Bailer, Dellmuth, Tallberg and Târlea2019: 4), this assumption is particularly plausible in this policy area because publicly available statistics on public finances make it quite hard for governments to disguise their underlying interests.
In the online appendix, we outline the several sources and strategies we have followed to identify and cross-validate issues and positions, while Figure A1 illustrates a controversy concerning the exceptional circumstances for preventing a deficit from being considered excessive. This issue emerged during the negotiations of the 1997 SGP corrective regulation. The German and Dutch governments argued for precise thresholds and proposed that automatic exemptions should apply only to countries experiencing an annual decline in real gross domestic product (GDP) of at least 2 percent. The Belgian, French, and Italian governments preferred the status quo, thus leaving the Council free to determine country-specific exceptional circumstances. The Commission did not propose to modify this provision nor did the Parliament amend it at its first reading. The remaining governments held an intermediate position as outlined in an agreement adopted by the Council of economic and financial affairs ministers. Eventually, the 2 percent threshold was included in article 2.2 of the regulation, but the third comma stipulated that circumstances could be exceptional also for a contraction of less than 2 percent, in light of further evidence. In other words, it remained a matter of Council discretion to stipulate whether exceptional circumstances applied to milder recessions. Therefore, this was overall a modest amendment.
Positions on controversial issues are standardized on a scale from zero to 100 where the status quo is set at zero (on no occasion, it is intermediately located) and 100 is the most reformist position (see Table A3 for summary statistics). In most cases, identifying the status quo is unproblematic, as in the issue depicted in Figure A1 where the left-most position is the outcome in case of no agreement. In other circumstances, it is harder. During the negotiations of the enforcement of SGP regulation in 2011, some governments supported the Commission's proposal of redistributing the amounts collected from fines among Eurozone states with no excessive deficit. Others preferred transferring them to the European Stability Mechanism, thus expanding EU financial capacity. In this and similar situations, the most proximate to the status quo is usually the most conservative position, that is, the one that implies less capacity building, less pooling or delegation of policy prerogatives, or less tightening of national authorities. We, therefore, assign the status quo to this position. Note that by positioning the status quo in this manner, rather than at an arbitrary distance away from this position, we bias the research design in favor of the status quo influencing outcomes.
Careful legal analysis is paramount also for identifying other positions, even for issues that seem unproblematic. For instance, the controversy in Figure A1 appears to be easily associated with a continuous scale of zero to 2 percent and the outcome should accordingly be located close to the right end of the scale, assigning a bargaining success to the Dutch and German governments over the Belgian, French and Italian ones. In reality, considering the third comma of article 2 of this regulation, we should doubt as to whether the initial situation had been significantly changed. Indeed, these provisions were eventually repealed in the 2005 reform. In light of this analysis, it seems appropriate to assign the outcome to the mid-point of 50. In our dataset, positions only take the values of 0, 25, 50, and 75. When there are minor differences, we opted for clustering positions rather than differentiating them further because these nuances are very hard to measure accurately.
Especially for older negotiations, we started from initial Council documents as the baseline position of governments, and then, using all the sources and validation strategies at our disposal, we systematically investigated which governments went their way to explicitly record different or similar stances. We assigned a higher salience s i of 1.25, over the baseline of 1, in these circumstances, accounting for the fact that governments plausibly made an effort to signal their position when issues mattered more to them. We assign a similarly higher salience to the parliamentary position if significant and related amendments have been adopted at its readings or if the issue emerged in trilogues (informal meetings among parliamentary, Council, and Commission representatives). Commission's salience is set at 1.
Lastly, Figure A1 displays also the outcomes that are predicted by the models. Recall that we consider two variants of procedural models. In the first one, the predicted outcome is the option, belonging to relevant procedure-specific set (U, Q, C, L) of adoptable policies, that is most preferred by the Commission. The second procedural model instead accounts for the fact that our positioning of the status quo may underestimate the true cost of no agreement. As we argued in the introduction, this is highly plausible in our context. The second variant, therefore, assumes that acceptance sets do not constrain any longer the set of adoptable measures (recall that the size of acceptance sets is determined by the status quo or reference point, associated with the cost of no agreement, and it expands with such cost). Thus, the predicted outcome is the option, belonging to the relevant procedure-specific support set (S, M), that is most preferred by the Commission. In the situation illustrated in Figure A1, both procedural models expect legislators to leave the Council's prerogatives intact.
The expected outcomes of the NBS, NBS without reference point (~RP), and minimax models are computed employing gradient ascent-like procedures that implement respectively Equations 1, 2, and 4. The compromise and the mean models follow Equation 3, the former with the parameter v i taking the Penrose–Banzhaf voting power index scores,Footnote 4 the latter with salience s i and power v i weights set equal to one. In the controversy of Figure A1, minimax predicts the actual outcome.
4. Predictive accuracy of models
Table 1 reports the mean average of the absolute differences between predictions and the actual outcome across each controversy, also known as the mean absolute error per issue. It is arguably the most comprehensible metric of accuracy since it measures the average size of the forecasting error of a model (Achen, Reference Achen, Thomson, Stokman, Achen and König2006a: 175). Table 1 also includes the mean absolute differences with the reference point.
Means of absolute differences between reference points, outcomes, and model predictions

Note: OUT, outcome; RP, reference point; NBS, Nash bargaining solution; PROC, procedural; COMP, compromise.
Standard deviation in parenthesis. In bargaining models, the Parliament is accounted for only in the OLP. The Commission has no voting power in the compromise model.
†p < 0.1, *p < 0.05, **p < 0.01: two-sided sign test that the median of the differences is different from zero.
The mean outcome is 59.29, which is fairly reformist, considering that the status quo is anchored at zero. On average, the compromise model expects an outcome of 55.51 and produces the most accurate predictions, with the lowest mean absolute error per issue of 18.46. The next best performing model, with a mean error of 20, is the procedural model that assumes a high cost of no agreement (i.e., ~RP). The mean model and the NBS (~RP) follow. The differences between the compromise, mean, and NBS (~RP) models range between 1.34 and 7.86, meaning that adding information about salience and voting power improves accuracy but does not change predictions drastically. On the other hand, the differences from the predictions of the procedural model (~RP) are more than twice as large on average (they range from 14.54 to 18.57), indicating that this model is based on substantively different premises.
The least accurate are the NBS and procedural models that account for the reference point. Although their predictions differ on average by a considerable 44.66 points, they both expect excessively conservative outcomes, averaging 31.43 and 33.57, respectively. NBS is the worst performer, with the highest mean absolute error of 47.86. In between this and the previous group of models stands the normative minimax model with a mean error of 30.63.
These results are mostly consistent with the existing literature. Achen (Reference Achen, Thomson, Stokman, Achen and König2006a: 276) finds the compromise and mean models to be the most accurate. In Thomson (Reference Thomson2011: 180), the NBS (~RP) and the mean models produce the lowest errors. Procedural models generally perform poorly in these works as our first procedural model does (but cf. Finke and Bailer, Reference Finke and Bailer2019: 126–9). Thomson (Reference Thomson2011: 220–4) also finds that models employing equal or regressive (i.e., voting weight-related) power distributions in the Council are the most accurate, so is our compromise model which assigns equal power in unanimity and voting weight-related power in qmv-procedures. Models using more equal distributions, such as NBS (~RP) and mean models, and well as those employing more unequal ones are less accurate. In the online appendix, we report the accuracy of compromise models that include only the five or six largest countries or that employ Thomson (Reference Thomson2011: 204–9)'s derived voting power indexes of supranational institutions. These variants are systematically less accurate than the original (see Tables A3–A6). Giving credence to Schure and Verdun (Reference Schure and Verdun2008) and Heipertz and Verdun (Reference Heipertz and Verdun2010), small countries matter in economic governance reforms.
An interesting difference from the existing works is the low mean error of the second procedural model (PROC ~RP), which is not considered by Achen (Reference Achen, Thomson, Stokman, Achen and König2006a) and Thomson (Reference Thomson2011). The summary statistics in Table A3 offer a rough-and-ready understanding of why this model does as well as the compromise model (at the cost of ignoring heterogeneity across issues). The mean outcome is in between the centrally-located mean position of the Commission and the more reformist mean position of the Parliament. Its key feature lays in the treatment of the reference point, suggesting that issue-specific status quos, even when they can be easily identified from a legal standpoint, as in the example of Figure A1, underestimate the cost of no agreement. This cost is more probably associated with the entire measure rather than a single controversy. Indeed, a common thread of these findings is that models that do not consider issue-specific reference points perform better than those that do. The mean difference between the predictions of the two procedural models is 17.14 points (close to the differences between the procedural model (~RP) and the well-performing bargaining models). The predictions of the two NBS models differ by a considerable 45.91 points (Thomson (Reference Thomson2011: 180) reports a similar result). Since the contexts of these negotiations suggest no agreement to be very costly, differences in model accuracy plausibly lie in the measurement error engendered by issue-specific status quos that underestimate such cost.Footnote 5
It seems to us that here may lie also the reason for the prominence of the reference point in the findings of Finke and Bailer (Reference Finke and Bailer2019: 126–9). These scholars identify, for the same measures, only a third as many divisive issues as we do, and aggregate them into three higher-level conflict dimensions. It could be that the reference point loses salience if a divisive issue is identified at a fine-grained provision-specific level. Lundgren et al. (Reference Lundgren, Bailer, Dellmuth, Tallberg and Târlea2019) use the same dataset as Finke and Bailer (Reference Finke and Bailer2019) but they disregard proximity to the status quo in their research, so unfortunately they cannot confirm Finke and Bailer (Reference Finke and Bailer2019)'s findings.
Interesting results also emerge from the analysis of accuracy across legislative procedures (see online appendix Table A4). The compromise model is the most accurate in the OLP and it is among the top three in the other two legislative procedures. No obvious patterns are emerging from the other bargaining models, with an interesting exception. NBS is the most accurate model in consultation with unanimity and the least accurate in qmv-based procedures. Underestimating the cost of no agreement appears particularly deleterious in these latter circumstances.
Procedural models perform well in consultation with qmv, less well in OLP, and poorly in consultation with unanimity. This should not be surprising since predictions in these models depend on the selection by the Commission of its most preferred measure among the set of adoptable policies in a given procedure. The Commission's agenda setting-power is at its strongest in qmv-consultation. In unanimity, negotiations within the Council take center stage and bargaining models appear better suited. In OLP, negotiations between the Council and the Parliament raise in relevance.
Lastly, outcomes in OLP seem to be the hardest to predict overall. Across all models, the mean absolute error is 30.84 on average, compared to 24.08 in qmv-consultation and 20.14 in unanimity. But given the limited number of observations, we should caution against any generalization. Achen (Reference Achen, Thomson, Stokman, Achen and König2006a: 278) and Thomson (Reference Thomson2011: 181–2) do not find large differences or clear patterns in model accuracy across procedures.
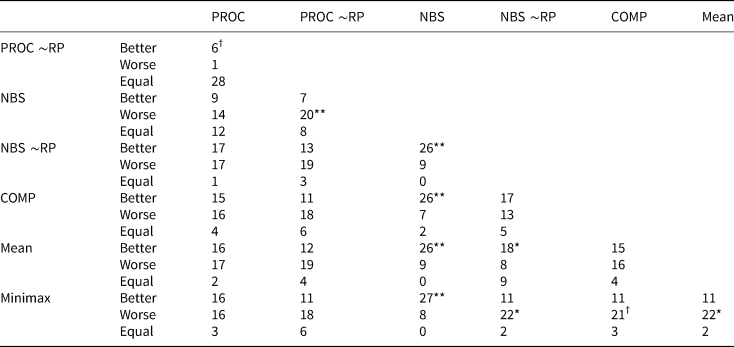
One final aspect deserves attention. Models with the lowest mean average errors may not display the best point predictive accuracy. Schneider et al. (Reference Schneider, Finke and Bailer2010) indeed find that symmetric NBS models, which disregard power resources such as voting power index scores, have lower errors and lower point accuracy than asymmetric resource-based NBS models. We, therefore, conclude this section by comparing the predictive accuracy of these models against each other. Table 2 reports the number of times that row model predictions improve, worsen, or are identical to column model predictions. The relative performance of bargaining models does not change. The compromise model wins most head-to-head contests, followed by the mean, NBS (~RP), and minimax models. NBS loses every comparison, most of the time by a statistically significant margin. Procedural models perform much better overall. For instance, the ~RP variant wins every contest. In contrast to Table 1, the comparisons in Table 2 are less dependent on the scale of the issue, and close and large victories are treated the same (Achen, Reference Achen, Thomson, Stokman, Achen and König2006a: 289). Hence, considering both tables, results indicate that victories of procedural models are likely to be close, while mispredictions are likely to be by large margins. When accurate, the predictions of procedural models win contests because they are point precise since they are based on the existing distributions of positions. Bargaining models' predictions instead are derived from maximization algorithms and point accuracy is less likely (see also Achen, Reference Achen, Thomson, Stokman, Achen and König2006a: 292–3).
Model performance comparison between row model predictions and column model predictions

Note: See Table 1. †p < 0.1, *p < 0.05, **p < 0.01: one-sided sign test.
5. Bargaining success
Given the accuracy of the compromise model, high voting power actors with centrally located preferences should be more successful in these negotiations, especially if they attach high salience to the issues at stake. But the equally good performance of some procedural models invites caution. Preference centrality should still matter a great deal, but how voting rules shape the set of adoptable proposals does not suggest a direct relation between voting power and success. Procedural models also highlight the conditional influence of supranational institutions—parliamentary positions should make a difference under OLP—whilst they give less emphasis to salience (with few exceptions, e.g., König and Proksch, Reference König, Proksch, Thomson, Stokman, Achen and König2006). Proximity to the issue-specific status quo may be less relevant in our circumstances.
In Table 3, we report the results from regressing bargaining success, the opposite of the absolute difference between a governmental position on a given divisive issue and the negotiation outcome, on the covariates identified in the models above and on other commonly employed determinants (Bailer, Reference Bailer2004; Arregui and Thomson, Reference Arregui and Thomson2009; Thomson, Reference Thomson2011: 229–51; Aksoy, Reference Aksoy2012; Cross, Reference Cross2013; Arregui, Reference Arregui2016; Lundgren et al., Reference Lundgren, Bailer, Dellmuth, Tallberg and Târlea2019; ). For any government, success, therefore, takes the value of zero if the outcome is located at the government's ideal point and negative values as it moves away from it. Descriptive statistics and further measurement information are available in the online appendix (Table A8).
Determinants of member states' bargaining success

Note: N = 759, No. groups = 35. Two-level linear regression with random intercepts by issue. Random intercepts by act are not included because they are not significant. Robust standard errors in parentheses. *p < 0.01.
Proximity to the status quo does not seem to provide a significant advantage while centrality does. Governments with positions that are located 20 points (a standard deviation) closer to the mean position in the 0–100 scale attain outcomes that are on average ten points closer to their position. Results instead do not corroborate the emphasis some bargaining models assign to salience and voting power, nor the importance given to the Commission by procedural models.Footnote 6 On the other hand, for measures that are adopted under the OLP, governments with positions that are located 41 points (a standard deviation) closer to the parliamentary position reach outcomes that are 27 points closer to their positions.
These results are acceptably in line with the existing literature. The importance of preference centrality and the irrelevance of voting power are the most robust results, while the effects of salience and the status quo are inconsistent across studies (e.g., Bailer, Reference Bailer2004; Arregui and Thomson, Reference Arregui and Thomson2009; Thomson, Reference Thomson2011: 229–51; Cross, Reference Cross2013; Arregui, Reference Arregui2016). The clearest difference is perhaps the irrelevance of the Commission's position, despite good evidence to the contrary. Proximity to this institution's position is also the covariate Lundgren et al. (Reference Lundgren, Bailer, Dellmuth, Tallberg and Târlea2019) choose to focus on in their study on bargaining success in the most recent economic governance reform. However, in the OLP, the effect of proximity to the Parliament's position—these scholars report in their supplemental material—is not only significant but its size is actually larger than the size of the effect of proximity to the Commission's position. The two covariates are included in separate regressions because the positions of these institutions are co-located in seven out of ten of their issues (Lundgren et al., Reference Lundgren, Bailer, Dellmuth, Tallberg and Târlea2019: 85, supplemental material: 10). By including both covariates, we instead find the Parliament to matter more. As Table A3 suggests, its influence is unlikely to be inflated by proximity to powerful actors, while that of the Commission may be diluted because of its centrist positions (probably reflecting anticipatory behavior, see Kreppel and Oztas, Reference Kreppel and Oztas2017). Indeed, parliamentary amendments to the Commission's proposals of these measures are four times more likely to be adopted or partially adopted if an act is negotiated under OLP rather than under other procedures. And Levenshtein (Reference Levenshtein1966)'s minimum edit distance between the texts passed by the Parliament and the final acts divided by the length of an act (a measure of text dissimilarity) is on average 25 percent lower. Although the informal trilogues that took place during the negotiations of the six-pack and two-pack measures may make it harder to identify the parliamentary position, their mere occurrence is an indication of parliamentary clout.
These results are not in contrast with Bressanelli and Chelotti (Reference Bressanelli and Chelotti2018). These scholars argue that the Parliament has had a limited impact on the recent reform, but they do not compare parliamentary performance across time and procedures. The influence of the assembly may have been more symbolic than substantive; yet, its position mattered more under OLP, as it is indeed mostly corroborated in the broader literature (Bailer, Reference Bailer2004; Arregui and Thomson, Reference Arregui and Thomson2009; Thomson, Reference Thomson2011: 229–51; Cross, Reference Cross2013; Arregui, Reference Arregui2016).
The relevance of preferences suggests that we should not expect any specific member state or institution to systematically outperform others. Online appendix Figure A2 displays the mean bargaining success of member states, groups of states, and institutions, while Table A9 reports the significance of t-tests on the difference between these means. In the large majority of cases, results indicate no significant differences.Footnote 7 Keeping this in mind, Ireland, Austria, and Malta appear to do relatively well, while Germany, Spain, the Commission, and larger member states tend to underperform. Lundgren et al. (Reference Lundgren, Bailer, Dellmuth, Tallberg and Târlea2019) report a similar rank order for Ireland, Malta, and Germany and this group of countries, but they too fail to identify clear winners and losers. No significant differences are found in the broader literature as well (Bailer, Reference Bailer2004; Arregui and Thomson, Reference Arregui and Thomson2009; Thomson, Reference Thomson2011: 229–51), although some small states may outperform larger ones in some circumstances (Golub, Reference Golub2012; Cross, Reference Cross2013; Arregui, Reference Arregui2016).
The nature of the outcomes is a further indication of the explanatory power of both models. In 12 issues, outcomes are compromises (i.e., middle positions) among at least two opposing groups of governments, and in three more instances, they are interinstitutional compromises (see online appendix Table A2). Two linchpins of EU economic governance appear to be direct applications of the mean bargaining model: The 3 percent deficit-to-GDP reference value was presumably the average ratio of public investment to GDP for the 1974–91 period, and the 60 percent debt-to-GDP figure was the average ratio of government debt to GDP for 1991 (Buiter et al., Reference Buiter, Corsetti, Roubini, Repullo and Frankel1993: 62–3).
Evidence of trading gains across issues instead is sparser. If the mere existence of these rules plausibly accommodates the demands of Germany and other Eurozone governments, these countries had probably to give concessions on procedures and criteria for determining compliance, as Figures A2–A3 indicate and the issue in Figure A1 illustrates. For Lundgren et al. (Reference Lundgren, Bailer, Dellmuth, Tallberg and Târlea2019, supplemental material: 15), governments that avoided the suspension of Council voting rights as a penalty for non-compliance had to concede to the use of reverse qualified majority for blocking sanctions. We could similarly argue that the unsuccessful extension of this rule to more provisions of the SGP and macroeconomic imbalance procedure, as proposed by the Benelux governments and the Parliament, was counterbalanced by its application in the two related enforcement regulations. These are however unconvincing linkages because losing governments did not gain anything, they just lost less. Minimizing losses is not quite the same as trading gains for losses across issues.
6. Robustness analysis
How robust are these results to measurement errors? We have employed Neumayer and Plümper (Reference Neumayer and Plümper2017: 127–8)'s re-categorization test to evaluate the consequences of miscategorization of positions and a Gaussian noise test to assess the robustness to increasing perturbation of positions. Sections 5 and 6 of the online appendix explain these procedures in detail.
The relative performance is unaltered within the two groups of models, but error estimates of procedural models are more uncertain (except for NBS) and more sensitive to both reclassification and perturbation. The mean absolute errors of the original data differ from the (mean of the) same metric of the re-categorized samples by 5.5 points on average for procedural models, compared to 1.1 points for bargaining ones (compare Table 1 with online appendix Figure A4).
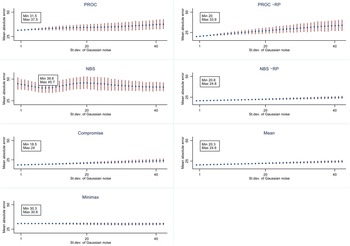
Accuracy worsens almost across the board as models are increasingly perturbed, but procedural ones do particularly badly. Figure 2 maps the overall mean absolute errors as models are perturbed by increasingly dispersed Gaussian noise. As expected, performance ranking replicates Table 1 at low levels of disturbance. Errors then increase almost across the board as the noise is drawn from more dispersed distributions, but procedural models do particularly badly. From the second-best, PROC ~RP becomes the third-worst performing model.
Overall mean absolute errors per issue, across levels of Gaussian noise.
Note: Vertical lines represent the 95 percent confidence intervals.

Greater sensitivity to categorization errors and perturbation does not imply lower accuracy but may explain why procedural models are found to be comparatively less accurate. Indeed, if we set the outcomes equal to the respective predictions of the procedural model (~RP) and compromise model, as if they were representing the true data-generating process, the re-categorization test would produce a mean absolute error of 3.3 (as central tendency) for the compromise model and 10.3 for the procedural one. Scholars would incorrectly infer that the latter is less accurate while it is only more sensitive to errors.
Such sensitivity, already underscored by some scholars (Junge and König, Reference Junge and König2007; Slapin, Reference Slapin2014), results from two interacting effects. First, the predictions of procedural models heavily depend on the positions of the actors in the minimal winning coalition. If these are modified, predictions may change substantially and produce larger errors. For instance, error estimates decrease if Parliament's and Commission's positions, which can nevertheless be easily established from official documents, are not re-categorized. Second, for the re-categorization test, the fewer the meaningful positions taken on an issue, the larger the shift of a randomly selected position. In dichotomous issues, for instance, re-categorization implies moving a position to the opposite end of the spectrum. The interaction of these two factors is particularly consequential for procedural models. If the position of a minimum winning coalition member over a dichotomous issue is re-categorized, predictions could shift from one to the opposite end of the spectrum. In this test, the re-categorization probability of positions on dichotomous or trichotomous issues of members of a minimum winning coalition is approximately 30 percent. On the other hand, 90 percent of the parameters in Equations 1–4 that underlain the predictions of bargaining models remain unaltered.Footnote 8
The bargaining success regression of Table 3 has also been subjected to these tests. Results are robust to categorization errors, with the only difference of a (negatively signed) voting power falling as well within the nominal level of significance (see Figure A5). In the Gaussian noise test, the coefficients of proximity to the parliamentary position, under OLP, and of extremeness are the only ones remaining significant across the full spectrum of disturbance (see Figure A6). As a last check, we have randomly replaced half of our observations with positions that have been independently coded by two doctoral students of EU politics, and then rerun the regression across the resampled datasets (see Section 7 of the online appendix for details). In addition to voting power, now also proximity to the reference point and to the Commission's position fall within the nominal level of significance in the expected direction. Nevertheless, the impact of extremeness and proximity to the Parliament remains significant and much larger (see Figure A7).
7. Conclusion
Despite the media hype (Kriesi and Grande, Reference Kriesi, Grande, Hutter, Grande and Kriesi2016), negotiations over EU economic governance reforms do not appear to differ much from others. In this article, we have assessed the accuracy of procedural and bargaining models that are commonly employed to predict outcomes of EU negotiations. A thread that unifies these discussions is the high cost of no agreement. Indeed, models that account for this aspect are more accurate than those that do not. The commonly reported underperformance of procedural models may therefore be at least in part related to the excessive relevance they assign to the reference point. Indeed, we are able to show that a procedural model with a high no agreement cost (thus, less salient status quo) performs as well as, albeit less robustly than, the traditionally most accurate compromise bargaining model, which also disregards the reference point. Costly failure may not be the modal feature of policy reforms in the EU, but its relevance has probably augmented lately. Indeed, the increased politicization of EU politics noticed by several scholars may have been engendered at least in some cases by high inaction costs.
Our results both confirm and challenge recent studies. If the best performing models are those we have identified, preference centrality should matter a great deal, while no single member state should outperform others. This is what we find, and it is in line with Lundgren et al. (Reference Lundgren, Bailer, Dellmuth, Tallberg and Târlea2019). Unlike Finke and Bailer (Reference Finke and Bailer2019: 126–9) however, the inclusion of the status quo does not increase the predictive accuracy of our models. Because of the lower level of aggregation of positions, our provision-specific status quos may underestimate the true cost of disagreement. If legislators have decided on most issues of a given proposal, no-agreement outcomes may not capture the full consequences of negotiation failure. We suspect that our level of analysis is closer to that used in broader studies, which indeed report similar results to ours (Achen, Reference Achen, Thomson, Stokman, Achen and König2006a: 276; Thomson, Reference Thomson2011: 180). Yet, this does not mean that the reference point would begin to matter with more aggregation because, as qualitative studies suggest, these negotiations were indeed characterized by high disagreement costs. Unfortunately, Finke and Bailer (Reference Finke and Bailer2019)'s results are not replicated by Lundgren et al. (Reference Lundgren, Bailer, Dellmuth, Tallberg and Târlea2019). Also, since these negotiations are embedded within a repeatedly interactive political system, future benefits of cooperation tend to weigh in against decisions to block proposals. Lastly, unlike both Finke and Bailer (Reference Finke and Bailer2019: 126–9) and Lundgren et al. (Reference Lundgren, Bailer, Dellmuth, Tallberg and Târlea2019), we find proximity to the Parliament's position, in the OLP, to matter more than proximity to the Commission's position. But this is also what appears to emerge from the supplemental material of Lundgren et al. (Reference Lundgren, Bailer, Dellmuth, Tallberg and Târlea2019).
Three are the main takeaway points on the functioning of the EU from this study. First, compromise is its most robust modus operandi, based on country-based raw influence, and exemplified by the accuracy of bargaining models and the significance of preference centrality for bargaining success. Second, correctly accounting for the cost of failure, a long-recognized central feature of bargaining, is key to accuracy. For our study, we select measures where such cost is uniformly high. Models that account for this are more accurate than those that rely on the mere legal status quo ante of the issues under negotiations. As expected, the latter is irrelevant also for bargaining success. Third, procedures matter, conditionally. One of such conditions is, needless to say, procedural: Proximity to the parliamentary position increases success, under the OLP. A second condition is, less obviously, methodological. The robustness analysis indicates that taking procedural features seriously improves our precision in estimating outcomes if we are confident about actors' preferences. In this circumstance, the point predictive accuracy of procedural models is notable. Where no such certainty exists, predictions from bargaining models are a safer bet.
Supplementary material
The supplementary material for this article can be found at https://doi.org/10.1017/psrm.2021.26.
Acknowledgment
We are greatly in debt to Luca Cabras, Nicolò Cremona and Matteo Mandelli for their research assistance and to the editors of the journal for their pertinent suggestions that have significantly ameliorated the article.