Implications
Involuntary culling of sows is a major problem in modern pig production worldwide. A high number of involuntary cullings indicate potential health and welfare problems in the herd. The financial consequences are, moreover, substantial, as involuntary cullings require immediate replacement by gilts and lead to losses of income from slaughter. This study aims to identify factors that describe patterns of variation of clinical signs of individual pregnant sows, and to examine the association between these factors and involuntary culling. The results from this study take a step towards a systematic clinical examination of sows, which can be used to predict the risk of involuntary culling of individual sows.
Introduction
Approximately 50% of sows in modern pig production are replaced annually (D’Allaire et al., Reference D’Allaire, Stein and Leman1986; Friendship et al., Reference Friendship, Wilson, Almond, McMillan, Hacker, Pieper and Swaminathan1986; Boyle et al., Reference Boyle, Leonard, Lynch and Brophy1998; Engblom et al., Reference Engblom, Lundeheim, Dalin and Andersson2007). Although replacements of sows can be planned management decisions, a great concern is on sows that are involuntarily culled due to the occurrence of disease, euthanasia or death (Friendship et al., Reference Friendship, Wilson, Almond, McMillan, Hacker, Pieper and Swaminathan1986; Stein et al., Reference Stein, Dijkhuizen, D’Allaire and Morris1990; Engblom et al., Reference Engblom, Lundeheim, Dalin and Andersson2007). This is a major problem for the piglet production worldwide, affecting the farmer’s economy and the welfare of sows. Among 14 526 culled sows in 37 Danish sow herds with group-housed pregnant sows, 10% of the sows were euthanized and 11% died suddenly (Vestergaard et al., Reference Vestergaard, Bækbo and Svensmark2006). Problems in relation to the locomotion system (such as arthritis and osteochondosis) are reported to be the most common reason for euthanizing sows in systems with group-housed pregnant sows (Kirk et al., Reference Kirk, Svensmark, Ellegaard and Jensen2005; Engblom et al., Reference Engblom, Eliasson-Selling, Lundeheim, Belak, Andersson and Dalin2008). Kirk et al. (Reference Kirk, Svensmark, Ellegaard and Jensen2005) found locomotive disorders to be the primary cause of euthanization in more than 70% of 172 euthanized sows examined post mortem. Moreover, circulation failure, trauma, lesions in the reproductive system and gastrointestinal problems are frequently reported to cause sudden death in sows (Kirk et al., Reference Kirk, Svensmark, Ellegaard and Jensen2005; Vestergaard et al., Reference Vestergaard, Bækbo and Svensmark2006). Involuntary culling can occur at any time during the lactation and gestation period, but a higher prevalence of sudden deaths and euthanasia is seen at the time around farrowing and until weaning (Stein et al., Reference Stein, Dijkhuizen, D’Allaire and Morris1990; Kirk et al., Reference Kirk, Svensmark, Ellegaard and Jensen2005).
In order to estimate the risk of involuntary culling, a systematic clinical examination of individual sows is needed. Until now, limited research has focused on identifying categories of clinical signs that share a common structure. Describing the interrelationship between various clinical variables may identify clinical conditions that are more closely linked, which can form the basis for a more systematic approach for clinical examination of sows.
The objective of this paper was to examine the variation of common clinical variables observed in individual pregnant group-housed sows, particularly to explain the patterns of variation clinically. Explanatory factor analysis was performed to identify latent factors describing the underlying structure among the observed clinical variables. Second, we assessed the impact of the emerging latent factors on different outcome variables associated with involuntary culling (e.g. sudden deaths, euthanasia and sent to slaughter due to disease) using multilevel logistic analyses.
Materials
Data collection
Selection of sow herds
The study used data from 34 Danish sow herds during the period February 2008 until November 2008. The herds were selected from a random sample of 797 Danish sow herds drawn from the central Danish farm database. The inclusion criteria were that (i) the pregnant sows were housed indoors in a group-housing system, (ii) the farmer used a Danish standard computerized system for production monitoring (called E control) and (iii) the farmer was willing to participate in the investigation. In total, 226 herds fulfilled the criteria, among which 120 herds were randomly selected and stratified based on the feeding system in the gestation unit: electronic sow feeding, individual feeding stalls or competition base feeding. Fifteen herds were randomly selected from each of the three feeding systems for an initial farm visit, where the feasibility of conducting the study was evaluated. Hence, 36 of these herds were accepted for the study and clinical examinations on sows were conducted. Two herds failed to maintain the required farm recordings leaving 34 herds for the investigation. Fourteen of the herds had electronic feeding systems, nine herds used individual feeding stalls for sows and 11 herds used competition-based feeding systems (e.g. floor feeding) in the gestation unit. In six herds, the sows were group-housed in the entire non-lactation period. In the remaining herds, the sows were group-housed just after mating (five herds), 1 week (three herds) or 4 weeks (20 herds) after mating until approximately 1 week before farrowing. The farrowing and lactating sows were housed individually in stalls in all herds. Herd size varied from 235 to 1117 sows (median 450 sows).
Selection of sows
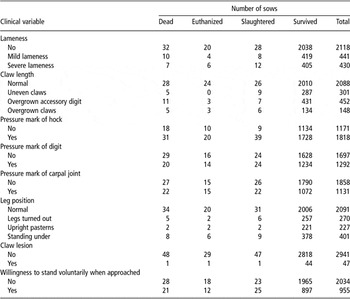
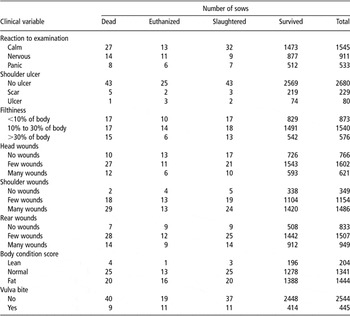
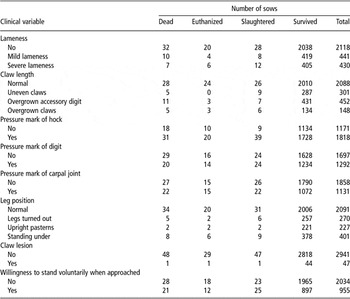
From each herd, approximately 60 pregnant sows (n = 49 to 76) were selected and examined for various clinical signs. The sows were selected randomly such that 20 to 30 sows were 4 to 6 weeks after mating at time of clinical examination, while 30 to 40 sows were selected randomly among all pregnant sows in the herd. In case of housing in small groups (20 sows or less), all sows in randomly selected pens were examined. In large pens, sows were randomly selected based on equal representation of animals located in all areas of the pen. The clinical evaluations of individual sows were conducted by one of six skilled technicians, who before the recordings had received specific training in examining sows for specific clinical signs. Hence, the following clinical signs/conditions were observed and recorded for all legs and claws of each sow: claw length, pressure mark of the hock, pressure mark of the accessory digit, pressure mark of the carpal joint, leg position, claw lesion and lameness. The technicians observed shoulder ulcer and wounds at head, shoulder and rear at both the right and left side of each sow. The highest value of either the right or the left side was used as the final score. Moreover, vulva bite, body condition score, reaction to examination, leg position, filthiness and willingness to stand up voluntarily when approached were observed for each sow (Tables 1 and 2). All clinical signs were recorded on a qualitative scale. As an example, lameness was characterized as no lameness, mild lameness and severe lameness and leg position was characterized as normal position, legs turned out, upright pasterns and standing under. All herds were revisited approximately 3 months after the first visit, and a second group of pregnant sows (n = 51 to 60) were examined using the same protocol as above. After each visit, the farmers recorded all medical treatments and replacements and the reasons for these actions for each of the examined sows. The replacement included whether the sow was sent to slaughter (due to age or clinical signs of disease), euthanized or experienced sudden death. In four of the herds, farmers recorded replacement information of sows from the first visit only.
Descriptive analysis of the clinical variables involving the locomotor system used in the factor analysis
Descriptive analysis of the clinical variables not involving the locomotor system used in the factor analysis

Generation of new variables
A minor part of the sows (120 sows) were coincidentally examined at both the first and second visits, and therefore had clinical recordings from two different dates. In these cases, we used the clinical recordings from the last visit in the study. The variable ‘parity group’ was generated, which divided each sow into one of five parity groups: gilts, first parity, second parity, third parity and older than third parity. Information on sow replacements (such as dead, euthanized and sent to slaughter) recorded at a maximum of 3 months after the clinical examination was included in this study. Only replacement recordings associated with unplanned removals were included in the study. We used the replacement recordings to generate different dichotomous variables associated with involuntary culling. First, the variable ‘involuntary culling’ was generated which expressed whether or not a sow was removed from the herd due to one of the following reasons: sudden death, euthanization or sent to slaughter due to clinical signs of disease (such as claw lesions, injuries and problems with regard to farrowing, which were observed and recorded by the farmer). In addition, we divided ‘involuntary culling’ into each of the underlying reasons, and generated the subvariables: ‘sudden death’ specifying whether a sow experienced sudden death, ‘euthanization’ specifying whether a sow was euthanized, and ‘sent to slaughter’ expressing whether a sow was sent to slaughter due clinical signs of disease.
Methods
Factor analysis
Explanatory factor analysis with principal axis factoring was used to identify and characterize the underlying structure of the clinical variables. These underlying factors incorporated a number of clinical variables that shared a common structure. Hence, the PROC FACTOR procedure in SAS version 9.1 (SAS, 2002) with orthogonal (varimax) rotation was used to find the smallest number of factors that could best explain the correlations among the clinical variables from the pregnant sows. The initial factor model was:

where Yc is the cth clinical variable, lci are the factor loadings, Fi are the new factors and εc is the residual error.
A total of 16 clinical variables were included in the factor analysis (Tables 1 and 2). As the clinical variables were both dichotomous, ordinal and nominal in nature, we used the PRINQUAL (principal components of qualitative data) procedure to transform data to have an optimized correlation matrix for the factor analysis. In order to identify the number of latent factors to be maintained, we evaluated the eigenvalues, the scree plots and the amount of variance that each factor accounted for (O’Rourke et al., Reference O’Rourke, Hatcher and Stepanski2003). For the latter, we chose a minimum of 5% of the total variance to be accounted for by each factor. Moreover, we evaluated the interpretability of the emerging latent factors. To describe new latent factors for the health status of sows, a clinical variable was said to load on a given factor if the factor loading was 0.40 or greater for that factor and less than 0.40 for the other (Sharma, Reference Sharma1996). The values of the residual correlation matrix and the overall root mean square off-diagonal residuals (RMSRs) indicated how well the factors accounted for the correlations among the clinical variables and was used to compare and evaluate the best factor model (Sharma, Reference Sharma1996). To assess whether the data were appropriate for factor analysis, we evaluated the Kaiser–Meyer–Olkin (KMO) measure of sampling adequacy.
Logistic analyses
In order to examine the association between the latent factors and the different outcome variables: involuntary culling, sudden death, euthanization and sent to slaughter due to clinical signs of disease, multilevel logistic analyses were performed using the glimmix procedure in SAS (SAS, 2002). To allow for between-herd variations, we included herd as a random effect in the analyses. The initial models included the emerging latent factors from the factor analysis, the parity number of each sow and their two way interactions. A backward elimination strategy was applied using a significance level of 5% to exclude the factors and interactions.
Results
Descriptive statistics
During the study period, 3652 pregnant sows from 34 herds were examined. A total of 663 sows had missing values of at least one of the clinical variables and could consequently not be included in the factor analysis. Hence, 2.989 sows from 33 herds were included in the study. Among these sows, 127 sows (4.2%) were involuntarily culled during the 3-month period, of which 49 sows (1.6%) died suddenly, 30 sows (1.0%) were euthanized and 48 sows (1.6%) were sent to slaughter due clinical signs of disease. Although sows with parity greater than three had the highest risk of involuntary culling (4.5%), the prevalence of involuntary culling among the five parity groups was approximately similar (3.9% to 4.5%). For the herd-level prevalence, involuntary culling ranged from 0% to 18%, euthanization varied from 0% to 6%, whereas the prevalence of both sudden death and sent to slaughter due to disease varied from 0% to 11%. The distribution of sows with different clinical signs is presented in Tables 1 and 2.
Factor analysis
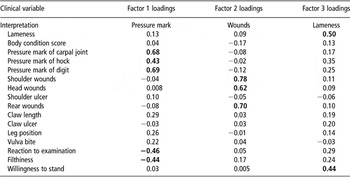
In the selection of the number of latent factors to be maintained in the factor analysis, ‘the eigenvalues greater than one criterion’ suggested that five factors should be maintained. However, the scree plot indicated that only the first three were meaningful, and were therefore retained for rotation. The clinical variables: pressure mark of the hock, pressure mark of the accessory digit, pressure mark of the carpal joint, reaction to examination and filthiness were found to load on the first factor, which were labelled ‘pressure marks’. Second, the clinical variables: wounds at rear, wounds at head and wounds at shoulder loaded high on the second factor that we labelled ‘wounds’. Finally, the clinical variables: lameness and willingness to stand voluntarily loaded high on the third factor that we called ‘lameness’ (Table 3). The eigenvalues of the three factors were 2.62, 2.17 and 1.42, respectively. Combined, the three factors accounted for 40% of the total variation, and the three factors contributed with 16%, 14% and 9%, respectively. The variables: body condition score, shoulder ulcer, claw lesion, claw length, leg position and vulva bite did not load high on any of the three factors (<0.40), and were therefore not included in the interpretation of any of the three factors. The KMO measure was 0.74, which suggested that the correlations matrix was appropriate for factoring (Sharma, Reference Sharma1996). Moreover, the residual values of the correlation matrix were overall small with an RMSR of 0.03, which indicated that the factor structure explained most of the correlations among the clinical variables.
Final factor model of the explanatory factor analysis of 2989 sows describing the characteristics of three types of clinical manifestations based on the 16 clinical variables described in Tables 1 and 2

Clinical variables with factor loadings above 0.4 or below −0.4 were used in the interpretation (displayed in bold).
Logistic analyses
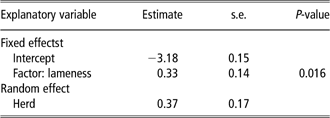
The logistic analyses showed that ‘lameness’ was significantly associated with the outcome variable: involuntary culling (P = 0.016), whereas the explanatory variables such as ‘pressure marks’, ‘wounds’ and parity group did not show significance at the 5% significance level (Table 4). No two-way interaction terms were statistically significant at the 5% significance level. In this analysis, the random variation of herd was:  (Table 4). Using the formula, ρ =
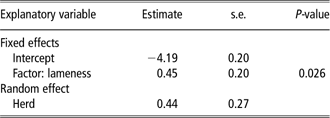
 + π 2/3) (Dohoo et al., Reference Dohoo, Martin and Stryhn2009), the herd variation corresponded to 10% of the total variation. To investigate which of the underlying components of involuntary culling had the greatest influence, we reran the model using each of the subvariables: sudden death, euthanization and sent to slaughter due to health problems as outcomes. When the outcome variable was sudden death, neither the main effects nor the two-way interactions were statistically significant at the 5% significance level. The same results were found when the outcome variable was euthanization. The factor ‘lameness’ was the only explanatory variable that was significantly associated with sent to slaughter (P = 0.026; Table 5). In this analysis, the between-herd variation was σ 2 Herd = 0.44 (Table 5), corresponding to 12% of the total variation.
Estimates of significant effects of the logistic analysis describing involuntary culling

Estimates of significant effects of the logistic analysis describing sent to slaughter due to disease

Discussion
In this study, a total of 4% of the sows were involuntarily culled during a 3-month period probably due to a poor health status. Vestergaard et al. (Reference Vestergaard, Bækbo and Svensmark2006) reported that 14% of Danish sows were dispatched to rendering plants during a 12-month period. In our study, 1.6% of sows died suddenly and 1.0% of sows were euthanized. Hence, 2.6% of sows were dispatched to rendering plants during a 3-month period, which is slightly lower than the annual prevalence reported by Vestergaard et al. (Reference Vestergaard, Bækbo and Svensmark2006). Clinical examinations of sows in this study were performed in the gestation period only, and approximately 25% of the sows were involuntary culled during this period (data not shown). In a study by Kirk et al. (Reference Kirk, Svensmark, Ellegaard and Jensen2005), 231 euthanized and spontaneously dead sows were investigated, among which 48% were euthanized from 1 to 5 weeks after farrowing, and 50% died spontaneously from 1 to 4 weeks after farrowing. These findings agree with our study in which the majority of sows were involuntary culled at the time after farrowing.
Interpretation of the factors
Three different factors extracted the clinical variables that described most of the variation in our data. The clinical variables such as pressure mark of the hock, pressure mark of the accessory digit, pressure mark of the carpal joint, reaction to examination and filthiness all loaded high on the first factor. As clinical variables concerning pressure marks were the predominant variables, this factor was interpreted as ‘pressure marks’. Animals that suffer from pressure marks have often spent a large amount of time lying down due to disease, and/or have lied on a hard surface (Kilbride et al., Reference Kilbride, Gillman and Green2009). This was most likely the reason for the pressure marks among sows seen in this study. The fact that the loadings from the variables such as reaction to examination and filthiness were negative suggested that sows with pressure marks also were calmer and less filthy, indicating that these sows were either less stressed or more used to human appearance at the time of clinical observation, or they had a low activity level in general. However, no studies supporting this relation have been found.
The second factor had high loadings on the variables such as wounds at head, rear and shoulder, which therefore was labelled ‘wounds’. This factor most likely described a sow that had been involved in several aggressive interactions with other sows. Sows housed in groups are found to suffer more from injuries than sows housed in individual gestation stalls. This is due to aggressive interactions that occur among sows when fighting for feed or when establishing a new sow hierarchy (Anil et al., Reference Anil, Bhend, Baidoo, Morrison and Deen2003). All sows were housed in group-housing systems, and a major part of the sows were clinically examined 4 to 6 weeks after insemination. At this time, sows would recently have been mixed together. Hence, the hierarchy between sows in these herds was not fully established, which could explain the rather high number of sows observed with wounds in this study.
In the formation of the third factor, the clinical variables lameness and willingness to stand voluntarily loaded high. As both variables are related to the locomotive capability of sows, this factor was interpreted as ‘lameness’. Clinical signs of lameness are often caused by arthritis, osteochondrosis or claw lesions (Heinonen et al., Reference Heinonen, Oravainen, Orro, Seprä-Lessila, Ala-kurikka, Virolainen, Tast and Peltoniemi2006). However, the clinical variable claw lesion did not load high on the factor ‘lameness’, probably due to the low prevalence of sows with claw lesions observed in this study (1.6%).
Extraction of the factors
Different methods can be used to determine the number of factors to be included in a factor analysis. In this study, the eigenvalues greater than one criterion suggested that five factors should be retained for rotations. Due to the fact that two of the eigenvalues were very close to one and because the scree plot suggested three factors, we finally included three factors for rotation. We used factor loadings of 0.40 as a lower limit for a clinical variable to load on a given factor. A similar limit has been recommended by Sharma (Reference Sharma1996), while another study reported a lower limit (0.30; Sato et al., Reference Sato, Barlett, Alban, Agger and Houe2008) and yet another study reported a higher limit (0.50; Thoefner et al., Reference Thoefner, Ersbøll, Jensen and Hesselholt2001). Having used a higher limit of the factor loadings in this study would not have changed the interpretation of the factors, since the clinical signs, which were important in the interpretation, had loadings above 0.5.
The three factors accounted for 40% of the total variation in the data. However, the main objective of the factor analysis was not to account for the total variation seen in the data but to describe the intercorrelations among the clinical variables.
Association with outcome variables
The factor ‘lameness’ was significantly associated with the outcome variables such as ‘involuntary culling’ and ‘sent to slaughter’. This is in accordance with earlier studies which found lameness to be a common reason for culling sows (Engblom et al., Reference Engblom, Lundeheim, Dalin and Andersson2007). Lesions of the locomotor system are considered to be an important welfare problem in sow herds (Kirk et al., Reference Kirk, Svensmark, Ellegaard and Jensen2005), and clinical signs of lameness are often relatively easy for the farmer to observe. Therefore, the occurrence of lameness is often used in the decision of when to replace a sow, which can explain the associations seen in this analysis.
No factors appeared to be statistically significant in the logistic regression analysis in which the outcome variables were ‘sudden death’ and ‘euthanasia’. That ‘lameness’ was not significantly associated with euthanasia disagrees with other studies, which have found lameness to be the most commonly observed reason for euthanasia among sows and gilts (Kirk et al., Reference Kirk, Svensmark, Ellegaard and Jensen2005; Engblom et al., Reference Engblom, Eliasson-Selling, Lundeheim, Belak, Andersson and Dalin2008). As herds in this study were visited twice by technicians who performed clinical registrations on individual sows, they could have made farmers more aware of clinical signs of lameness. This could have resulted in more sows recovering from lameness or more sows being sent to slaughter under the restriction of the legislation of transport and slaughter of pigs.
Sows that suddenly die, often show clinical signs close to the time of death only or do not show any clinical signs at all (Vestergaard et al., Reference Vestergaard, Bækbo and Svensmark2006). The clinical examinations were performed long before the occurrence of death in most instances. This could explain why no factors were found to be significantly related to ‘sudden death’ in this study. In the generation of the outcome variables, a 3-month interval from the clinical registrations to the time of removal was required. This restriction was made in order to account for the biological causality between the clinical recordings and the replacement of the sow. Indeed, clinical signs close to the replacement of the sows, which were not registered at the time of the visit by the technicians, could also have influenced the risk of involuntary culling.
Data
A total of 663 sows had missing values of at least one variable and could, therefore, not be included in the Factor analysis. The variables such as reaction to examination, claw length and claw lesions had the highest number of missing values, which was due to observation difficulties in some herds (data not shown). The reaction of a sow to examination may be difficult to assess, especially in systems with individual feeding boxes, where the sows choose to remain in the boxes throughout the day. Equally, clinical signs of the claws are often difficult to observe, particularly in systems with deep litter bedding. Before the study, farmers were carefully instructed in recording the replacements of sows and the reasons for these actions. However, it should be emphasized that the decision on when to euthanize or send a sow to slaughter is often a management decision made by the farmer within the limitation of the legislation. The between-herd variation in the logistic analyses were 10% and 12%, respectively. Herds differed in size, feeding system and management, and the farmers may have had different thresholds for when and why to cull a sow. This could explain the variation between herds seen in this study.
Conclusions
Three latent factors interpreted as ‘pressure marks’, ‘wounds’ and ‘lameness’, described the intercorrelation of 16 clinical variables observed in 2898 pregnant sows. ‘pressure mark’ and ‘wounds’ did not have a significant effect on any of the outcome variables associated with involuntary culling. In contrast, ‘lameness’ influenced the risk of a sow being involuntarily culled as well as sent to slaughter due to clinical signs of disease. The results from this study can be a step towards a systematic clinical examination of sows, predicting the risk of involuntary culling of individual sows.