Introduction
In Alzheimer's disease (AD), the amyloid cascade hypothesis proposes that aggregation of beta-amyloid (Aβ) gives rise to neuronal and synaptic loss, which in turn cause progressive decline in cognition and loss of activities of daily living, manifesting ultimately in the clinical syndrome of dementia (Masters and Selkoe, Reference Masters, Selkoe, Selkoe, Mandelkow and Holtzman2012). While the processes through which Aβ disrupts normal neuronal and synaptic function are not yet elucidated, there is growing evidence that neurotrophic factors such as the brain-derived neurotrophic factor (BDNF) may mediate Aβ toxicity (Fahnestock, Reference Fahnestock2011; Lu et al., Reference Lu, Nagappan, Guan, Nathan and Wren2013). For example, BDNF and its main receptor, tropomyosin-related kinase B (TrkB), are necessary for the synaptic excitation and neuronal plasticity that subserve memory (Hariri et al., Reference Hariri2003; Lee et al., Reference Lee2012), impairment in which is the earliest and most common AD symptom. Further, BDNF mRNA is reduced substantially in the hippocampus and temporal lobe of patients with AD and mild cognitive impairment (MCI) (Peng et al., Reference Peng, Wuu, Mufson and Fahnestock2005; Garzon and Fahnestock, Reference Garzon and Fahnestock2007; Lee et al., Reference Lee2012), with the extent of BDNF loss associated with the magnitude of cognitive impairment (Peng et al., Reference Peng, Wuu, Mufson and Fahnestock2005; Garzon and Fahnestock, Reference Garzon and Fahnestock2007). Third, in AD mouse models, pharmacologically increasing BDNF can ameliorate synaptic dysfunction and improve memory (Caccamo et al., Reference Caccamo, Maldonado, Bokov, Majumder and Oddo2010; Lee et al., Reference Lee2012). Finally, cellular studies show that Aβ can disrupt BDNF expression by inducing transcriptional downregulation of the cyclic adenosine monophosphate response element binding protein (Rosa and Fahnestock, Reference Rosa and Fahnestock2015).
While data from pathological and animal studies suggest a role for BDNF in AD pathogenesis, clinical studies of this same relationship have been limited by the uncertain status of circulating BDNF markers, such as serum, plasma or CSF BDNF, as indicators of CNS BDNF expression (Fahnestock, Reference Fahnestock2011; Lu et al., Reference Lu, Nagappan, Guan, Nathan and Wren2013). For example, cross-sectional studies of circulating total BDNF in AD report no difference (O'Bryant et al., Reference O'Bryant2009; Kim et al., Reference Kim2015), lower (Yu et al., Reference Yu2008; Forlenza et al., Reference Forlenza2010), and higher levels (Angelucci et al., Reference Angelucci2010; Laske et al., Reference Laske2011) compared to matched non-demented controls. These different outcomes may be due to unreliability in CNS BDNF markers but they may also reflect differences between studies in the sample sizes studied, illness severity of the sample, the use of cross-sectional designs, or imprecision in the classification of AD due to the absence of any biomarker confirmation.
One useful approach to understanding interactions between CNS BDNF and AD pathogenesis in clinical studies has been to measure the effects of allelic variants of the BDNF Val66Met (rs6265) polymorphism on biological and clinical measures related to AD. This is because carriage of the Met allele is associated with reductions in CNS BDNF expression, long-term potentiation (LTP), and synaptic localization (Lu et al., Reference Lu, Nagappan, Guan, Nathan and Wren2013). In a series of prospective studies, we have observed that in preclinical AD, Met carriage exacerbates decline in episodic memory (EM) and loss of hippocampal volume (HV) over 36 and 54 months (Lim et al., Reference Lim2013; Lim et al., Reference Lim2014b; Lim et al., Reference Lim2015a). We have also observed that in preclinical autosomal dominant AD, Met carriage is associated with impairments in EM, and glucose metabolism in the hippocampus and higher cerebrospinal fluid (CSF) levels of tau and phosphorylated tau (Lim et al., Reference Lim2016). In addition to informing models of AD pathogenesis, the finding that Met carriage accelerated Aβ related EM decline and HV loss also provides a convenient framework for understanding the nature of relationships between CNS BDNF expression and circulating BDNF levels. Previous studies have shown that serum BDNF may be an important circulating marker of BDNF in the CNS (Lang et al., Reference Lang, Hellweg, Sander and Gallinat2009). Further, measures of serum BDNF were also related to cognitive impairment in different stages of AD (Laske et al., Reference Laske2011; Shimada et al., Reference Shimada2014). As such, the aim of this study was therefore to determine the effect of Aβ and the BDNF Val66Met polymorphism on levels of serum mBDNF at baseline and over 18-months in non-demented older adults. We will also determine the effect of Aβ and BDNF Val66Met on EM performance and HV at baseline and over 18-months in order to contextualize any between-group differences in serum BDNF. The first hypothesis was that if serum mBDNF levels reflect some aspect of CNS BDNF expression, then Met carriage would be related to levels of serum mBDNF as well as impairment in EM and HV at baseline, although this relationship would depend on the presence of Aβ+. The second hypothesis was that in non-demented older adults, acceleration of Aβ related EM decline and HV loss by Met carriage could be detected within 18-months and that this would be accompanied by changes in serum mBDNF levels over the same period.
Methods
Participants
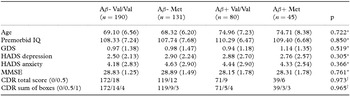
Non-demented older adults (n = 446) were recruited from the Australian Imaging, Biomarkers and Lifestyle (AIBL) study. The process of recruitment and diagnosis classification has been described in detail previously (Ellis et al., Reference Ellis2009; Rowe et al., Reference Rowe2010). In this study, only non-demented older adults who had undergone Aβ imaging with positron emission tomography (PET), BDNF Val66Met genotyping, and biochemical analysis for serum mBDNF were included. Table 1 shows the demographic and clinical characteristics of groups. All participants received a Clinical Dementia Rating scale (CDR) sum of boxes score and a total score (Morris, Reference Morris1983). Exclusion criteria at baseline were: schizophrenia; depression (Geriatric Depression Score (GDS) of 6 or greater); Parkinson's disease; cancer (other than basal cell skin carcinoma) within the last two years; sleep apnoea, symptomatic stroke; uncontrolled diabetes; or current regular alcohol use exceeding two standard drinks per day for women or four per day for men. Clinical classification was blinded to Aβ imaging data at all visits.
Demographic and clinical characteristics

Note: Premorbid IQ = premorbid intelligence (assessed using the Wechsler Test of Adult Reading); GDS = Geriatric Depression Scale; HADS = Hospital Anxiety and Depression Scale; CDR = Clinical Dementia Rating; MMSE = Mini-Mental State Examination.
*Indicates that an Analysis of Variance was conducted to determine whether group differences were significant.
†Indicates that a Kruskall–Wallis test was conducted to determine whether group differences were significant.
The study was approved by and complied with the regulations of the institutional research and ethics committees of Austin Health, St. Vincent's Health, Hollywood Private Hospital and Edith Cowan University (Ellis et al., Reference Ellis2009). All participants provided written informed consent prior to participating in the study.
Assessments
Neuroimaging
Aβ imaging with PET was conducted using either 11C-Pittsburgh Compound B (PiB), 18F-florbetapir, or 18F-flutemetamol. PET methodology has been described in detail previously (Rowe et al., Reference Rowe2010; Vandenberghe et al., Reference Vandenberghe2010; Wong et al., Reference Wong2010). Given the different pharmacokinetic characteristics, a different acquisition protocol was adopted for each tracer. While a 30-minute acquisition was started 40 minutes after injection of PiB, 20-minute acquisitions were performed 50 minutes after injection of florbetapir, and 90 minutes after injection of flutemetamol. For PiB, PET standardized uptake value (SUV) data were summed and normalized to the cerebellar cortex SUV, resulting in a region-to-cerebellar ratio termed SUV ratio (SUVR). For florbetapir, SUVR was generated using the whole cerebellum as the reference region (Clark et al., Reference Clark2011), while for flutemetamol the reference region used was the pons. In line with previous studies, SUVR was classified dichotomously as either low (Aβ–) or high (Aβ+). For PiB, an SUVR threshold ≥1.5 was used (Rowe et al., Reference Rowe2010; Vandenberghe et al., Reference Vandenberghe2010). In the cases of florbetapir and flutemetamol, based on the results of phase III studies (Clark et al., Reference Clark2011), an SUVR threshold of ≥1.1 and ≥0.62 were employed to discriminate between Aβ– and Aβ+.
The methodology for magnetic resonance imaging (MRI) used for clinical screening and co-registration with PET images has also been described previously (Rowe et al., Reference Rowe2010; Villemagne et al., Reference Villemagne2011). HV was normalized for head size using total intracranial volume (sum of grey matter, white matter, and cerebral spinal fluid volumes).
BDNF genotyping
An 80 ml blood sample was taken from each participant and 10 ml was used for large scale DNA extraction for AIBL bio-banking. The BDNF Val66Met polymorphism (rs6265) was included in a custom Illumina GoldenGate assay, which included 1,536 SNPs, and was performed by the Beijing Genomics Institute. The Val66Met polymorphism had a call rate of greater than 99% and did not depart from Hardy–Weinberg equilibrium (p = 0.57).
Neuropsychological testing
The EM composite was computed by averaging standardized outcome measures for Logical Memory delayed recall, California Verbal Learning Test, Second Edition (CVLT-II), and Rey Complex Figure Test delayed recall. The development and validation of this composite score has been described previously (Lim et al., Reference Lim2014a).
Biochemical analysis
Serum mBDNF ELISA was conducted as described previously (Lim et al., Reference Lim, Zhong and Zhou2015b) with a minor modification. Capture antibody in coating buffer (50 mM carbonate pH 9.6) was coated with 1 μg/ml on a 96-well plate (Thermo Fisher Scientific, Rockford, IL, USA). The microplate was then incubated overnight at 4 °C, washed with PBS, and blocked with 3% BSA in PBS for 1 h at 37 °C for 1 h Standard mBDNF (0–750 pg/ml) and serum dilution (1:80) were performed in in sample diluent (1% BSA, 0.125% Tween-20 in PBS). After incubation at 37 °C for 2 h and following washing with wash buffer (PBS, 0.1% Tween-20), detection antibody (biotinylated sheep anti-mBDNF IgG, 0.15 μg/ml) was added, followed by incubation at 37 °C for 1 h. After washing, each well was incubated with streptavidin-HRP (1:5000; Sigma-Aldrich, St Louis, MO, USA) was added at 37 °C for 1 h. The plate was washed and 3,3′, 5,5′-Tetramethylbenzidine (TMB) (S Sigma-Aldrich, St Louis, MO, USA) substrate was added for the colorimetric development. To stop the color development, 0.1 N HCl was added. The absorbance was measured at 450 nm with a microplate reader (VICTOR, Perkin–Elmer, Waltham, Massachusetts, USA) to determine optical density (OD) values. Standards and serum samples were run in triplicates and duplicates, respectively.
Procedure
Participants underwent extensive medical, psychiatric, and neuropsychological assessments upon enrolment into the AIBL study. The same assessments were repeated 18-months after baseline. In this study, we report PET neuroimaging and BDNF Val66Met genotyping data obtained at baseline and data from neuropsychological tests of memory, MRI for HV and serum mBDNF obtained at the baseline and 18-month assessments.
Data analysis
First, to determine whether there were differences in serum mBDNF levels, EM, and HV between Met carriers and Val homozygotes, data were submitted to three analyses of covariance (ANCOVA), with age as the covariate, and Aβ level (Aβ– vs. Aβ+) and BDNF Val66Met polymorphism (Met carrier vs. Val homozygotes) as independent variables. Serum mBDNF levels, EM scores, and HV at baseline were entered into statistical models as the dependent variable.
To determine change in serum mBDNF levels, EM, and HV over 18 months, a second series of ANCOVAs were conducted. In these ANCOVAs, Aβ, and BDNF carrier status were again entered as independent variables, and age and baseline levels/score entered as covariates. The 18-month levels of serum mBDNF, scores for EM, and HV were entered as dependent variables. The magnitude of difference for change in EM, HV, and serum mBDNF over 18 months were calculated using the estimated marginal means at 18 months.
For all analyses, a series of planned comparisons were constructed in accord with the main hypotheses, specifically (1) Aβ– Val/Val versus Aβ+ Val/Val (to determine the effect of Aβ), (2) Aβ+ Val/Val versus Aβ+ Met (to determine the effect of Met carriage in the presence of Aβ+), and (3) Aβ– Val/Val versus Aβ+ Met (to determine the combined effect of Aβ+ and Met carriage). All differences between groups were expressed using Cohen's d and 95% confidence intervals (CI).
Results
Effect of Aβ and BDNF Val66Met on episodic memory, HV, and serum mBDNF at baseline
At baseline, groups did not differ significantly on any demographic or clinical characteristic (Table 1). Age-adjusted means for each Aβ and BDNF group at baseline are shown in Table 2b. ANCOVA indicated significant effects of Aβ for only EM performance and serum mBDNF levels at baseline (Table 2a). There were no significant effects of BDNF group or Aβ × BDNF interactions for EM, HV, or serum mBDNF levels at baseline (Table 2a).
Baseline differences in levels of mBDNF and performance on episodic memory composite

Note: Statistical models have been adjusted for age. Bold values indicate statistical significance at the p < 0.05 level.
mBDNF = mature BDNF; EM = episodic memory; HV = hippocampal volume.
Age-adjusted baseline means and standard deviation for each group on each outcome measure

Note: mBDNF = mature BDNF; EM = episodic memory; HV = hippocampal volume.
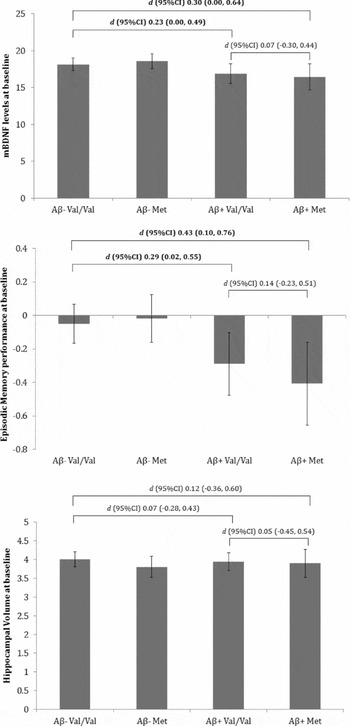
Planned comparisons between Aβ– Val/Val and Aβ+ Val/Val revealed significant and moderate differences in EM and serum mBDNF levels but not HV (Figure 1). Similarly, significant differences of a moderate magnitude were observed between Aβ– Val/Val and Aβ+ Met groups on EM performance and serum mBDNF levels, but not HV (Figure 1). There were no significant differences between Aβ+ Val/Val and Aβ+ Met groups.
Group mean differences at baseline on measures of mature BDNF, episodic memory, and hippocampal volume. Error bars indicate 95% confidence intervals. Effect size of differences (and 95% confidence intervals) between groups are provided, with bolded values indicating significance at p < 0.05.

Effect of Aβ and BDNF Val66Met on change in episodic memory, HV, and serum mBDNF over 18 months
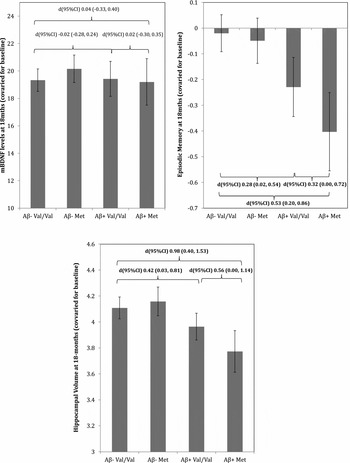
There was a significant effect of Aβ and BDNF on EM performance over 18 months; however, no Aβ × BDNF interaction was observed (Table 3). There were no significant effects of Aβ, BDNF, or Aβ ×BDNF on serum mBDNF levels over 18 months. Planned comparisons between Aβ– Val/Val and Aβ+ Val/Val revealed significant and moderate decline in EM and HV but not serum mBDNF levels (Figure 2). Similarly, compared to the Aβ+ Val/Val group, the Aβ+ Met group showed significant and moderate decline in EM and HV over 18-months but showed no change in serum mBDNF levels (Figure 2). Significant decline of a moderate-to-large magnitude was also observed between Aβ– Val/Val and Aβ+ Met groups on EM performance and HV but not serum mBDNF levels (Figure 2).
ANCOVA of 18-month levels of serum mBDNF and 18-month performance on episodic memory composite after covarying for baseline levels of serum mBDNF and Episodic Memory performance

Note: Statistical models have been adjusted for age. Bold values indicate statistical significance at the p < 0.05.
mBDNF = mature BDNF; EM = episodic memory; HV = hippocampal volume.
Group mean differences at 18-months, after accounting for baseline, on measures of mature BDNF, episodic memory, and hippocampal volume. Error bars indicate 95% confidence intervals. Effect size of differences (and 95% confidence intervals) between groups are provided, with bolded values indicating significance at p < 0.05.

Discussion
The first hypothesis that Met carriage would be related to levels of serum mBDNF, EM, and HV at baseline but moderated by the presence of Aβ+ was supported partially. When compared to Aβ- non-demented older adults at the baseline assessment, Aβ+ non-demented older adults performed worse on the EM composite score and also had lower levels of serum mBDNF, with each difference, by convention, moderate in magnitude (Table 2a). However, Aβ+ non-demented older adults did not have lower HV at baseline compared to Aβ- non-demented older adults. Furthermore, at baseline, EM, HV, and serum mBDNF levels were not affected at all by variation in the BDNF Val66Met polymorphism in either Aβ– or Aβ+ non-demented older adults. The observation that both EM performance and serum mBDNF levels were lower in Aβ+ non-demented older adults is consistent with the results of in vitro studies that show oligomeric Aβ downregulates basal BDNF transcription (Garzon and Fahnestock, Reference Garzon and Fahnestock2007; Rosa and Fahnestock, Reference Rosa and Fahnestock2015), suggesting that decreases in BDNF expression may not be merely a consequence of cell death. The observation in the current study that lower levels of serum mBDNF in Aβ+ non-demented older adults were not associated with lower HV but with impaired EM performance accords with the hypothesis that in individuals at risk of developing AD, lower levels of BDNF can result in reduced neuronal function and synaptic loss, which lead to memory dysfunction even before any frank neuronal loss occurs (Fahnestock, Reference Fahnestock2011).
The second hypothesis that in non-demented older adults, acceleration of Aβ related memory decline and HV loss by Met carriage could be detected within 18 months and that this would be accompanied by changes in serum mBDNF levels was also supported partially. Aβ+ Met carriers showed greater decline in EM and loss of HV over 18 months compared to matched Aβ+ Val homozygotes. For both of these indices of disease progression, the decline observed was, by convention, moderate in magnitude (Figure 2). However, decline in EM and loss of HV in Aβ+ Met carriers was not associated with any change in serum mBDNF levels. This was because there was no change in serum mBDNF levels over 18 months in Aβ+ non-demented older adults, irrespective of BDNF Val66Met polymorphism (Figure 2). As expected, Aβ- non-demented older adults showed no decline in EM performance, HV, or serum mBDNF levels over 18 months irrespective of BDNF Val66Met polymorphism.
Considered together the results of this study confirm our previous findings that in Aβ+ Met carriers, there is substantial decline in EM and loss of HV (Lim et al., Reference Lim2013; Lim et al., Reference Lim2014b; Lim et al., Reference Lim2015a), although in this study, the deterioration in EM and HV observed in Aβ+ Met carriers occurs over a much shorter interval (i.e. 18 months) than that observed previously. This novel observation of the short-term modulation of Aβ+ related deterioration in EM and HV provides a strong context for understanding the absence of any effect of BDNF Val66Met on serum mBDNF. In particular, despite the robust memory decline and HV loss in the Aβ+ Met carriers, no relationships were observed between allelic variation in BDNF Val66Met and serum mBDNF levels; measured either cross sectionally or prospectively. It is unlikely that the lack of relationship between BDNF Val66Met and serum mBDNF levels were due to low statistical power as the sample size of individuals who had serum mBDNF levels analyzed and who had undergone EM and HV assessment were comparable. Therefore, the results suggest that while CNS BDNF is an important moderator of Aβ related neuronal loss prior to the onset of clinically classified AD, serum mBDNF does not provide a reliable index of such processes. Further, when we explored whether baseline levels of serum mBDNF predicts change in EM and HV over 18 months, we determined that after accounting for the effects of age and Aβ levels, baseline levels of serum mBDNF were not associated with longitudinal change in EM, β (SE) = –0.002 (0.004), p = 0.675, or HV, β (SE) = 0.0002 (0.0006), p = 0.778.
The absence of any relationship between carriage of the Met allele and changes in serum mBDNF levels may be due to BDNF assay used in the current study measuring only levels of the mature BDNF (mBDNF) protein. The BDNF protein is synthesized initially into a precursor form (proBDNF), which is then cleaved to generate mBDNF. In vitro studies into mechanisms by which BDNF promotes synaptic plasticity suggest that pro- and mBDNF may elicit opposite biological effects at the synapse by activating the pan-neurotrophin receptor p75 (p75NTR) and TrkB, respectively. In particular, pro-BDNF promotes long-term depression, whereas mBDNF is crucial for LTP. As a significant proportion of CNS BDNF is secreted as pro-BDNF, and previous post-mortem studies have shown that decreased proBDNF is associated with loss of cognitive function in early AD (Peng et al., Reference Peng, Wuu, Mufson and Fahnestock2005), it is possible that the measurement of serum proBDNF may provide a more accurate marker of CNS BDNF. Similarly, it is also likely that the inconclusive results from previous studies on the role of circulating markers of BDNF may be due to their assays measuring only total BDNF levels (Yu et al., Reference Yu2008; O'Bryant et al., Reference O'Bryant2009; Angelucci et al., Reference Angelucci2010; Forlenza et al., Reference Forlenza2010; Laske et al., Reference Laske2011; Kim et al., Reference Kim2015). Unfortunately, a reliable proBDNF assay is still not available and consequently, it is necessary to develop an in-house assay to investigate further the utility of peripheral measures of serum mBDNF.
Another hypothesis for the lack of relationship between serum mBDNF and cognitive function or HV observed in this study may be due to the nature of the current sample. Previous studies have reported differences in serum mBDNF levels between patients with clinically diagnosed AD and matched non-demented controls (Yu et al., Reference Yu2008; Angelucci et al., Reference Angelucci2010; Forlenza et al., Reference Forlenza2010; Laske et al., Reference Laske2011). It is possible, therefore, that Aβ related changes in peripheral measures of BDNF do not become evident until much later in the disease process. Finally, BDNF is the only neurotrophin that is indisputably secreted in response to neuronal activity, and activity-dependent secretion of BDNF has been shown to be related to memory in humans. Therefore, it is possible that any differences in serum mBDNF levels may become evident only after experimental manipulation of neuronal activity (Egan et al., Reference Egan2003; Hariri et al., Reference Hariri2003). It is also likely that the BDNF Val66Met polymorphism influences cognitive decline and brain volume loss through mechanisms other than serum BDNF expression. Recently, we observed that in cognitively normal young adults who carried pathological mutations for autosomal dominant AD (i.e. amyloid precursor protein, presenilin 1, or presenilin 2), mutation carriers who also carried the Met66 allele showed greater cognitive impairment and hippocampal dysfunction compared to matched mutation carriers who were Val66 homozygotes, despite equivalent levels of cerebral Aβ (Lim et al., Reference Lim2016). More importantly, in this young group of mutation carriers, levels of tau and phosphorylated tau in the CSF were 25% higher in Met66 carriers than in Val66 homozygotes. The hypothesis that the Met66 allele may influence tau accumulation, which in turn influences neurodegeneration, is consistent with animal and cell studies that suggest that BDNF can induce rapid dephosphorylation of tau through activation of BDNF receptors (e.g. TrkB) (Elliott et al., Reference Elliott, Atlas, Lange and Ginzburg2005), and that BDNF loss in AD is specific to tangle-bearing neurons (Ferrer et al., Reference Ferrer1999). However, this hypothesis requires further confirmation through prospective study of both young adults with autosomal dominant AD and older adults at risk of developing sporadic AD.
When interpreting the results of this study, there are several caveats that need to be considered. First, the AIBL study is not a population-based sample, and strict inclusion/exclusion criteria were applied to the selection of participants. Few participants had existing or untreated medical, neurological or psychiatric illnesses, and most participants had tertiary educational qualifications. Second, this study was conducted over a very short follow-up period (i.e. 18 months). It is possible that subtle changes in serum mBDNF will become more evident over longer periods of assessment. Finally, there is currently no reliable assay for circulating levels of mBDNF or proBDNF, and the relationship between circulating BDNF and CSF BDNF, particularly in the context of AD, remains unclear (Laske et al., Reference Laske2007). As such, the extent to which we can draw conclusions pertaining to the relationship between change in EM in preclinical AD and circulating BDNF levels remains limited. These limitations notwithstanding, the results of this study do suggest that the BDNF Val66Met polymorphism may be a more useful indicator of expression of CNS BDNF, until more sensitive assays for BDNF are developed. They also suggest that strategies designed to increase levels of BDNF in the CNS may be a viable therapeutic alternative or addition to those which seek to reduce the neurotoxic effects of amyloid, particularly in non-demented older adults who do not meet clinical criteria for AD.
Acknowledgments
Alzheimer's Australia (Victoria and Western Australia) assisted with promotion of the study and the screening of telephone calls from volunteers. The AIBL team wishes to thank the clinicians who referred patients with MCI or AD to the study: Associate Professor Brian Chambers, Professor Edmond Chiu, Dr Roger Clarnette, Associate Professor David Darby, Dr Mary Davison, Dr John Drago, Dr Peter Drysdale, Dr Jacqueline Gilbert, Dr Kwang Lim, Professor Nicola Lautenschlager, Dr Dina LoGiudice, Dr Peter McCardle, Dr Steve McFarlane, Dr Alastair Mander, Dr John Merory, Professor Daniel O'Connor, Dr Ron Scholes, Dr Mathew Samuel, Dr Darshan Trivedi, and Associate Professor Michael Woodward. We thank all those who participated in the study for their commitment and dedication to helping advance research into the early detection and causation of AD.
Funding
Funding for the study was provided in part by the study partners (Commonwealth Scientific Industrial and research Organization (CSIRO), Edith Cowan University (ECU), Mental Health Research institute (MHRI), National Ageing Research Institute (NARI), Austin Health, CogState Ltd.). The study also received support from the National Health and Medical Research Council (NHMRC) and the Dementia Collaborative Research Centres program (DCRC2), as well as funding from the Science and Industry Endowment Fund (SIEF) and the Cooperative Research Centre (CRC) for Mental Health, an Australian Government Initiative. YYL is currently funded by the NHMRC-ARC Dementia Research Development Fellowship.
Conflicts of interest
YYL, YL, SRS, SML, VG, TP, PB, CF, OS, and XFZ report no disclosures. CLM is an advisor to Prana Biotechnology Ltd. and a consultant to Eli Lilly. PM is a full-time employee of Cogstate Ltd. DA has served on scientific advisory boards for Novartis, Eli Lilly, Janssen, and Pfizer Inc. RNM is a consultant to Alzhyme. CCR has served on scientific advisory boards for Bayer Pharma, Elan Corporation, GE Healthcare and AstraZeneca; has received speaker honoraria from Bayer Pharma and GE Healthcare; and has received research support from Bayer Pharma, GE Healthcare, Piramal Lifesciences and Avid Radiopharmaceuticals. VLV served as a consultant for Bayer Pharma; and received research support from a NEDO grant from Japan.
Author contributions
Formulating research question: YYL, CLM, PM. Designing the study: YYL, CLM, PM. Conduct of the study: YYL, SRS, YL, SML, VG, TP, PB, DA, CF, OS, VLV, CCR, CLM, XFZ, RNM, PM. Data analysis: YYL, SRS, YL, SML, TP, PB, VLV, PM. Writing of the manuscript: YYL, CLM, PM. Revising the manuscript for intellectual content: YYL, SRS, YL, SML, VG, TP, PB, DA, CF, OS, VLV, CCR, CLM, XFZ, RNM, PM.