Introduction
In addition to genetic influences, a large number of factors, usually referred to as environmental effects, such as calving year, parity, calving age, and calving season (e.g. Wood, Reference Wood1969; Danell, Reference Danell1982; Wilmink, Reference Wilmink1987b) are used in models as explanatory variables of recorded traits in dairy cattle. Yet, only calving season and year are environmental factors strictly speaking, the others being characteristics of the recorded animal. Some of them are related to physiological aspects, such as parity and pregnancy effects, others, such as length of dry period and age at calving, are more linked with management practices. The aggregated 305-day yields used for genetic evaluation based on lactation data are usually adjusted for all these environmental effects. Depending on country, production records are either pre-adjusted for the identified environmental effects with multiplicative or additive factors, or corrected by fitting environmental effects as fixed effects in the animal models for genetic evaluation.
Effects of calving age on milk production were generally studied to facilitate comparison of cows differing in maturity. Wilmink (Reference Wilmink1987a) reported an evolution of calving-age effects through the years indicating a need regularly to update factors used to pre-adjust data before genetic evaluation. Mao et al. (Reference Mao, Wilton and Freeman1972), among others, reported the existence of parity effects and suggested that age effects be nested within parities. Moreover, it was shown that age at calving effects depend on lactation stage. The effect of calving month exerts a considerable influence on the cow’s daily yield. Herd, year and region have been shown to be the main components responsible for variation of calving month effect, in particular through food supply. In addition to these two effects which have been considered in numerous studies, length of dry period was reported as a significant environmental effect on milk production of subsequent lactation (e.g. Schaeffer and Henderson, Reference Schaeffer and Henderson1972). Pregnancy is also known to have a physiological effect on the daily milk production in the last part of the lactation, through hormonal changes and partition of nutrient supply. Knowledge of systematic environmental effects affecting cow daily yield makes it possible to standardise test-day (TD) production and unbiasedly compare cows within herd (Wilmink, Reference Wilmink1987b, Pérochon et al., Reference Pérochon, Coulon and Lescourret1996).
During the last decade, more and more countries have expressed interest in TD models and many of them have implemented them in routine genetic evaluations. Genetic evaluation based on TD models presents a large number of advantages in comparison with 305-day lactation model as mentioned in several reviews (in particular Swalve (Reference Swalve2000) and Jensen (Reference Jensen2001)). In addition to the usual benefits of TD models from a genetic viewpoint, they are useful for prediction and management purposes such as feeding or cow culling decision support, but only a few published studies specifically refer to these aspects (Mayeres et al., Reference Mayeres, Stoll, Bormann, Reents and Gengler2004). Each country that already moved from a lactation model to a TD model, developed its own model. These models differ in the way the lactation curve is modelled as a function of days in milk (DIM), with fixed classes, parametric or semi-parametric (splines) curves; in the way the genetic and permanent environment components are described (fixed or random regression using Legendre or other polynomials); and in the way heterogeneous residual variances are accounted for. In France, regression splines (White et al., Reference White, Thompson and Brotherstone1999) were chosen to model lactation curves (Druet et al., Reference Druet, Jaffrézic, Boichard and Ducrocq2003).
In contrast to lactation models, there have been limited published studies on how properly to include environmental effects in TD models. The aim of the present study was two-fold. First, to determine which environmental effects should be included in the national TD model for milk yield. The definition of effects in the genetic evaluation and their possible interactions with year of calving were studied. Second, to decrease computational requirements and computing time of such models. An alternative approach relying on data pre-adjustment for shape of lactation curves was evaluated.
Material and methods
Data
Data were TD yields for the first three lactations of French Montbéliarde (animals with at least 7/8 of Montbéliarde blood) collected after September 1988. DIM ranged from 7 to 335 days. Days carried calf (DCC) were considered and limited to a maximum of 265 days. Cows were required to have a first-lactation record and known sire and dam to be included in the data file. Daily test contents outside of the International Committee for Animal Recording (ICAR) limits, i.e. lower than 1.5% and 1.0% or greater than 9.0% and 7.0% for fat and protein percentages, respectively (ICAR, 2005), and milk productions lower than 2.0 kg (Institut de l’Elevage, 2005) were discarded. Only cows with at least three TD were considered. At least five records were needed to define a herd–test-date effect (HTD) and a minimum number of 20 records per herd, parity and year were required.
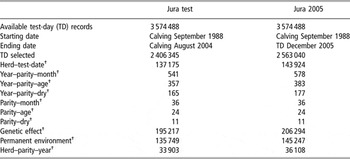
To reduce computational requirements, most analyses were made from a regional subset of the Montbéliarde data file limited to the Jura, a French administrative region. Because of the different modellings of fixed effects, two data files hereafter called ‘Jura test’ and ‘Jura 2005’, differing by their end date of TD recording were used (Table 1). ‘Jura 2005’ was created as the usual national genetic evaluation files, i.e. including all TD records until a known date, December 2005 in the present. In contrast, the ‘Jura test’ was created to assess various models for fixed effects through curves, of which one included year of calving interaction. Because the year effect was defined from September of year n to August of year n + 1, the data file ‘Jura test’ included all TD records from cows calving from September 1988 to August 2004. Daily milk productions (mean ± s.e.) of Jura data files were representative of the Montbéliarde breed, i.e. 19.6 ± 4.6 kg for the first-lactation cows, 22.4 ± 6.8 kg for the second-lactation cows and 23.6 ± 7.0 kg for the third-lactation cows.
Description of the data sets (‘Jura test’ and ‘Jura 2005’) and number of levels for each effect

†Number of levels for each combination.
Model

where yijklnopqtt′vw is the record of animal v in lactation q on DIM t and days carried calf (DCC) t′. HTDi is the ith HTD effect. The interaction terms ymonth, ydry and yage correspond to the jth, kth and lth year–parity–calving month, year–parity–length of dry period and year–parity–calving age, respectively. These terms are constant over the lactation. splvar(eff) denotes a regression spline function of the variable var specific to the effect eff. Four spline functions were included to model lactation curves according to the effects of the parity–month of calving class n (month), the parity–length of dry period class o (dry) and the parity–age at calving class p (age) as a function of DIM t, splDCC is a regression spline modelling the effect of gestation of parity q as a function of DCC t′ and e is the residual term. Interactions with region are not considered in model (1) since a regional subset was considered in this study, but will be included in the national model.
The random additive genetic, permanent environment and herd–year of calving random regression effects are avr, pvr and hwr, respectively, for animal v and herd–year of calving w with associated coefficients υtqr, ζtqr and τtqr, at DIM t and parity q.
Environmental fixed effects
Regression splines (White et al., Reference White, Thompson and Brotherstone1999) were used to model lactation curves. Six-knot regression splines, with knots positioned at days 7, 20, 50, 135, 245 and 335, were considered to be an accurate way to model lactation curves (Druet et al., Reference Druet, Jaffrézic, Boichard and Ducrocq2003). To model the effect of gestation, DCC defined as DIM minus days open (DO, the number of days from calving to successful insemination) was used. The conception date was approximated as the next calving date minus the average gestation length for the Montbéliarde breed, i.e. 288 days. When the next calving was not (yet) available, we assumed that the last artificial insemination led to a conception, except if the resulting gestation length was abnormally large. When there was no successful insemination, DCC was zero. When DCC was less than 100 days, the effect of gestation on the analysed traits was assumed to be nil. The DCC effect ranged from 100 to 265 days. It was assumed that the effect of DCC did not differ over DIM because large DCC values are only observed in late lactation stages while small DCC values were assumed to have small effects not varying much with DIM. Four-knot regression splines with knots at DCC 100, 150, 200 and 265 (Druet et al., Reference Druet, Jaffrézic, Boichard and Ducrocq2003) were used to model the effect of gestation. Curves for month of calving, age at calving, length of dry period and gestation were assumed to be independent and therefore the overall fixed part of the lactation curve of an animal can be described as the sum of elementary curves over the relevant effects.
The definition of the fixed effect classes was based on the current lactation model used for the national evaluation. In the national data file, three regions were defined based on seasonal patterns and feeding systems. However, data from the Jura subset considered in this study were from the same region. Twelve seasons of calving were defined based on calendar months. Most calvings occurred during the autumn, with a peak in September (26.4% of the first lactations in the ‘Jura 2005’ data file). Recently, the main calving season occurred earlier (August to November in 2004 v. September to December in the 1990s). For the calving age effect, 24 age classes were formed: 10 for first lactation by 2-month classes starting at 22 months, the last one including calving at 40 months and more, 7 for the second lactation by 3-month classes (⩽36, 37 to 39, …, ⩾52) and 7 for the third lactation by 3-month classes (⩽48, 49 to 51, …, ⩾64). The desired age at first calving for the Montbéliarde breed is usually between 32 and 36 months (61.3% of the data), corresponding to extensive management of heifers. In contrast, first-lactation cows having very young calving (22 to 23 months) represented only 0.09% of calving age class for first-lactation cows. For length of dry period, five classes were created for second- and third-lactation cows: dry period ⩽25, 26 to 45, 46 to 60, 61 to 75 days, and ⩾76 days. A specific class was created for heifer effects (first-lactation cows). In fact, dry period length ⩽25 days represented around 2% of the data for second and third lactations each, whereas the dry period length between 61 and 75 days represented around 40% of the data for second and third lactations. For all interaction effects, at least 100 TD yields were required to take year × parity × effect interaction into account and 250 for the interaction parity × effect.
Random effects
The covariance matrix of the random effects was
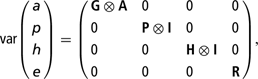
where G, P and H were the random regression covariance matrices initially modelled from two coefficients (three for herd–year of calving) by parity for the genetic, permanent environment and herd–year of calving effects estimated previously (Druet et al., Reference Druet, Jaffrézic and Ducrocq2005), of which ranks were reduced from six to four for G and P and from nine to six for H. The four selected eigenvectors explained 98.4% of the total genetic variation in the three lactations and 87.6% for the permanent environment variance. For the herd–year of calving variance, the first six eigenvectors explained 99.7% of the total variance. A was the additive genetic relationship matrix, and R was the residual variance, expressed as a function of 12-knot regression splines of DIM separately for the three lactations (Druet et al., Reference Druet, Jaffrézic and Ducrocq2005). Other sources of variance heterogeneity, e.g. due to herd–year effect were not accounted for, although they will be in the national genetic evaluation. Phenotypic variance was ensured to remain the same before and after rank reduction by adding the loss of variance in G, P and H to R. The heritability ranged from 0.23 to 0.44 depending on DIM.
Computational approach
Determination of environmental effects affecting the lactation curves
Six models were compared using the ‘Jura test’ data to assess different models for the fixed part of the lactation curve.
The Meff × year model (2) was defined as
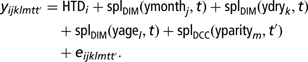
Unlike the fixed effects in model (1) used as reference, model (2) did not include any constant taking year interaction into account. Instead, year interaction was included in the lactation curve modelling. Hence, the four spline functions included in model (2) accounted for the effects of year–parity–class of calving month (ymonth), year–parity–class of dry period length (ydry) and year–parity–class of calving age (yage) on variable DIM t. SplDCC was a regression spline modelling the effect of gestation of year–parity (yparity) m on DCC t′.
The Meff model (3) was equivalent to the fixed part of the model (1): the regression splines modelling the lactation curve did not include any interaction with year in the definition of classes (month = parity–class of calving month n, dry = parity–class of dry period length o, age = parity–class of calving age p). The only interaction terms including the year effect were the fixed effects ymonth, ydry and yage. In other words, the Meff model assumed that the spline functions differed over years only by a constant.
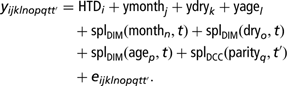
The last four models were derived from the Meff model by excluding one type of regression splines at a time: the Meff–age model was equivalent to the Meff model without regression splines on the calving age effect. Similarly, in the Meff–dry, Meff–month and Meff–gest models, regression splines for length of dry period, calving month and gestation effect were excluded, respectively.
The daily milk productions recorded in the ‘Jura test’ data file (2 406 345 TD) were used to compare these models through an analysis of the residuals obtained for each of these six models. Because of memory requirements for the Statistical Analysis Systems GLM procedure used, the analyses of variance (ANOVA) were applied only to the last 6 years of the data file (1 201 018 observations). The residuals were on average equal to zero for the whole range of DIM or DCC values and for various effect combinations not included in the model. In a first step, the residuals of the Meff × year and Meff models were compared using an ANOVA with class of 20 days of milk (cl(DIM)), class of 10 days of carried calf (cl(DCC)), ymonth, ydry, yage, interaction between ymonth and cl(DIM), interaction between ydry and cl(DIM), interaction between yage and cl(DIM), interaction between yparity and cl(DCC) as the class variable. This enabled to assess the need to include interaction with year in the elementary curve definition. In a second step, residuals of the Meff, Meff–age, Meff–dry, Meff–month and Meff–gest models were analysed using cl(DIM), cl(DCC), ymonth, ydry, yage, interaction between month and cl(DIM), interaction between dry and cl(DIM), interaction between age and cl(DIM), interaction between yparity and cl(DIM) and interaction between parity and cl(DCC) as the class variable. This allowed assessing whether each elementary curve, i.e. for calving month, calving age, length of dry period and gestation effects was needed in the model.
In addition to the residual analyses, the models were compared on the basis of graphical analysis of the lactation curves obtained with the ‘Jura test’ data (2 406 345 test-day).
A two-step approach for the solution of the mixed model equations
To reduce computational requirements and computing time when fitting the extended model, ‘Jura 2005’ data were first pre-adjusted for effects related to the shape of the lactation curve with no year interaction (parity-class of calving month, parity-class of dry period length and parity-class of calving age with 6-knot regression splines each and gestation effect with 4-knot regression splines, i.e. 22 spline coefficients) running a model including only fixed effects as in the Meff model (1). In a second step, pre-adjusted records were analysed using a model including the HTD effect, three fixed effects with year interaction (ymonth, ydry and yage) and four additive genetic effects, four permanent environment effects and six herd–year of calving effects, i.e. 18 effects, instead of 40, in a one-step approach.
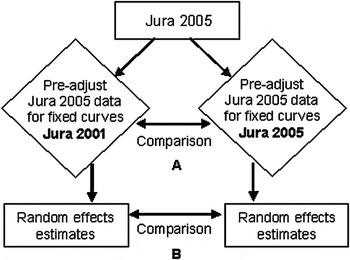
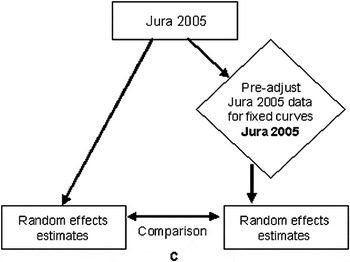
For practical implementation of the pre-adjustment, one element of interest was the stability of regression splines over years and with data files including more and more observations. If spline coefficients really do not depend on year, lactation curves should be consistent whether they are estimated from the ‘Jura 2005’ data set or a subset truncated 4 years earlier (TD data collected between September 1988 and December 2001), hereafter referred to as the ‘Jura 2001’ data set. In addition to correlations between spline coefficients, both the genetic and permanent environment values estimated from the ‘Jura 2005’ data file pre-adjusted for lactation curves estimated from the ‘Jura 2001’ data file on the one hand and the ‘Jura 2005’ data file on the other hand were compared (Figure 1). Moreover, it was important to know whether the data pre-adjustment for the lactation curve itself did not induce variation of the random effect solutions of the model. Therefore, genetic and permanent environment values obtained for each 305-day lactation with a one-step procedure were compared with the ones obtained with the two-step procedure for the ‘Jura 2005’ data file (Figure 2).
Approach implemented to check consistency of the shape of the lactation curves over years.

Approach implemented to assess the impact of a two-step v. a one-step genetic evaluation.

Results
Comparison of six models to select environment fixed effects
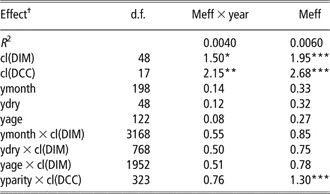
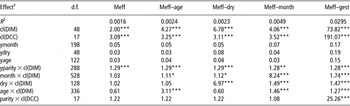
The results of the comparison of the Meff × year and Meff models are given in detail in Table 2. The largest F values were for cl(DCC). The impact of gestation through DCC in the Meff × year model was not better modelled than with the Meff model, with F values of 2.15 and 2.68, respectively. In all models, the effect of gestation on milk production was only taken into account for DCC ⩾100. In the GLM analysis, cl(DCC) analysed DCC by 10-day class, except for DCC <100 they were merged into a single class. For cl(DIM), F values were also significant but limited in both models. None of the interactions including year had a significant F value, except the interaction between yparity and cl(DCC) with the Meff model. There was a small increase in F value between the Meff × year and Meff models underlying that the definition of gestation effect in the Meff model (4-knot regression splines on DCC defined by parity) was slightly less efficient than the Meff × year model (4-knot regression splines on DCC defined by yparity). However, the large number of records involved in the analyses had the consequence of making some of the effects significant, although their influence in the overall variation may be very small. The R 2 obtained for the GLM analysis of the residuals of models Meff × year and Meff, with values of 0.0040 and 0.0060, respectively, showed the low impact of all effects included in the residual analyses.
F statistics and R 2 of the GLM analysis of residual from two models (Meff × year: lactation curves (calving month, length of dry period, calving age and gestation) defined using splines including year interaction (Meff: lactation curves defined using splines without year interaction)

†Classes included in the analysis were the following: classes of 20 days of milk (cl(DIM)), classes of 10 days of carried calf (cl(DCC)), year–parity–calving month (ymonth), year–parity–length of dry period (ydry), year–parity–calving age (yage), interaction ymonth × cl(DIM), interaction ydry × cl(DIM), interaction yage × cl(DIM), interaction year–parity (yparity) × cl(DCC).
The results obtained on the Meff model were used as the reference in the comparison of Meff, Meff–age, Meff–dry, Meff–month and Meff–gest models. The R 2 obtained for the GLM analysis of the residuals of the Meff, Meff–age, Meff–dry, Meff–month and Meff–gest models were 0.0016, 0.0024, 0.0023, 0.0049 and 0.0295, respectively. For all models, the impact of cl(DIM) and cl(DCC) were similar to the one described previously, i.e. significant (Table 3). The interaction yparity × cl(DIM) was significant but presented a small F value (i.e. 1.28 or 1.29) for all models. For all models, the deletion of the regression splines on the eff effects (month, dry and age) led to an increase of the F value for the interaction eff × cl(DIM) in comparison with the Meff model. The removal of the regression splines on gestation effect (Meff–gest) resulted in a jump of the F value from 1.22 to 25.26 for the interaction parity × cl(DCC), cl(DCC) soaring from 3.09 to 191.07. To sum up, all effects included as elementary curves in the model were significant, with in descending order of impact on TD production the gestation, calving month, length of dry period and calving age effects. Considering that the Meff model had 15 times fewer regression splines to estimate and that convergence was faster than the Meff × year model, the Meff model seemed to be a very good compromise.
F statistics and R 2 of the GLM analysis of residual from five models (Meff: lactation curves (calving month, length of dry period, calving age and gestation) defined using splines including parity interaction; Meff–age: lactation curves (calving month, length of dry period and gestation); Meff–dry: lactation curves (calving month, calving age and gestation); Meff–month: lactation curves (length of dry period, calving age and gestation); Meff–gest: lactation curves (calving month, length of dry period and calving age))

†Classes included in the analysis were the following: classes of 20 days of milk (cl(DIM)), classes of 10 days of carried calf (cl(DCC)), year–parity–calving month (ymonth), year–parity–length of dry period (ydry), year–parity–calving age (yage), interaction year–parity (yparity) × cl(DIM), interaction parity-calving month (month) × cl(DIM), interaction parity–length of dry period (dry) × cl(DIM), interaction parity–calving age (age) × cl(DIM), interaction parity × cl(DCC).
Comparison of lactation curves obtained from the Meff × year and Meff models
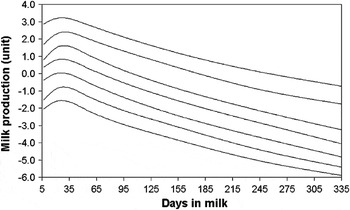
The 541, 357 and 165 curves on ymonth, yage and ydry effects, respectively, and the 46 yparity curves on gestation effect of the Meff × year model were plotted by year, by parity and by effect (class of calving month, class of calving age, class of dry period length, respectively). Curves showing parity × class of effect according to year effect all presented similar profiles. For instance, curves obtained for the period 1990/1991 to 2002/2003 on the second lactation Montbéliarde cows calving between 43 and 45 months (‘Jura test’ data file) on TD milk production are displayed in Figure 3. For clarity of presentation, only curves obtained every 2 years were plotted, adding an arbitrary constant of one unit around peak yield days to each one (at DIM = 32 days). No large interaction between year and parity × class of calving age was noticed. Only small changes in shape at the beginning of the lactation and a slower decrease for curves of recent years (the top ones) were observed. Similar results were obtained for other effects: ymonth, ydry and gestation (results not shown). When curves estimated with the Meff × year model are regressed on a mean curve for each effect plus a constant year effect, the R 2 of the regression was 0.984 for the calving month effect, 0.993 for the calving age effect, 0.994 for the length of dry period effect and 0.995 for the gestation effect. These results confirmed that the inclusion of year interaction in the spline definition was not necessary.
Effects of years 1990/1991 to 2002/2003 for second lactation Montbéliarde cows calving between 43 and 45 months on test-day milk production modelled with 6-knot splines (only alternate yearly curves separated by a value of 1 at DIM 32 are shown).

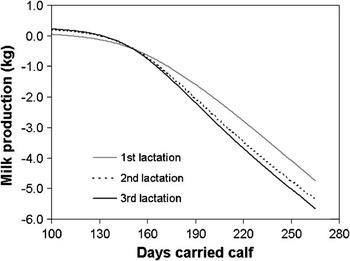
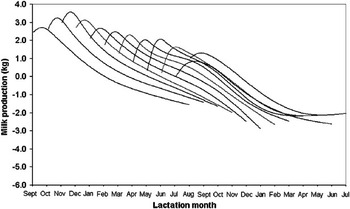
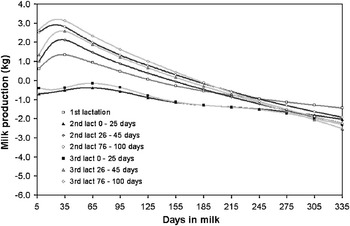
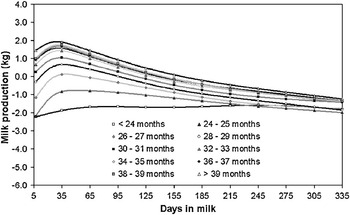
The impact of gestation on milk production modelled with 4-knot regression splines beyond 100 days of carried calf was plotted for the three parities (Figure 4). With a value around zero at 100 days, milk production in first lactation decreased more slowly than in the second and third lactations. The average loss of production at DCC 230 (i.e. a common time point when drying-off occurs 2 months before the next calving) in comparison with a non-pregnant cow was 3.2 kg for a first-lactation cow and 4.1 kg for a third-lactation cow (4.7 and 5.7 kg at DCC 265, respectively). Curves for calving month classes showed large variations across month and parity. They were plotted for second lactation in Figure 5, without making any adjustment for HTD effect. The largest peak production on second parity was observed for cows calving in November, whereas the lowest was for cows calving in July. The analysis of the length of dry period class effect (Figure 6) showed that the first-lactation cows class (that could be used as reference: no effect of dry period length) had an intermediate impact on milk production. The 46 to 60 days and 61 to 75 days classes for both second and third lactation were not drawn in Figure 6. All corresponding curves would remain between the third lactation 26 to 45 days class and the third lactation 76 to 100 days class, with the curves not showing any specific impact of those classes of dry period length. Only a dry period ⩽25 days for second and third lactations largely penalised milk production. Around peak production, cows dried during 25 days or less (i.e. 2% of the data) had a milk production loss between 2.5 and 3.5 kg in comparison with other classes of dry period length. Regarding the calving age effect (Figure 7), for first lactation Montbéliarde cows, calving between 30 and 39 months and more did not seem to have a large impact on the curve shape since all these curves overlapped each other. Similar characteristics were observed for second and third lactations. However, for first-lactation cows calving before 28 months of age, milk production was penalised, especially for cows calving before 24 months.
Days of carried calf effects on Montbéliarde test-day milk production modelled with 4-knot splines for first- to third-lactation cows.

Month of calving effects on Montbéliarde test-day milk production modelled with 6-knot splines for second-lactation cows.

Effects of length of dry period on Montbéliarde test-day milk production modelled with 6-knot splines.

Calving age effects on Montbéliarde test-day milk production modelled with 6-knot splines for first-lactation cows.

Impact of spline coefficients estimated at different dates
Two series of estimated regression spline coefficients were calculated: the first series with the ‘Jura 2001’ data file and the second series with the ‘Jura 2005’ data file. The correlations between the spline coefficients estimated with these two data sets were not as high as expected. For milk yield, the mean value was 0.985. When two corresponding splines were plotted, the shapes were not exactly the same, but it was difficult to determine if the differences were really significant over the whole lactation. However, the consistency of data pre-adjustment over years was verified through the stability of random estimates. The solutions for genetic and permanent environmental effects running the second step of the model on ‘Jura 2005’ data after pre-adjustment for lactation and gestation splines estimated from ‘Jura 2001’ and ‘Jura 2005’ data files were compared. Correlations for each of the four associated coefficients were between 0.99935 and 0.99987 for genetic effect and between 0.99941 and 0.99985 for the permanent environment effect (results not shown). When the solutions were brought back to a lactation value (one to three), all the correlations were between 0.99991 and 0.99997 for genetic effect and between 0.99969 and 0.99994 for the permanent environment effect. In other words, genetic and permanent environment values were not modified when the data were pre-adjusted with spline coefficients calculated 4 years before.
Impact of two-step procedure v. one-step procedure
Very high correlations were obtained for both genetic and permanent environment effects. When the solutions were expressed as lactation values (1 to 3), the correlations were between 0.9984 and 0.9992 for the genetic effect and between 0.9981 and 0.9991 for the permanent environment effect. Furthermore, similar correlations were obtained for milk trait analysed with the complete Montbéliarde data file (i.e. 21 128 460 TD) with a minimum value of 0.9996 for both genetic and permanent environment effects. Computing time was reduced by a factor of four when the two-step procedure was used, compared with the one-step procedure.
Discussion
As reported by many authors (Wood, Reference Wood1969; Danell, Reference Danell1982; Wilmink, Reference Wilmink1987b; Pérochon et al., Reference Pérochon, Coulon and Lescourret1996), this study showed that daily yield was strongly affected by environmental factors such as region, year, parity, month of calving, age at calving, length of dry period before calving and pregnancy. In the 1980s, the objectives of most studies were to develop additive or multiplicative adjustment factors for lactation yield. Most models did not take into account the changes in the shape of the lactation curves due to environmental factors, except in the case of the Wilmink curve (Wilmink, Reference Wilmink1987b). Nowadays, with TD model genetic evaluation, these changes on the shape of the lactation curves can be modelled more easily. Some of the studied factors, like parity, month of calving, age at calving, length of dry period and pregnancy showed a large effect on the shape of the lactation curve, whereas others like interactions including year effect affected lactation curve only through a constant over the whole lactation. Parity had a large effect on variation in both the scale and shape of the lactation curve. Daily milk yield increased until about 25 to 50 days post partum depending on the environmental factors. Cows with unfavourable environmental factors had a delayed peak in their lactation, e.g. first-parity cows v. later parities, cows calving in the spring and summer v. cows calving in the autumn and winter, cows calving younger within parity v. older ones. For instance, cows calving at 24 or 25 months had a peak production around 48 days after calving whereas cows calving at 34 or 35 months had peak production around 32 days for a first lactation. As mentioned by Wilmink (Reference Wilmink1987b), milk yield differences between classes were found to be the largest at the beginning of lactation and were almost zero at the end of lactation. For instance, differences for second-parity cows between a length of dry period ⩽25 days and a length of dry period of 76 to 99 days were 3.3 kg around yield peak and 0.8 kg in the last-third of lactation (at DIM 215).
Pregnancy effects
Pregnancy had a significant effect on daily milk yields (Table 3). In our model, the penalising effect of pregnancy on milk yield was assumed to begin 100 days after conception. However, elementary curves representing the effect of gestation on milk production showed that in fact the negative effect of pregnancy began at DCC 112, 131 and 132 for first-, second- and third-lactation cows, respectively. The results observed were in agreement with the stage of 100 to 150 days after conception reported by many authors (Oltenacu et al., Reference Oltenacu, Rounsaville, Milligan and Hintz1980; Danell, Reference Danell1982; Coulon et al., Reference Coulon, Pérochon and Lescourret1995). Similar to many other authors (Louca and Legates, Reference Louca and Legates1968; Oltenacu et al., Reference Oltenacu, Rounsaville, Milligan and Hintz1980; Coulon et al., Reference Coulon, Pérochon and Lescourret1995), we also observed that the effect of pregnancy was lower in primiparous than in multiparous cows. The milk yield drop-off observed at DCC 230 (Figure 4) was consistent with the 3.0 to 5.0 kg/day reported by Danell (Reference Danell1982) for Swedish Red and White and Swedish Friesian. On a TD model considering only fixed effects, Bohmanova et al. (2006) observed a drop-off of 4.2 kg v. 3.5 kg for a first-lactation cow and 5.2 kg v. 4.1 kg for a third-lactation cow in the Holstein and Ayrshire breeds, respectively. The reduction of milk yield during pregnancy has been attributed to a modification in the hormonal balance linked to foetal growth. Changes in placental steroid hormones, increased oestrogens in particular, from the second-third of pregnancy were considered to be responsible (Bauman and Currie, Reference Bauman and Currie1980; Oltenacu et al., Reference Oltenacu, Rounsaville, Milligan and Hintz1980). Foetus growth might have an impact on rumen volume and distribution of nutrients between the foetus, milk synthesis and replenishment of energy reserves for the next lactation (Oltenacu et al., Reference Oltenacu, Rounsaville, Milligan and Hintz1980). However, foetus growth essentially occurred during the last 2 months of pregnancy (Bauman and Currie, Reference Bauman and Currie1980), when cows were usually dried off. Taking the effect of pregnancy on milk production into account requires the knowledge of conception date. Two limits can be mentioned in the establishment of pregnancy effect. First, when the date of next calving was available, we assumed the usual gestation length for the Montbéliarde breed. In case of abortion, gestation effect was not properly taken into account. Secondly, when the date of next calving was not (yet) available, we assumed that the last artificial insemination led to a conception, which was not always the case in reality. However, an effect of pregnancy starting at DCC 100 limits the risk to attribute this effect to a non-pregnant cow, except if this cow was intentionally not re-inseminated.
Calving month effect
Many authors mentioned calving month as an effect with considerable influence on the cow’s milk production (Wood, Reference Wood1969; Danell, Reference Danell1982; Wilmink, Reference Wilmink1987b; Ptak et al., Reference Ptak, Horst and Schaeffer1993). In this study, the effect of calving month was found to be significant on daily milk yield (Table 3). Time of peak yield changed with calving month. It occurred earlier in autumn and winter calvings (about 25 to 30 days for multiparous cows) and later in spring and summer calvings (about 30 to 45 days for multiparous cows). Cows calving in the autumn and winter had a higher 305-day production than cows calving in the spring and summer. Similar features were reported by Danell (Reference Danell1982), Wilmink (Reference Wilmink1987b) and Ptak et al. (Reference Ptak, Horst and Schaeffer1993). Cows calving in November produced 449, 475 and 456 kg more in the first, second and third lactations, respectively, in comparison with cows calving in July. Danell (Reference Danell1982) mentioned that the yield differences between the months with the highest v. lowest production were about 350 kg milk, i.e. 100 kg less than what was found in this study. Month of calving did not affect yield in the same way at the beginning and at the end of lactation. The shape of the lactation curve was found to be largely dependent upon month of calving (Figure 5) as reported by Danell (Reference Danell1982). Spring-calving cows produced most in early lactation taking advantage of better/higher fodder supply and quality, whereas autumn-calving cows produced more in late lactation. In this study, the interaction between calving month and year were assessed to be non-significant for the shape of the lactation curves based on residuals and lactation curve analysis. However, Danell (Reference Danell1982) and Ptak et al. (Reference Ptak, Horst and Schaeffer1993) mentioned the existence of an interaction between month of calving and year due to changes in herd management or in weather conditions, but stated that the general pattern seemed to be the same overall. In the Meff model, which will be used in the French genetic evaluation, the interaction between calving month and year was included through a constant over years.
Length of dry period effect
As reported by Schaeffer and Henderson (Reference Schaeffer and Henderson1972) and Pérochon et al. (Reference Pérochon, Coulon and Lescourret1996), the results obtained in this study showed a significant effect of length of dry period on lactation curve (Table 3). As we observed, the first classes showed that a dry period of ⩽ 1 month had a negative effect on the subsequent lactation. For them, cows with a dry period of 50 to 59 days gave the highest average production, without great difference between classes 40 to 49 and 60 to 69 days, but milk production following a very long dry period (more than 120 days) was lower. In our study, the second and third lactations presented similar lactation curves, in contrast with Schaeffer and Henderson (Reference Schaeffer and Henderson1972) who found that parities later than the second one are less affected by length of dry period. Based on the large difference observed between curves corresponding to classes 0 to 25 and 26 to 45 days of dry period for the second and the third lactations (Figure 6), the class definition used for this study did not appear appealing. For the routine evaluation, new definition of traits with six classes instead of five will be used, i.e. 0 to 15, 16 to 30, 31 to 45, 46 to 60, 61 to 80 and ⩾81 days. Schaeffer and Henderson (Reference Schaeffer and Henderson1972) mentioned that length of dry period influenced the survival of cows in the following lactation. Under normal management conditions, the dairy cows are overfed during the last-third of lactation to replenish body energy stores in preparation for the next lactation. One possible explanation of a lower production level after a short dry period was the competition for nutrients between the foetus, the current lactation and the cow replenishment. During the 1st month of lactation, the body reserves being utilised are energetically equivalent to about 23% of the milk produced (Bauman and Currie, Reference Bauman and Currie1980). Thus, without a sufficiently long dry period, cows might have a lower production in the next lactation or a lower survival rate. Another explanation could be the effect of a premature calving or abortion.
Calving age effect
A large number of authors such as Danell (Reference Danell1982), Wilmink (Reference Wilmink1987b) and Ptak et al. (Reference Ptak, Horst and Schaeffer1993) mentioned age at calving as a factor affecting lactation milk yield, and dependent on lactation stage. In this study, the model comparison step (Table 3) showed a significant effect of calving age on the lactation curve. Daily milk yield increased with increasing age at calving. Danell (Reference Danell1982) reported that a 1-month increase in age at first calving raised milk yield during lactation by about 50 kg. This corresponds to a higher value than the 590 kg milk yield difference between extreme classes of first-parity cows found here. However, differences between age classes decreased with parity, with 290 kg in second parity and 170 kg in third parity. As mentioned previously, the effect was the largest for TDs early in lactation e.g. 3.8 kg around peak production against 1.1 kg in the last-third of lactation (at DIM 215) between extreme classes of first parity (Figure 7).
Comparison with national fixed effects model from other countries
National genetic evaluation models for dairy traits are nowadays more and more often based on TD models instead of 305-day lactation models as in Canada, Denmark–Finland, Germany–Austria, Italy and The Netherlands (Interbull, 2007). In these countries, lactation curves were mainly modelled using Legendre polynomials of order four, Wilmink function or a mix of both, except for The Netherlands which included only constants over the whole lactation and modelled lactation curves as an interaction between parity and DIM. For most countries, effects of age at calving and/or calving season were included in the lactation curve modelling. However, few of these countries considered the impact of pregnancy on TD production. The Netherlands and Finland (Lidauer et al., Reference Lidauer, Mäntysaari and Strandén2003) included a constant defined by class of pregnancy stage, with an interaction with parity in the case of The Netherlands. In view of the large pregnancy effect affecting cows during the last-third of their lactation highlighted in this study, not taking this effect into account in the genetic evaluation model highly penalised cows with a short DO period. Recently, Canavesi et al. (2007) studied the pre-adjustment of TD records for the pregnancy stage. Some countries, like Canada, are studying the effect of pregnancy on the TD model (Bohmanova et al., 2006). The length of dry period was included only in The Netherlands and Denmark–Finland models. As for the pregnancy effects, cows with short dry period were found to be penalised.
Conclusion
In the Montbéliarde breed, the shape of lactation curves has not changed over the years. The changes of production curve shape over the years could only be related to changes of random effects, i.e. genetic, permanent environment and/or herd effects. This conclusion has a positive impact on the computation strategy to solve the mixed model equations. It was possible to pre-adjust TD records for time-independent fixed effects, i.e. lactation curves, in a first step. Random effects and year-dependent fixed effects were estimated in the second step. Our results validated this strategy since genetic and permanent environment effects obtained from a two-step procedure were virtually identical to those from a one-step procedure. Two main advantages can be put forward from this approach: it required less computing time (here reduced by a factor of four) and less memory (22 and 18 unknowns for the first and second steps, respectively, instead of 40 unknowns in a one-step procedure). Moreover, the first step (computation of the spline coefficients for fixed effects) does not necessarily have to be performed at each evaluation and could be done at broader intervals, for example once a year.
Acknowledgements
The research was partly funded by a grant from the French Ministry of Agriculture (Action Innovante UTILEG). This study was realised within the framework of the Unité Mixte Technologique (Joint Technology Unit) INRA – Institut de l’Elevage dealing with cattle genetic evaluation.