

1. Introduction
There has been a surge in Preferential Trade Agreements (PTAs) since the early 1990s. By December 2008, 421 PTAs had been notified to the World Trade Organization and 230 of those were already in force.Footnote 1 This led to a concern that PTAs may act as a ‘stumbling block’ to global free trade. Despite a significant theoretical literature on the effects of PTAs on trade liberalization toward non-member countries, no consensus has been reached on whether preferential agreements provide an incentive for its members to reduce or increase the tariffs that they impose against non-members.Footnote 2 Moreover, although there have been some important contributions, there is still not much empirical evidence on this important question (we review the relevant literature in Section 2).
In this paper, we empirically examine the relationship between preferential trade liberalization and tariffs applied against non-member countries for the case of DR-CAFTA, the free trade agreement signed by Costa Rica, the Dominican Republic, El Salvador, Guatemala, Honduras, Nicaragua, and the United States in 2004. We use data on preferential tariffs (obtained from the tariff schedules for each country from the agreement) as well as applied most-favored nation (MFN) tariffs from 2005 to 2009.Footnote 3 We focus on the four Central American countries for which the agreement has been in force since 2006: El Salvador, Guatemala, Honduras, and Nicaragua. We are not able to include Costa Rica, since the agreement entered into force there only in 2009. Similarly, we do not include the Dominican Republic because the agreement entered into force in that country in 2007 and MFN tariff data for it are only available until 2006. We do not focus on the United States which, given its status as a large developed country, is likely to bring in considerable differences and unobserved heterogeneity. Limão (Reference Limão2006, Reference Limão2007) has studied the effect of PTAs on multilateral trade liberalization by the United States under the Uruguay Round.
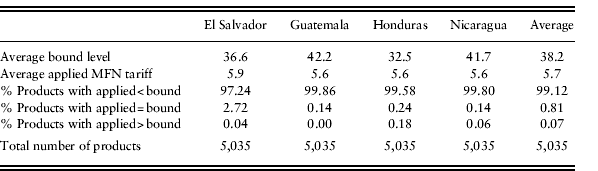
Our strategy is to study whether products that experienced larger decreases in preferential tariffs under the free trade agreement had their MFN tariffs increased or decreased relative to the other products. A question that arises at this point is whether the countries included in our sample had room to increase their applied tariffs against non-members given their WTO commitments.Footnote 4 The information presented in Table 1 indicates that was indeed the case. The table shows the average WTO tariff binding for each country as well as their average applied tariffs. While the average binding level for the four countries combined is 38.2 percentage points, the average applied MFN tariff is only 5.7 percentage points. Moreover, more than 99% of the products (defined at the 6-digit harmonized system (HS) level) had applied MFN tariffs lower than their corresponding bound levels in 2005, indicating that for the large majority of products there was room for tariff increases.Footnote 5
WTO bindings and applied MFN tariffs in 2005

Source: Bound levels are from the WTO and applied MFN tariff levels are from Trains and WTO, accessible via WITS.
We find that MFN tariffs were increased (or reduced less) in products with larger reductions in preferential tariffs. When we split the sample into two sub-periods, we find that such negative relationship between changes in preferential and MFN tariffs is present in the first half of the sample period (2006–2007), but not in the second (2008–2009). For the latter sub-period, we find some evidence of a positive relationship between both variables. We control for different types of unobserved heterogeneity by including fixed effects, as well as for other variables that may affect applied MFN tariffs, and we use an instrumental variables approach to address potential endogeneity, as we describe in detail in Section 3. Our results are also economically significant. In 2006–2007, a one standard deviation increase in the preferential tariff reduction leads to an increase of 1.2 percentage points in the MFN tariff, which is equivalent to 12% of the median MFN tariff in the sample (the median MFN tariff is 10 percentage points).Footnote 6 For 2008–2009, we find that a one standard deviation increase in the preferential tariff reduction leads to a decrease of 0.1 percentage points in the MFN tariff, or 1% of the median MFN tariff. However, the findings for 2008–2009 are not robust to all the specifications we consider. Therefore, the results provide evidence of an initial stumbling block effect of preferential liberalization on unilateral trade liberalization toward non-members, followed by a smaller building block effect, although the evidence on the latter is not as strong.
This paper is closest in methodology to Estevadeordal et al. (Reference Estevadeordal, Freund and Ornelas2008); however, we extend their methodology in the following ways. We conduct the analysis at the 6-digit HS product level, while they use much more aggregated industry-level data. Moreover, they do not provide evidence on the behavior of the effect of preferential liberalization over time. In addition, we include some other control variables that have been suggested by the literature and can affect changes in MFN tariffs, as discussed in Section 5.2. We also discuss what mechanisms may be behind the stumbling block effect that we find. Importantly, our results differ from theirs, as they provide evidence of a building block effect of preferential liberalization in a sample of Latin American countries in the 1990s.Footnote 7
It is important to determine the effect of a PTA on the tariffs imposed against non-member countries since this has implications for the welfare impacts of the agreement. For example, Panagariya and Krishna (Reference Panagariya and Krishna2002) show that, if after a free trade area is formed, each of its members import the same vector of quantities from the rest of the world as they did before the formation of the free trade area, the joint welfare of the members increases, and that of the rest of the world does not fall. Moreover, in the case of CAFTA in particular, since preferential liberalization is scheduled to continue over the next years for some products, the results are also relevant for policy decisions regarding applied external tariffs in the near future.
In the next section, we review the literature on preferential trade agreements and external trade liberalization. In Section 3, we describe the econometric specification and methodology that we employ. The data that we use are described in Section 4. Section 5 presents the results. We discuss what forces may lay behind the stumbling block effect of preferential liberalization that we find in Section 6. In Section 7, we discuss some policy implications and conclude.
2. Literature
The theoretical literature has not reached a consensus regarding the effect of preferential trade agreements on trade liberalization toward non-member countries. For example, Bagwell and Staiger (Reference Bagwell and Staiger1997) find three different effects of preferential trade agreements on multilateral liberalization. First, what they call the tariff complementarity effect leads to lower external tariffs due to the complementary nature of tariffs applied by a country on its exporting partners, which can help reduce trade diversion. Second, the punishment effect weakens the member countries’ ability to punish the non-member countries for deviating from the multilateral agreement (given the aforementioned incentive to keep lower tariffs against them) and thus works to increase their tariffs. Finally, the tariff discrimination effect allows member countries to discriminate against the non-members who would free ride under MFN and thus tends to increase the external tariffs. Depending on the relative strength of the three effects, preferential trade agreements could act as a stumbling bloc or a building bloc to multilateral trade liberalization.Footnote 8
Other studies that show a ‘tariff complementarity’ effect include Bond et al. (Reference Bond, Riezman and Syropoulos2004), who show that a free trade agreement leads members to reduce their external tariffs.Footnote 9 In addition, Richardson (Reference Richardson1993) argues that, as tariff-free imports increase with a preferential trade agreement, domestic industries experience a decrease in their output and thus political power, which leads to lower protection given to those industries. Ornelas (Reference Ornelas2005) uses a political-economy oligopoly model to show that a PTA induces its members to lower protection toward non-members (and this can in turn reduce non-member countries’ support to multilateral liberalization, by lowering their gains). Freund (Reference Freund2000) also finds a ‘tariff complementarity effect’ in an oligopolistic model.
Nonetheless, other authors have shown that PTAs can lead to higher tariffs against non-members. Panagariya and Findlay (Reference Panagariya, Findlay, Feenstra, Grossman and Irwin1996) show that PTAs lead to an increase in external protection as lobbying against the non-member countries becomes more attractive. Using a median voter model, Levy (Reference Levy1997) shows that a FTA can undermine support for multilateral liberalization and make a previously feasible multilateral agreement become unfeasible. Krishna (Reference Krishna1998) uses a political economy model with oligopoly to show that preferential trade agreements that generate more trade diversion are more likely to be politically supported by their members, and that they could make multilateral liberalization that was initially politically feasible become unfeasible. This is because the rents that producers get in the partner country due to trade diversion would be lost. Cadot et al. (Reference Cadot, de Melo and Olarreaga1999) argue that under a FTA at least one member's tariffs may increase due to a general equilibrium wage effect – as the sectors that compete with FTA imports shrink and release labor, the wage decreases and the sector that competes with the rest of the world expands and gains political weight. Limão (Reference Limão2007) uses a model of PTAs that involve cooperation on non-trade issues to show that PTAs act as a stumbling block to global free trade. By lowering preference margins given to PTA partners, a reduction in a country's external tariffs would in turn decrease the level of cooperation in non-trade issues that it can obtain. Therefore, these PTAs generate an incentive for countries to maintain higher external tariffs. Tovar (Reference Tovar2010) shows that if individual preferences exhibit loss aversion or if the government's objective is characterized by diminishing marginal political support, a free trade area can lead member countries to increase their external tariffs. The reason is that in such cases the reduction in the industry's output (and profits), due to additional competition by imports from the partner country, provides an incentive for higher protection.
Finally, Bagwell and Staiger (1997) show that free trade agreements lead to an initial increase in external tariffs, followed by an eventual reemergence of multilateral cooperation. The initial tariff increase takes place during the transition period, in which the agreement is negotiated and implemented. The reason is that the expectation that trade flows between member and non-member countries will decrease due to trade diversion reduces the gains from cooperation. However, once the full impact of the agreement has been felt, the initial balance between the gains from deviation and the gains from cooperation is restored, and thus lower tariffs (equal to those that would prevail in the absence of a free trade agreement) can arise.
Despite the lack of theoretical consensus, there is still not much empirical evidence on the effect of regionalism on external trade liberalization. Magee and Lee (2001) examine both, effects leading to higher and lower external tariffs due to the formation of a customs union, and they find that in the case of the European Economic Community the latter dominated, generating a decrease in common external tariffs in manufactures from 1968 to 1983, using data for 51 industries.Footnote 10 Bohara et al. (Reference Bohara, Gawande and Sanguinetti2004) focus on the effects of Argentina's imports from one of its Mercosur partners (Brazil). They find that Argentina's external tariff on imports from non-Mercosur countries fell in products that experienced more trade diversion due to imports from Brazil, but they do not focus on the effect of preferential tariffs directly. Estevadeordal et al. (Reference Estevadeordal, Freund and Ornelas2008) use data on ten Latin American countries from 1990 to 2001 and find that preferential tariff reductions in a given sector led to a decrease in the external tariff in that sector (the effect is present for FTAs but not for customs unions).Footnote 11
However, some studies focusing on multilateral trade liberalization find different results. Limão (Reference Limão2006, Reference Limão2007) studies the effect of preferential trade agreements on multilateral trade liberalization by the United States under the Uruguay Round. He finds that US reductions in multilateral tariffs were smaller for products that were imported under its preferential trade agreements relative to products imported only from non-member countries. Similarly, Karacaovali and Limão (Reference Karacaovali and Limão2007) focus on the effect of preferential trade agreements on multilateral trade liberalization by the European Union and also find evidence of a ‘stumbling bloc’ effect.Footnote 12
This study is closest to Estevadeordal et al. (Reference Estevadeordal, Freund and Ornelas2008) in terms of methodology; however, they use data at the industry (4-digit ISIC (International Standard of Industrial Classification)) level, while our analysis is conducted at a much more disaggregated level (6-digit HS). Importantly, we find different results for CAFTA than they find for other FTAs in Latin America. This paper is thus the first to provide evidence of a stumbling block effect of PTAs on external unilateral trade liberalization. In addition, while the stumbling block results of Limão (Reference Limão2006) and Karacaovali and Limão (Reference Karacaovali and Limão2007) apply to large developed countries, we provide results for developing countries. Our findings also indicate the presence of some interesting dynamics resulting from the FTA, in the form of an initial stumbling block effect that is followed by a building block effect of preferential liberalization.
3. Econometric specification
To examine the relationship between preferential trade liberalization and external trade liberalization, we use data on the tariff schedules for each CAFTA country. These schedules establish how tariffs are to be reduced over time in each country according to the free trade agreement. We are interested in how changes in preferential tariffs affect MFN tariffs applied against non-member countries, and thus we define the basic estimating equation as:
 $$\Delta {\rm MFN}\;{\rm tariff}_{ijt} = \alpha _I + \alpha _j + \alpha _t + \beta (\Delta {\rm Pref}\;{\rm tariff}_{ijt} )\, + {\bf x}_{ijt} \theta + \varepsilon _{ijt} $$
where MFN tariffijt denotes the most-favored nation (MFN) tariff that country j applies on product i in year t; Pref tariffijt represents the preferential tariff that country j applies on product i being imported from another CAFTA member in year t; and Δ denotes the change in each variable between years t and t –1. While estimating the equation in differences allows us to eliminate some of the unobserved heterogeneity (e.g. product or country characteristics that do not change over time and affect the level of MFN tariffs), there may be unobservable industry characteristics that influence the changes in MFN tariffs – for example, lobbying for protection usually takes place at the industry level and this could affect the size of tariff changes – and thus we include an industry fixed effect, α I. There may also be country characteristics that affect changes in MFN tariffs, which we capture with a country fixed effect, α j. The term α t denotes the difference between year fixed effects corresponding to periods t and t –1. We will also estimate our baseline specifications using a broader set of fixed effects (e.g. country–year, country–industry, or country–product) for robustness, as described later on. The vector xijt includes other variables that may influence changes in MFN tariffs, which we describe below. Finally, ε ijt denotes the error term. We note that we drop the observations for which the MFN tariffs are initially set at zero. If the MFN tariff is initially zero, the preferential tariff will have to be set at zero also and this may bias the results.
The main coefficient of interest in equation (1) is β. If β > 0, it would indicate that as countries lowered their preferential tariffs under CAFTA, they also lowered the MFN tariffs that they impose on non-members. This would mean that preferential liberalization has been a building block for external trade liberalization. Conversely, if β < 0, it would indicate that CAFTA countries increased – or reduced by less – their MFN tariffs on products where preferential tariff reductions were larger. This would be evidence of preferential liberalization as a stumbling block to external trade liberalization.
The preferential tariff change variable may be subject to reverse causation because MFN tariff changes could in principle affect changes in the preferences that CAFTA members grant to each other. First, we should mention that the agreement (and thus the tariff concessions) was negotiated before 2006, the first year of preferential liberalization in our sample, and hence the changes in preferential tariffs were predetermined to the changes in MFN tariffs. However, if some MFN changes were expected at the time the preferences were negotiated, they could have affected the size of those preferences. The industry dummies partially address this, but there may also be unobserved product characteristics that could affect both a preferential tariff change and a subsequent MFN change. To address the potential endogeneity, we employ an instrumental variables approach. We use as instruments for a country's preferential tariff change the preferential tariff changes of its CAFTA partners. The correlations between the preferences given by the CAFTA countries we focus on are high (between 75% and 87% in our sample), and these are valid instruments as long as the preferential tariffs of a country's partners are not influenced by the same factors that determine that country's own MFN tariffs (cf. Estevadeordal et al., Reference Estevadeordal, Freund and Ornelas2008). We also assess the validity of the instruments using a test of overidentifying restrictions.
Furthermore, we test whether the effect of the FTA on MFN tariffs is also affected by the share of preferential imports. This would provide additional evidence of a causal relationship between preferential trade liberalization and external tariffs, as opposed to unobserved product characteristics that may lead to liberalize more in certain sectors, both preferentially and unilaterally. The share of preferential imports can affect MFN tariffs since it affects the degree of terms of trade loss due to the preferences granted (see Bagwell and Staiger, Reference Bagwell and Staiger1999; Richardson, Reference Richardson1993; among others). We discuss more details on how we include this and other variables in xijt in equation (1) in Section 5.
4. Data
Our estimation is based on data for El Salvador, Guatemala, Honduras, and Nicaragua at the 6-digit HS level from 2005 to 2009.Footnote 13 CAFTA was in force in those countries since 2006, and thus based on data availability we are able to use data on t = 2006–2009 to estimate equation (1).Footnote 14 As mentioned before, we do not include the Dominican Republic because MFN tariff data for it are only available until 2006 and the agreement entered into force in that country in 2007. Similarly, we cannot include Costa Rica because the agreement went into force there in 2009 only.Footnote 15
Data on MFN tariffs are from the WTO and UNCTAD, accessible via WITS (World Integrated Trade Solution).Footnote 16 The preferential tariffs were obtained from the tariff schedules from the agreement for each country. The countries in the sample are members of the Central American Common Market, a regional trade agreement that started with a treaty signed in 1960 by El Salvador, Guatemala, Honduras, and Nicaragua (Costa Rica joined two years later). Due to this, the tariff liberalization implemented under CAFTA effectively applied to the products imported from the Unites States as well as to the list of products that were exempt from the Central American Common Market and from the trade agreement between it and the Dominican Republic.Footnote 17 For all those products, MFN tariffs prevailed before CAFTA, and thus the ‘base rates’ from the schedules from the agreement that we use to start computing tariff changes are effectively the MFN tariffs. Bilateral import and export data at the product level were obtained from COMTRADE, also accessible through WITS. Data on tariff binding levels (described below) are from the WTO.
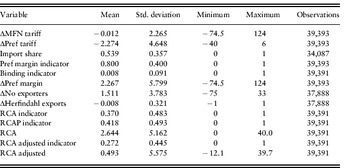
Table 2 provides summary statistics for the variables we employ. We first note that the average MFN tariff change for the whole sample is small, but this is partly due to the fact that there are both several products with tariff increases as well as products with tariff reductions. There are 862 HS-6 products with tariff increases and 841 products with tariff decreases in the sample.Footnote 18 We can also provide some preliminary evidence using the raw data. The average annual MFN tariff change for products with preferential tariff reductions higher in absolute value than the median preferential reduction in the sample is 0.325 percentage points. The average annual MFN tariff change for products with preferential tariff reductions lower than the median preferential reduction is –0.335 percentage points. Thus, we have that products that were liberalized more under CAFTA actually had their MFN tariffs increased on average, whereas products with lower preferences experienced a decrease in their MFN tariffs on average. The difference in the means is statistically significant at the 1% level according to a t-test.
Summary statistics

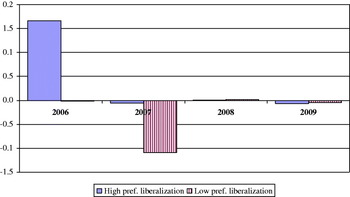
Interestingly, this also holds for the first two years in the sample (2006–2007), for which the average MFN tariff change for products with preferential tariff reductions higher than the median is 0.65 percentage points and the average MFN tariff change for products with preferential tariff reductions lower than the median is –0.66 percentage points, with the difference being also statistically significant at the 1% level. However, in the last two years in the sample (2008–2009), we find that the average MFN tariff change for products with preferential tariff reductions higher than the median is –0.034 percentage points and the average MFN tariff change for products with preferential tariff reductions lower than the median is –0.015 percentage points. Therefore, in the later period the products that were liberalized more under CAFTA experienced larger reductions in MFN tariffs on average, although the difference in the means is not statistically significant.
Figure 1 shows the average changes in MFN tariffs by year. Consider first the two initial years in the sample. In 2006, products with preferential tariff reductions higher (in absolute value) than the median preferential reduction from that year had their MFN tariffs increased on average, whereas products with preferential liberalization below the median were associated with an average (small) decrease in MFN tariffs. In 2007, products with high preferential liberalization (defined analogously) experienced lower decreases in their MFN tariffs on average than products with low preferential liberalization. These figures provide preliminary evidence of a stumbling block effect of preferential trade liberalization in 2006–2007: products with larger preferential tariff reductions experienced a larger increase (or smaller decrease) in their external tariffs on average. Now consider the period 2008–2009. In 2008, products with high preferential liberalization were associated with (slightly) lower increases in MFN tariffs on average than products with low preferential liberalization. In 2009, products with high preferential tariff reductions had their MFN reduced more on average, although in both cases the mean MFN tariff reductions were small. This suggests that there may be a small building block effect in the last two years.
Average change in MFN tariffs for 6-digit HS products with high and low preferential tariff reductions

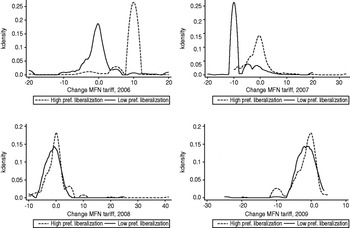
In Figure 2, we show kernel densities corresponding to changes in MFN tariffs by year. Since there are many products with no change in MFN tariff, when we include them in the graphs the scale does not allow to see in detail what is happening with the products that did have MFN tariff changes, and thus we exclude the products with no change in MFN tariffs. The figure shows that the density for products with preferential tariff reductions higher than the median preferential tariff reduction tends to lie to the right of the density for products with preferential tariff reductions lower than the median (indicating larger increases/smaller decreases in MFN tariffs for the former products), particularly in 2006 and 2007, and consistent with our previous results.Footnote 19
Kernel density of change in MFN tariffs for products with high and low preferential tariff reductionsNote: Excludes product with on change in MFN tariff.

Before turning to the econometric estimates, we finish this section with a note on the timing of preferential tariff reductions implemented under CAFTA. Some products had their tariffs eliminated immediately as the agreement entered into force, while others had tariff reductions scheduled to take place over a number of years. In principle, it could be that part of the observed changes in MFN tariffs in some products are due to additional preferential tariff reductions that are expected to take place after 2009 (the last year in our sample), which could affect the quantification of the stumbling/building block effects. On the other hand, it is also possible that it takes some time for the full changes in MFN tariffs to take place after preferential tariff decreases, which could lead to larger stumbling/building block effects later on. Although this should not affect our main findings for the sample period we examine, future research may want to examine and quantify the link between preferential and MFN tariff changes after enough time has elapsed for the full effects of preferential tariff reductions under CAFTA to have occurred.
5. Results
5.1 Baseline specifications
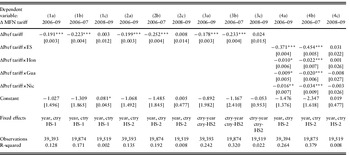
Column (1a) of Table 3 reports the estimates of a basic specification in which we regress by OLS the change in MFN tariffs on the change in preferential tariffs, including industry fixed effects – defined at the 1-digit HS level, as well as year and country fixed effects. The coefficient of interest (β from equation (1)) is negative and significant at the 1% level, indicating that MFN tariffs were increased (or reduced less) in products with larger reductions in preferential tariffs. In columns (1b) and (1c), we replicate the same specification for each of the two halves of the sample period, 2006–2007 and 2008–2009, respectively. For 2006–2007, we also find a negative coefficient which is larger in absolute value, while for 2008–2009 the coefficient is positive but not statistically significant. This suggests the existence of a stumbling block relationship in the first half but not in the last half of the sample period. In the following columns, we examine the sensitivity of this result to including a richer set of fixed effects. The specifications in columns (2a), (2b), and (2c) correspond to the same periods as those from columns (1a)–(1c) but use 2-digit HS level fixed effects (instead of 1-digit). In columns (3a)–(3c), we add country–year and country–industry fixed effects, where an industry is defined at the 2-digit HS level. The results are robust to including broader sets of fixed effects.
Estimates of the effect of preferential tariff changes on MFN tariff changes

Notes: Standard errors in brackets.
* significant at 10%;
** significant at 5%;
*** significant at 1%.
We can also ask whether the relationship between preferential and MFN tariff changes is present in each CAFTA country. In the specification reported in column (4a) of Table 3, we interact the change in preferential tariffs with country dummies. All the coefficients are negative and significant, which indicates that the results are not driven by a single country, although the effect is larger in magnitude for El Salvador. Columns (4b) and (4c) show that the results are similar for the sub-period 2006–2007, while for 2008–2009 the coefficients are not significant (consistent with our previous results).
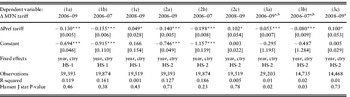
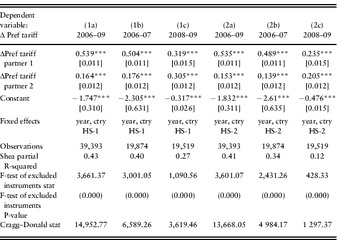
To address the potential endogeneity, we instrument for a country's preferential tariff changes using the preferential tariff changes of their partners. The partners are defined as the other CAFTA countries in our sample.Footnote 20 Columns (1a)–(1c) and (2a)–(2c) in Table 4 thus replicate the specifications from columns (1a)–(1c) and (2a)–(2c) from Table 3 but using an IV-GMM procedure instead of OLS. The partial R-squares from the first-stage regressions are 0.43 and 0.41 for columns (1a) and (2a), respectively, and the F-test rejects the hypothesis that the excluded instruments are equal to zero at the 1% level in all cases. (The first-stage regressions and relevant statistics are reported in Table A1). In addition, the Hansen overidentification test (reported at the bottom of Table 4) indicates that the instruments are valid, and the Cragg–Donald statistic (Table A1) indicates that our instruments are not weak.
IV estimates of the effect of preferential tariff changes on MFN tariff changes

Notes: Standard errors in brackets.
* significant at 10%;
** significant at 5%;
*** significant at 1%.
a Excludes textiles and apparel.
b This regression uses 2SLS and the p-value at the bottom of this column corresponds to the Sargan statistic.
The results using instrumental variables for the whole sample period (columns (1a) and (2a)) are qualitatively similar: there is evidence of a stumbling block effect of preferential liberalization.Footnote 21 This stumbling block effect is also present in 2006–2007. However, for 2008–2009 we now find evidence of a building block effect: the coefficient is positive and is now statistically significant at the 10% level. Using the coefficients from columns (2b) and (2c), we have that a reduction of 1 percentage point in the preferential tariff under CAFTA leads to an increase of 0.2 percentage points in the MFN tariff of the good in 2006–2007, and a decrease of 0.1 percentage points in the MFN tariff in 2008–2009 (for the whole sample, it leads to an increase of 0.14 percentage points). Also, a one standard deviation increase in the preferential tariff reduction leads to an increase of 1.2 percentage points in the MFN tariff in 2006–2007, which is sizeable considering that the median MFN tariff in the sample (both in 2006–2007 and in 2008–2009) is 10 percentage points. In 2008–2009, a one standard deviation increase in the preferential tariff reduction leads to a decrease of 0.1 percentage points in the MFN tariff, or 1% of the median, which is smaller but non-negligible. Therefore, the results are also economically significant.
5.2 Additional results and sensitivity analysis
Given the end of the Multi Fiber Agreement and the Agreement on Textiles and Clothing in 2005, there might be changes in MFN tariffs as a consequence of that rather than as a result of CAFTA. We thus examine the robustness of the results to excluding textiles and apparel products from the sample. The results in columns (3a)–(3c) of Table 4 show evidence of a stumbling block effect of preferential liberalization for the whole sample period as well as for 2006–2007, and of a building block effect for 2008–2009, consistent with our previous findings.Footnote 22
As mentioned in Section 3, we now proceed to test whether the effect of the FTA on MFN tariffs is also affected by the share of preferential imports. Therefore, we include in xijt in equation (1) the country's share of preferential imports in the product, interacted with an indicator for whether there is a sizeable preferential margin – defined as the difference between the MFN and preferential tariff – in that good (denoted Import share × Pref margin indicator). Since there is a cost of complying with the rules of origin, a sufficiently small preference margin may not be enough to provide net gains from preferential access. We define the indicator variable as being equal to one if the preferential margin exceeds 2.5 percentage points. This cutoff is chosen since usually preferential margins below 2 or 3 percentage points are considered to be too small to have an effect (cf. Estevadeordal et al., Reference Estevadeordal, Freund and Ornelas2008). Given that the share of preferential imports may be endogenous to changes in MFN tariffs, we use import shares from CAFTA countries in 2005; that is, the year before the agreement entered into force.
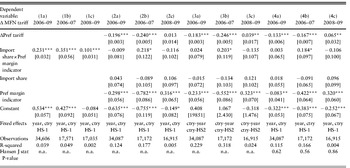
We first report the results of regressing the MFN tariff changes on ‘Import share’ interacted with ‘Pref margin indicator’ as well as 1-digit HS, year and country fixed effects in column (1a) of Table 5. The coefficient is positive and statistically significant at the 1% level, which indicates that products with higher preferential import shares had their MFN tariffs increased more/reduced less when there is a sizeable preferential margin, further supporting the stumbling block finding. This also holds for 2006–2007 (column (1b)) and for 2008–2009 (column (1c)), which would support our previous stumbling block finding for 2006–2007, but not the building block finding for 2008–2009.Footnote 23
Estimates of the effect of preferential tariff changes and import shares on MFN tariff changes

Notes: Standard errors in brackets.
* significant at 10%;
** significant at 5%;
*** significant at 1%.
In columns (2a)–(2c), we add to the specifications from columns (1a)–(1c) the change in the preferential tariff as well as the preferential import share alone and the preferential margin indicator alone. The previous results regarding the change in the preferential tariff (from Table 3) still hold. Moreover, although the import share interacted with the preferential margin indicator is not significant for the whole sample period, it is positive and significant for 2006–2007 (column (2b)), the sub-period for which we have previously found a stumbling block effect. Moreover, the import share variable alone is not statistically significant, indicating that preferential import shares affect MFN tariffs only when there is a sizeable preference margin. This provides additional support for a causal relationship between preferential and MFN tariffs in 2006–2007. A statistically significant coefficient on this variable, on the other hand, could have been associated with some omitted variable. Finally, the coefficient of the preferential margin indicator is negative and significant. This is probably due to the fact that this variable is negatively correlated with the change in preferential tariff (if we exclude the change in the preferential tariff, the preferential margin indicator's coefficient becomes positive). We thus report other results where we use the change in the preference margin instead of the change in the preferential tariff below.
We also examined the robustness of the results to using an alternative threshold level to define the preferential margin indicator. We define the indicator to be equal to one if the preferential margin is at least 4 percentage points and re-estimate the specifications from columns (1a)–(1c) and (2a)–(2c) using this alternative cutoff level. This threshold is based on estimates by Francois et al. (Reference Francois, Hoekman and Manchin2006), who find that the preferential margin must be at least 4 percentage points for African, Caribbean, and Pacific exporters to the European Union to ask for preferences. The results were qualitatively similar to those that use the original threshold.
In columns (3a)–(3c), we include country–year and country–industry (defined at the 2-digit HS level) fixed effects and the results are similar except that the coefficient of the change in preferential tariff for 2008–2009 is now significant. In columns (4a)–(4c), we re-estimate the specifications from columns (2a)–(2c) but via IV-GMM, using the preferential tariffs of a country's partners as instruments. The results are qualitatively similar to those of columns (2a)–(2c), with the difference that the coefficient of the change in preferential tariff for 2008–2009 again becomes significant. This is consistent with our previous finding in the IV regressions from Table 4 that, once we use instrumental variables, there seems to be some evidence of a building block effect in 2008–2009.Footnote 24
We next examine the role that WTO tariff bindings may play on determining MFN tariff changes and potentially on the relationship between preferential and external trade liberalization. As shown in Table 1, the average level of the WTO tariff bindings for the CAFTA countries included in this study is 38.2%, while the average applied MFN tariff in 2005 was 5.7%. This suggests that the countries had indeed significant room to increase their MFN tariffs. In addition, on average more than 99% of the products in the sample had applied tariffs below their bound levels, indicating that in the large majority of cases there was at least some room for MFN tariff increases. Despite this, we examine the sensitivity of the results to including an indicator variable that is equal to one if the difference between the WTO tariff binding level and the lagged MFN applied tariff rate (also known as ‘tariff overhang’) is less than 3 percentage points. We thus use an indicator for the lagged tariff overhang in order to avoid endogeneity. This threshold is similar to the one used by Estevadeordal et al. (Reference Estevadeordal, Freund and Ornelas2008), but we also report results with different cutoff levels in the Appendix (available online).
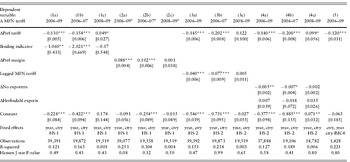
The results appear in columns (1a)–(1c) of Table 6. All specifications in Table 6 use an IV-GMM estimation procedure. The results from column (1a) show that countries with a small tariff overhang had smaller increases in their MFN tariffs, as one would expect. Again, larger reductions in preferential tariffs are associated with increases in MFN tariffs. The same results hold for 2006–2007 (column (1b)), whereas for 2008–2009 we again find a positive coefficient for the change in preferential tariff and the tariff overhang indicator is not significant. The results using 2-digit instead of 1-digit HS fixed effects, as well as including also the interaction between the binding indicator and the change in preferential tariff are shown in the Appendix and are similar.
Estimates of the effect of preferential tariff changes on MFN tariff changes, additional robustness tests

Notes: Standard errors in brackets.
* significant at 10%;
** significant at 5%;
*** significant at 1%.
a This regression uses 2SLS and the p-value at the bottom of this column corresponds to the Sargan statistic.
In the Appendix, we also show that the results are robust to excluding from the sample the products with a small tariff overhang (that is, those for which the binding indicator equals one), and also to adding the import share variables.
We then examine the sensitivity of the results to using the preference margin instead of the preferential tariff to determine the effect of preferential liberalization on liberalization toward non-members. The preference margin is again defined as the difference between the MFN and preferential tariffs. As mentioned by Estevadeordal et al. (Reference Estevadeordal, Freund and Ornelas2008), using preference margins instead of preferential tariffs provides further evidence of causality in the relationship with MNF tariffs, since unobserved variables could affect both preferential and MFN tariffs in a similar way but in principle they would not be expected to affect also the margin of preference.
Columns (2a)–(2c) of Table 6 include the change in the preference margin as the independent variable. Since the change in preferential margins may be endogenous to the change in MFN tariffs, we use an IV estimation procedure in which we instrument for the change in the preference margin of a country using the change in the preference margins of its partners (in an analogous way as we did for the change in preferential tariffs, described in Section 5.1). We find that the coefficient is positive, meaning that increases in preference margins are associated with increases in MFN tariffs. This is consistent with our previous finding of a stumbling block effect of preferential liberalization on external liberalization in 2006–2007, but not with the evidence of a building block effect in 2008–2009 that we had found in some previous specifications.Footnote 25
The results are similar if we use the preference margin indicator instead of the level (that is, a dummy variable equal to one if the preference margin is larger than 2.5 percentage points). We also tried using an indicator equal to one if the preference margin was above the 50th percentile in the country, and the results were robust to this as well.
Since there may be persistence in applied tariffs, we study the sensitivity of the results to adding the lagged MFN tariff as a regressor in our baseline specification. We instrument for it using three period lags in the MFN tariff.Footnote 26 The change in preferential tariff is also instrumented for as explained previously. The results are shown in column (3a) of Table 6. The lagged MFN tariff's coefficient is negative and significant, indicating that initially higher MFN tariffs are increased less. More importantly, the change in the preferential tariff also has a negative and significant coefficient, providing again evidence of a stumbling block effect. Similar to some of our previous findings, while these results also hold for 2006–2007 (column (3b)), for 2008–2009 the change in preferential tariff has a positive coefficient, but the coefficients (for both variables) are not significant (column (3c)).Footnote 27
We next test the robustness of the results to adding other variables that could affect changes in MFN tariffs. Ludema and Mayda (Reference Ludema and Mayda2009) show and provide evidence for the US that applied MFN tariffs are affected by the degree of concentration of the source of exports. The reason is that when concentration is higher there is less free riding by exporters when it comes to negotiating tariff reductions, thus leading to lower tariffs. This could also apply to the incentive to retaliate against a tariff increase (that is, when there is more concentration, it may be more likely that the country will face retaliation if it increases its tariffs). In addition, for a given degree of concentration, a larger number of exporting countries would create more pressure for the country to keep its tariffs low. Therefore, we also include as regressors the change in the number of exporters and the change in a Herfindahl index of export value in the product. We also relate the latter to Bagwell and Staiger's (Reference Bagwell and Staiger1999) tariff discrimination effect in the next section. To avoid endogeneity, we use changes in these variables from 2004 to 2005; that is, before our sample period.
The results including these two variables in addition to the change in preferential tariffs are reported in column (4a) of Table 6. The coefficient of the change in the number of exporters is negative, as expected, and statistically significant. The same is true for 2006–2007 (column (4b)), while for 2008–2009 the coefficient is still negative but not significant (column (4c)). The coefficient of the change in the Herfindahl index is not significant. Nonetheless, the change in the preferential tariff again has a negative and significant coefficient for the whole sample as well as for 2006–2007, and a positive and significant coefficient for the 2008–2009 period.Footnote 28 We find similar results if we replace the change in the Herfindahl index with a dummy variable equal to one if the Herfindhal index increased or stayed the same, and also if we add to that the import share variables (from Table 5).
Although not shown to save space, we performed additional sensitivity analysis to clustering the standard errors at the country–industry level, where an industry is defined at the 2-digit HS level. We include country–year and country–HS2 fixed effects and re-estimate our baseline specification (from Tables 3 and 4). The results are similar. Given that the results in this study contrast with those of Estevadeordal et al. (Reference Estevadeordal, Freund and Ornelas2008), we examine whether our results are robust to using data at the 4-digit ISIC industry level, since that is the level of aggregation used by those authors (we also note that their analysis applies to a different time period and countries, as mentioned before). We aggregate our data using simple averages for comparability with Estevadeordal et al. (Reference Estevadeordal, Freund and Ornelas2008), and re-estimate our baseline specification from Table 3 using data at the 4-digit ISIC level and via IV-GMM. The results are robust to using industry-level data, as shown in column (5) of Table 6.Footnote 29
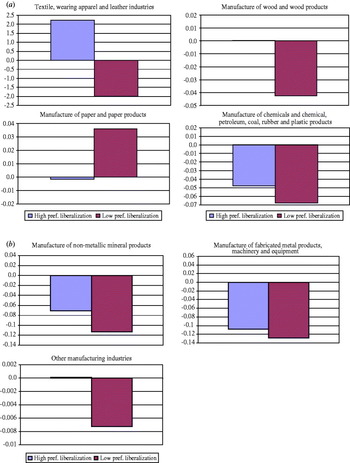
Since we found a very robust negative relationship between preferential and MFN tariff changes for the 2006–2007 period, we next examine in which sectors is that relationship present. Focusing on the years 2006 and 2007, we estimate the change in MFN tariffs on the change in the preferential tariff interacted with 2-digit ISIC sector dummies, in addition to country and sector fixed effects.Footnote 30 The coefficient is negative and statistically significant in most of the manufacturing sectors (ISIC 32, 33, 34, 35, 36, 38, 39); that is, all ISICs in manufacturing except ‘manufacture of food, beverages and tobacco’ (ISIC 31) and ‘basic metal industries’ (ISIC 37). Figures 3a and 3b show the average MFN changes for products with preferential tariff reductions higher (in absolute value) and lower than the median for each of the seven ISIC sectors in which we find a negative and significant coefficient. In all cases, except for ‘manufacture of paper and paper products’ (ISIC 34), the graphs also show a stumbling block effect in 2006–2007 based on average MFN changes.Footnote 31
Average change in MFN tariffs by 2-digit ISIC industry for products with high and low preferential tariff reductions

We also investigate whether changes in MFN tariffs and their relationship with changes in preferential tariffs may be affected by comparative advantage in an industry or country. For example, industries in which a country has a comparative advantage might experience smaller increases in MFN tariffs. The results are presented in the Appendix, and they indicate that MFN tariffs increased less in industries in which a country has a revealed comparative advantage, either relative to the world or to its CAFTA partners. Moreover, our previous results regarding the effects of preferential tariff changes still hold.
To better account for unobserved heterogeneity, we re-estimate our main specifications including country–year and country–product (that is, country–HS6) fixed effects, and also using robust standard errors. The results are shown in the Appendix.
6. What leads to the initial stumbling block effect
We now discuss what forces may be behind the stumbling block effect of preferential liberalization that we find for 2006–2007 by considering arguments put forward by the theoretical literature. We certainly are not directly testing any model, as our estimations are not structural, but we want to explore whether our results can shed some light as to what may lead to the stumbling block effect in the case of CAFTA.
Consider first the argument made by Panagariya and Findlay (Reference Panagariya, Findlay, Feenstra, Grossman and Irwin1996). In their model, a free trade area leads to less lobbying in the good imported from the other member and that sector shrinks due to lower protection, thus making lobbying in the sector that competes with the rest of the world more attractive. Under this argument, we should not find, as we do, that MFN tariffs increase more in products in which preferential liberalization was larger or where the preferential import share is larger, since those would be the sectors that contract and where lobbying decreases, unless we think of a 6-digit HS product imported from CAFTA and the same 6-digit HS product imported from non-members as two different sectors (there are no available data on lobbying – or output – at this level of disaggregation to examine this directly). A similar reasoning would apply to Cadot et al.'s (Reference Cadot, de Melo and Olarreaga1999) argument, mentioned in Section 2. However, that finding seems consistent with Tovar (Reference Tovar2010), since in her model sectors that contract due to imports from the partner can have their MFN tariffs increased due to loss aversion (or diminishing marginal political support).
Let us turn to the punishment effect defined by Bagwell and Staiger (Reference Bagwell and Staiger1999). According to this, the free trade agreement weakens the members’ ability to punish non-member counties’ deviations from a multilateral agreement, thus reducing the ability to sustain low tariffs between members and non-members. We would expect this effect to be more important in products with larger imports from other member countries. Therefore, the fact that we find the preferential import share to affect changes in MFN tariffs would be consistent with it. For products with a higher preferential import share, preferential liberalization has led to larger increases in MFN tariffs.
Now consider the second effect that could lead to higher external tariffs according to Bagwell and Staiger (Reference Bagwell and Staiger1999): the tariff discrimination effect. This allows member countries to discriminate against countries which free ride under MFN, and hence leads to higher external tariffs. If this effect was at work, since a lower degree of concentration in the source of exports should lead to more free riding, it would provide a motive for member countries to increase their MFN tariffs. However, we did not find the change in the Herfindahl index to affect changes in MFN tariffs. We also experimented with the level of the index and it is not significant either. Thus, we do not find evidence of such effect. This may be due to the fact that the countries in our sample are small and thus may have little monopoly power in most sectors, which may lead us to find no free riding effect on average.Footnote 32 Following Ludema and Mayda (Reference Ludema and Mayda2007), we also tried interacting the Herfindahl index (either its change or level) with the country's share of world imports in each good (as a proxy for market power), but it was still not significant. It is possible that if we interacted the Herfindahl index with the inverse elasticity of foreign export supply (the true measure of market power), we could find a significant effect. However, those elasticities are not available for the countries in our sample and thus we leave that possibility for future work.
Finally, the results seem consistent with Bagwell and Staiger's (1997) finding that external tariffs will initially increase following a free trade agreement, but then they will fall as a return to multilateral cooperation takes place. As mentioned before, the reason behind the initial tariff increase is that countries expect a decrease in trade between members and non-members, which lowers the gains from cooperation.
7. Conclusions and policy implications
This paper studies the relationship between preferential trade liberalization and tariffs imposed against non-member countries for the case of CAFTA-DR. Using data at the 6-digit HS level, we find that products with larger preferential tariff decreases were associated with larger increases in applied MFN tariffs. Moreover, we uncover some interesting dynamics regarding the effect of preferential liberalization on external tariffs. We split the sample into two sub-periods and we find that, in the first sub-period (2006–2007), such negative relationship between changes in preferential tariffs and changes in MFN tariffs is present. These results thus provide evidence of an initial stumbling block effect of preferential trade liberalization, and they are not only statistically but also economically significant. We also find that products with higher preferential import shares experienced larger increases in MFN tariffs and only when there is a sizeable margin of preference, which further supports the stumbling block relationship. Furthermore, the results are robust to controlling for the ‘tariff overhang’; that is, how much room countries had to increase their MFN tariffs given their WTO tariff binding levels. They are also robust to using the change in the preference margin instead of the change in the preferential tariff as the main independent variable, and to controlling for other variables such as the degree of concentration in the source of exports and the extent of comparative advantage in an industry.
In contrast, when we examine the second sub-period (2008–2009), we find some evidence of a positive relationship between changes in preferential and MFN tariffs. However, not all the previously described robustness tests support this last finding, and thus we conclude that there is weaker evidence of a building block effect of preferential liberalization on tariffs imposed against non-member countries in the later period.
Our stumbling block result contrasts with the results of Estevadeordal et al. (Reference Estevadeordal, Freund and Ornelas2008), who find that preferential trade liberalization was a building block to unilateral trade liberalization in a group of Latin American countries in the 1990s (albeit using a more aggregated level of data than us). In addition, whereas Limão (Reference Limão2006, Reference Limão2007) and Karacaovali and Limão (Reference Karacaovali and Limão2007) provide evidence of preferential liberalization as a stumbling block to multilateral trade liberalization in the case of the United States and the European Union, our results of a stumbling block effect apply to unilateral trade liberalization. Moreover, we focus on a group of small developing countries while they examine the case of large developed countries. Given the importance of the effect of preferential tariff reductions on MFN tariffs imposed against non-members for overall trade liberalization and welfare considerations, the different findings provided by different studies suggest that more evidence is needed and that the results may differ on a case-by-case basis. Furthermore, our results also suggest that the effects may change over time.
The results that we find of a product-level link between preferential liberalization under CAFTA and increases (or smaller reductions) in MFN tariffs imposed against non-member countries, followed by decreases in such MFN tariffs, have implications for policy decisions regarding applied tariffs. First, reducing external tariffs could help member countries decrease the extent of trade diversion taking place as a result of the agreement and help achieve an overall movement toward free trade. Second, it is important to remember that article XXIV of the GATT requires that trade barriers against non-members should not be higher than before the free trade agreement. Third, and in relation to the previous points, increases in external tariffs may negatively affect non-member countries, which could lead to retaliation and thus hurt CAFTA members. Fourth, the results are also relevant for the future because preferential tariff reductions under CAFTA are scheduled to continue for a number of years in some products. Future decreases in preferential tariffs could generate additional changes in external tariffs, besides those found in this paper. This is particularly important given that the countries examined in this study have applied tariffs that are significantly lower than their WTO binding levels in the large majority of products, and thus there is considerable room for tariff increases. Our findings also suggest that reducing the levels of tariff bindings in the WTO could help lower increases in external tariffs resulting from preferential liberalization in the future.
Finally, although research on the effect of preferential trade agreements on trade liberalization against non-member countries has focused on tariffs, preferential liberalization could also affect the use of non-tariff barriers against non-members. We do not consider non-tariff barriers in this paper either as such data are generally not available after CAFTA. There are data available on the use of antidumping, safeguards, and countervailing duties; however, the countries analyzed in this study had no antidumping initiations or measures imposed, no safeguard measures, and no countervailing initiations or measures since at least the end of the 1990s.Footnote 33 Nonetheless, it would be important to take into account the potential use of non-tariff barriers in future research as well as for policy decisions by CAFTA members, since they could act as substitutes for tariffs. Regarding the latter, for example, member countries wishing to reduce trade diversion resulting from CAFTA may want to consider not only lowering tariffs but also non-tariff barriers against non-members. Similarly, increases in non-tariff barriers could also spur retaliation by outside countries.
Supplementary material
A supplementary appendix for this paper is available at: http://dx.doi.org/10.1017/S1474745612000250
Appendix
First-stage estimates