Introduction
Ceramics are typically resistant to heat, wear, and corrosion, and thus have been widely used in a range of applications that include kitchen wares, dental implants, lasing materials, missile domes, and the protective tiles of space shuttles. However, ceramics are brittle. Ductility, a valued characteristic of many metals, is rarely seen in ceramics at room temperature. Ceramics break easily and therefore are limited in their use for high-stress applications. If their brittleness can be overcome, their applications could be much expanded. To achieve ductility in ceramics, making ceramics with nanocrystals has attracted a lot of interest in the last several decades [Reference Clegg1, Reference Karch, Birringer and Gleiter2, Reference Dominguez-Rodriguez, Gómez-García, Zapata-Solvas, Shen and Chaim3, Reference Jang and Greer4]. Since the late 1980s, many researchers have proposed that brittle ceramics, which lack sufficient dislocation activity, may exhibit improved ductility in the nanometer range because of greatly increased diffusivities [Reference Karch, Birringer and Gleiter2, Reference Siegel and Cahn5, Reference Gleiter6].
The deformation of nanocrystalline materials remains controversial [Reference Kumar, Suresh, Chisholm, Horton and Wang7, Reference Shan, Wiezorek, Stach, Follstaedt, Knapp and Mao8, Reference Wang, Han, Liu, Yue, Zhang and Ma9, Reference Chen, Ma, Hemker, Sheng, Wang and Cheng10, Reference Lu, Chen, Huang and Lu11, Reference Li, Wei, Lu, Lu and Gao12, Reference Yamakov, Wolf, Phillpot, Mukherjee and Gleiter13, Reference Murayama, Howe, Hidaka and Takaki14, Reference Schiøtz and Jacobsen15, Reference Penn and Banfield16, Reference Weissmüller and Markmann17]. It is generally believed that due to the lack of defects, the deformation of nanocrystals is viewed to occur by homogeneous deformation mechanisms, and their phase transitions as involving a single nucleation site [Reference Tolbert, Herhold, Brus and Alivisatos18, Reference Tolbert and Alivisatos19]. Postdeformation analysis of compressed or indented nanocrystalline nickel does not indicate major dislocation debris [Reference Kumar, Suresh, Chisholm, Horton and Wang7], whereas dislocations are observed in 10-nm nickel and 9-nm platinum particles [Reference Shan, Wiezorek, Stach, Follstaedt, Knapp and Mao8, Reference Wang, Han, Liu, Yue, Zhang and Ma9]. Deformation twinning and disclination have also been reported in several studies on nanocrystals [Reference Chen, Ma, Hemker, Sheng, Wang and Cheng10, Reference Lu, Chen, Huang and Lu11, Reference Li, Wei, Lu, Lu and Gao12, Reference Yamakov, Wolf, Phillpot, Mukherjee and Gleiter13, Reference Murayama, Howe, Hidaka and Takaki14]. Based on the classical concept of Cottrell that below a critical grain size, the stress required to nucleate cracks is less than the stress needed to propagate them, ductility can be expected in nanoceramics [Reference Cottrell20]. It is believed that dislocation activity is suppressed in nanoceramics [Reference Dominguez-Rodriguez, Gómez-García, Zapata-Solvas, Shen and Chaim3], and many have hypothesized that enhanced diffusivities would result in ductility in nanoceramics [Reference Karch, Birringer and Gleiter2, Reference Siegel and Cahn5, Reference Gleiter6]. However, because of technical limitations, in situ observations of plastic deformation in fine nanoceramics are difficult, precluding the direct exploration of deformation mechanics at nanometer scales. Primary mechanisms for the ductility of nanoceramics, and how different elastic and plastic deformation behaviors are compared with bulk (i.e., micrometer-sized grains) ceramics, remain elusive. The goal of this study is to examine the deformation of nanoceramics and to determine how the stiffness of ceramics change with particle size reduction and whether a dislocation mechanism can, in fact, be dismissed in favor of diffusion as the dominant plasticity-controlling mechanism. Currently, no methods exist for directly mapping strain fields within nanomaterials at high pressure [Reference Yip21]. Here, we assess the strain fields and defect activities of nanocrystals through a combination of axial and radial diamond-anvil cell (DAC) X-ray diffraction (XRD) experiments of spinel nanocrystals.
Results and discussion
Axial DAC XRD
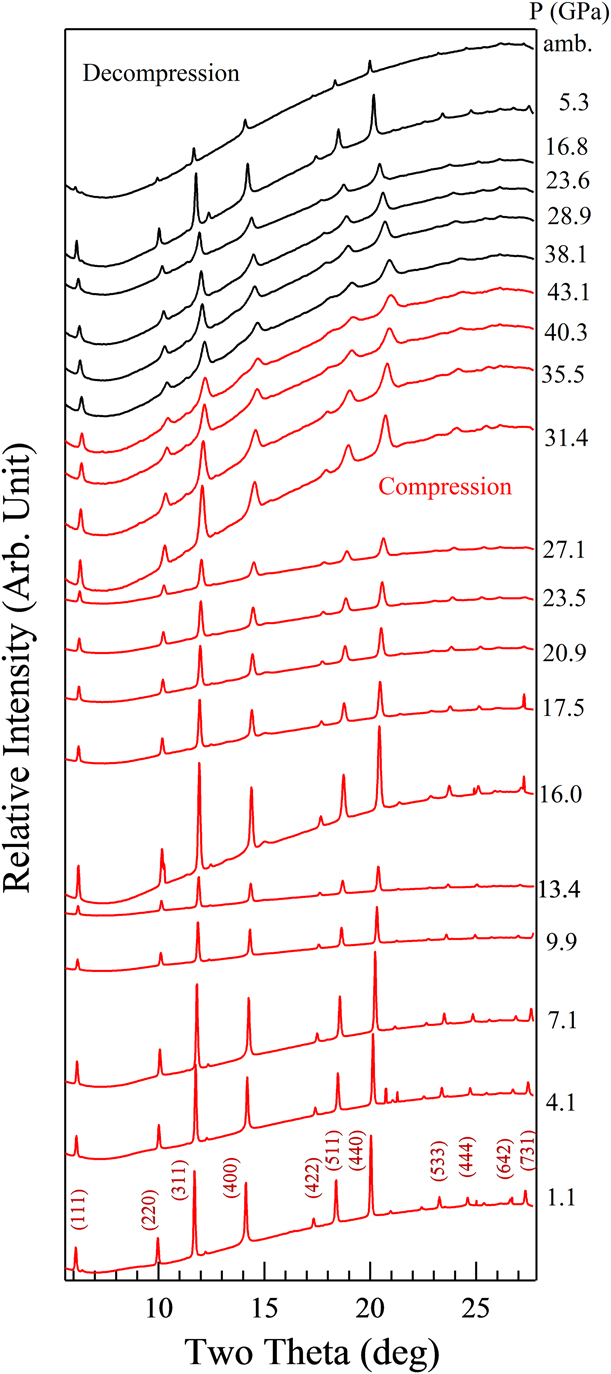
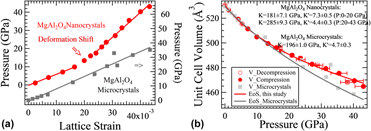
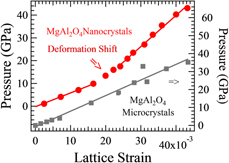
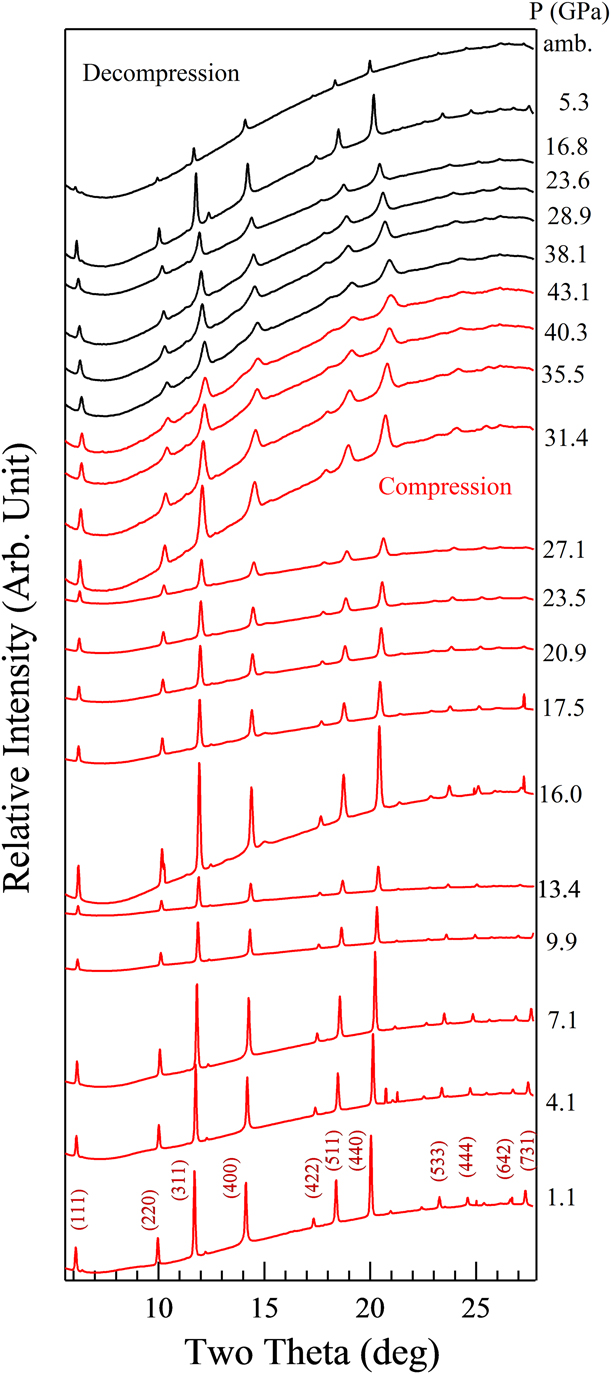
Spinel represents one of the most important structure groups in ceramics. Its rheological properties have a wide range of implications to multiple fields, from materials science to Earth science [Reference Dal Maschio, Fabbri and Fiori22, Reference Burnley and Green23, Reference Merkel, McNamara, Kubo, Speziale, Miyagi, Meng, Duffy and Wenk24]. We choose the archetypal end-member magnesium aluminate (MgAl2O4) spinel mainly because its normal, ordered spinel structure ([Mg]8IV [Al]16VI O32) is stable over a wide pressure range and the lack of pre–phase-transition disordering allows us to focus on pressure-induced microdeformation mechanisms. 25-nm MgAl2O4 was compressed to ∼43 GPa in a DAC at room temperature (Fig. 1). At ambient conditions, the lattice parameter a was measured to be 8.096 ± 0.003 Å, in excellent agreement with previous results [Reference Kruger, Nguyen, Caldwell and Jeanloz25, Reference Levy, Pavese and Hanfland26]. The lattice strain initially changes approximately linearly with pressure between 0 and ∼20 GPa [Fig. 2(a)]. At higher pressures, the slope of the pressure versus lattice strain trend increases, implying that a change in the deformation mechanism has occurred. In contrast, for bulk MgAl2O4 crystals, the stress–strain relationship is nearly linear over the pressure range to 40 GPa [Reference Kruger, Nguyen, Caldwell and Jeanloz25], implying that the deformation mechanism does not change in the pressure range of the study.
Axial DAC XRD patterns of MgAl2O4 nanocrystals at various pressures.
(a) The lattice deformation behavior of MgAl2O4 nanocrystals. Lattice strain is the fractional change of the lattice parameter. (b) Equation of state of MgAl2O4. The closed/open circles represent data taken in this study from nanocrystalline samples on compression/decompression. Square symbols are data on bulk material [Reference Kruger, Nguyen, Caldwell and Jeanloz25].
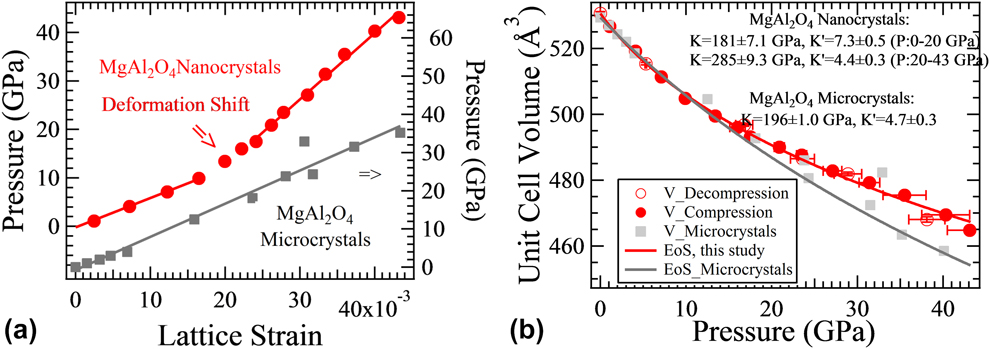
The bulk modulus (the inverse of compressibility), a measure of how the volume of a material changes during elastic deformation, can be determined from the changes in the lattice parameters with pressure. The unit cell volume as a function of pressure was fitted with the Birch–Murnaghan equation of state [Fig. 2(b)].
We determined the lattice parameter of MgAl2O4 at each pressure with MAUD, a Rietveld refinement program [Reference Lutterotti, Matthies, Wenk, Schultz and Richardson27], and analyzed the data in terms of the Birch–Murnaghan equation of state [Reference Birch28],
 $$P = 1.5K\left[ {{{\left( {{{{V_0}} \over V}} \right)}^{{7 \over 3}}} - {{\left( {{{{V_0}} \over V}} \right)}^{{5 \over 3}}}} \right]\left\{ {1 - {3 \over {4\left( {4 - K'} \right)\left[ {{{\left( {{{{V_0}} \over V}} \right)}^{{2 \over 3}}} - 1} \right]}}} \right\}\quad ,$$
where V/V0 is the ratio of unit cell volume at pressure P and ambient pressure. K is the zero-pressure bulk modulus, and K′ is the pressure derivative of the bulk modulus.
We obtained the zero-pressure bulk modulus (K) and its pressure derivative (K′) to be 148 ± 6.3 GPa and 15.8 ± 1.0, respectively. Rather than indication of the second-order phase transition, the extremely large value of K′ is possibly related with a pressure-induced shift in compressional mechanism, which is identified as occurring near 20 GPa based on the deviation between the nanocrystal data and the bulk data (Fig. 2). Therefore, we separate the dataset into two discrete pressure regimes: low-pressure and high-pressure, and apply a Birch–Murnaghan equation of state to each regime. From the equation-of-state fits to the low- and high-pressure regions of our data, we obtained a K of 181 ± 7.1 GPa and K′ of 7.3 ± 0.5 for the pressure range 0–20 GPa, and 285 ± 9.3 GPa and 4.4 ± 0.3 for 20–43 GPa. Compared with previous results for bulk MgAl2O4 (K of 196 ± 1.0 GPa and K′ of 4.7 ± 0.3) (Reference Kruger, Nguyen, Caldwell and JeanlozRefs. 25 and Reference Levy, Pavese and Hanfland26), the nanoceramic sample has a close compressibility to that of its bulk counterpart at low pressures, but becomes markedly less compressible at higher pressures.
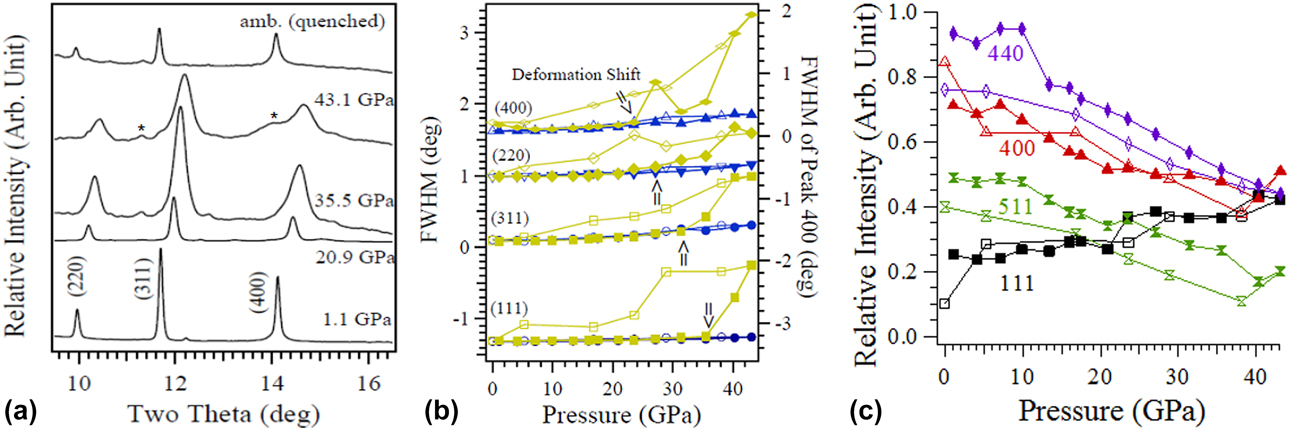
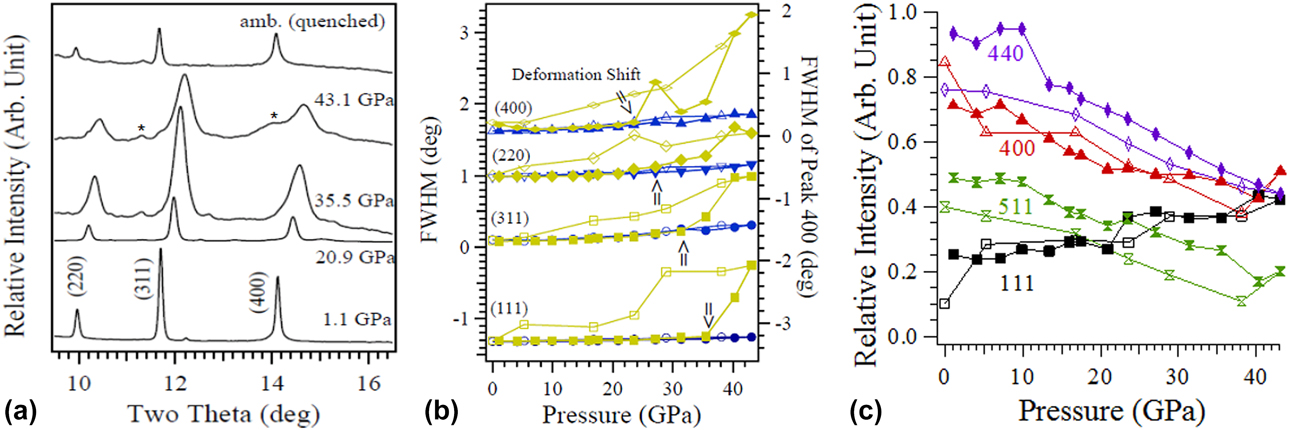
Some well-known models for nanomechanics, such as strain gradient plasticity [Reference Nix and Gao29] and dislocation source starvation [Reference Budiman, Han, Greer, Tamura, Patel and Nix30], seem not applicable to this case, because no strain gradients can be well examined, and we actually tend to suspect that dislocations are more favored in nanoceramics than bulk counterparts. The observed lattice stiffening indicates a deformation mechanism transition, which suggests that crystal defects could be induced by stress in the nanoceramic sample. To evaluate the hypothesis that a defect-mediated mechanism generates discontinuity in the pressure dependence of strain [Fig. 2(a)], the linewidths of several representative diffraction peaks were analyzed (Fig. 3). Peak broadening is generated by several factors, including instrumental broadening, grain size effects, and stress (microstrain)-induced broadening [Reference Groma and Borbely31]. A standard material, LaB6, was used to characterize the instrumental broadening. The peak broadening of unstressed samples was used to confirm the particle size that was measured with electron microscopy. Thus, the observed peak broadening can be ascribed to local stresses produced by inhomogeneous strain. Based on previous studies [Reference Groma and Borbely31], we infer that dislocation effects are reflected in the peak profiles.
(a) Representative XRD patterns of nanocrystalline spinel under compression, showing the shifting and broadening of peaks under pressure. Peaks labeled with asterisks are from the gasket. Peak profile fits: (b) The full width at half maximum (FWHM in terms of two theta) of the Gaussian and Lorentzian components of the diffraction peaks. (c) The relative intensities of several representative diffraction lines with respect to the strongest (311) diffraction peak. For clarity, the FWHM of the (220) peak is offset by 0.9, whereas that of the (111) peak is offset by −1.4. Blue and yellow symbols represent the Gaussian and Lorentzian components, respectively. Closed symbols correspond to data taken on compression, whereas open symbols correspond to data taken on decompression. The pressures at which a shift in deformation takes place are labeled with arrows. The pressure dependences of the Gaussian and Lorentzian components diverge at high pressures, indicating that the stress/strain inhomogeneity increases with pressure.
The peak profiles were fitted with a pseudo-Voigt function [Reference Wertheim, Butler, West and Buchanan32]. The pseudo-Voigt function is an approximation of the Voigt line shape by the sum of a Gaussian and a Lorentzian function. It can fit both symmetric and asymmetric peaks. To reflect the contribution from the inhomogeneously strained lattices of materials, the peak centers and widths of the Gaussian and Lorentzian components are allowed to vary independently within the fit. The fit function is written as
 $$\eqalign{f\left( x \right) = {y_0} + A\left\{ {\left( {1 - \eta } \right)\exp \left[ { - {{\left( {{{x - {x_{\rm{G}}}} \over {0.600561 \cdot {\rm{FWH}}{{\rm{M}}_{\rm{G}}}}}} \right)}^2}} \right] \cr+ {\eta \over {1 + {{\left[ {{{\left( {x - {x_{\rm{L}}}} \right)} / {\left( {0.5{\rm{FWH}}{{\rm{M}}_{\rm{L}}}} \right)}}} \right]}^2}}}} \right\},$$
where (xG, xL) and (FWHMG, FWHML) are the peak centers and widths of Gaussian and Lorentzian components, respectively. A, η, and y0 are fit coefficients.
The Gaussian centers and linewidths vary smoothly with pressure, and so the Gaussian component reasonably represents the homogeneous strain in the nanocrystals and the effect of pressure gradients across the nanocrystalline aggregate. Larger variations are seen in the Lorentzian components, as would be expected for pressure-induced inhomogeneous strain fields. The shift in the pressure dependence of the peak positions and widths indicates the onset of plastic deformation (Fig. 3). The combination of the peak broadening of the Lorentzian components and the decreased compressibility of the nanocrystals implies that defects within the nanocrystals have shifted the local strain fields. Hysteresis in the inhomogeneous strain fields on decompression also indicates that pressure-induced defects are incompletely removed during decompression (Fig. 3). Peak symmetry is recovered upon complete quenching, and this observation further shows that strain inhomogeneity causes the asymmetry of diffraction peaks at high pressure. Reversible peak broadening also indicates that no permanent change in crystallite size and shape resulted from compression; hence, pressure-induced coarsening/fracturing of particles appears not to take place in MgAl2O4 nanocrystals. However, the radial diamond-anvil cell (rDAC) XRD (Fig. 4) results presented in the next section capture the dislocation-mediated texturing in the nanocrystal samples, which may suggest that the shear stresses in these aDAC XRD (Fig. 5) experiments are not large enough because of the use of the pressure medium. In a recently reported study, the increase in defect intensity in the deformed indium pillar was probed with Laue diffraction peak broadening. This technique could be useful for further exploring the defect evolution of nanoceramics [Reference Ali, Tamura and Budiman34].
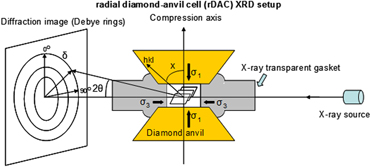
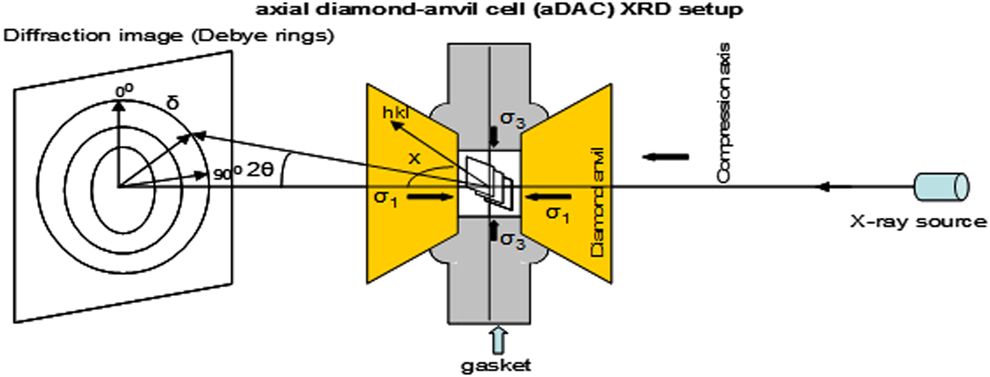
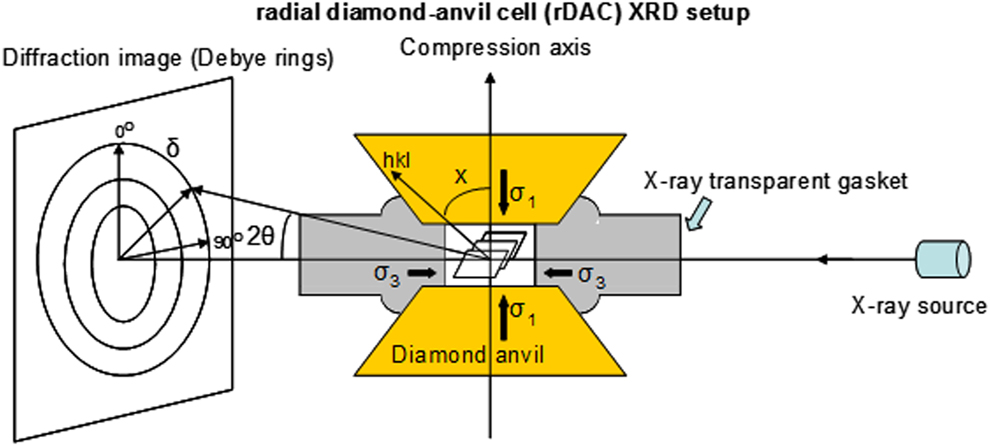
The rDAC XRD setup [Reference Chen, Lutker, Raju, Yan, Kanitpanyacharoen, Lei, Yang, Wenk, Mao and Williams33].
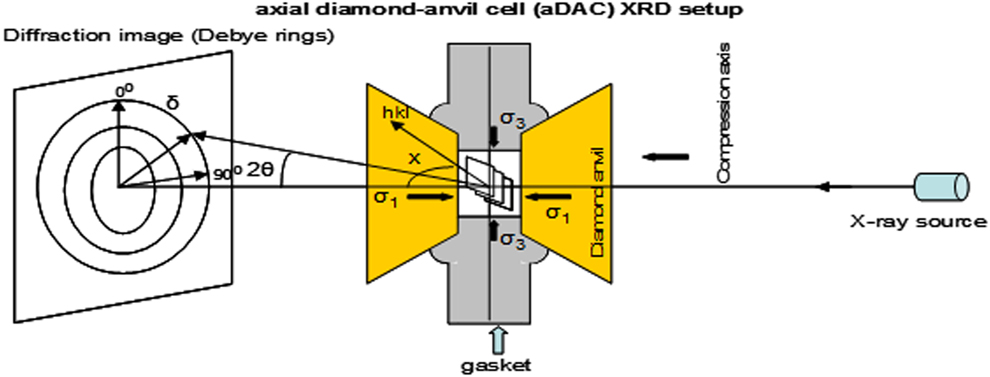
The axial DAC XRD setup.
The pressure-induced shifts and broadening of the Gaussian components of different peaks are quite similar, indicating that they reflect homogeneous and isotropic deformation (Fig. 3). In contrast, the Lorentzian components of the different diffraction peaks behave differently, indicating the presence of anisotropic inhomogeneous deformation.
The asymmetry of the different diffraction peaks increases with pressure (Fig. 3). Up to ∼20 GPa, the Gaussian and Lorentzian components have both the same centers and linewidths [Fig. 3(b)], showing that the peak profiles are symmetric and that the strain distribution in each of the nanocrystals is homogeneous. On further compression, substantial deviations are seen between the peak centers and the linewidths of the Gaussian and Lorentzian components of the (400) peak. Similar deviations are also seen at higher pressures for the (220), (311), and (111) peaks. Thus, strain inhomogeneity in these nanocrystals appears to increase greatly between 23 GPa and the highest pressure.
The onset of asymmetric peak broadening occurs for the (100) peak at >23.5 GPa, followed by (110) at >27.1 GPa, (311) at >31.4 GPa, and (111) at >35.0 GPa. The abruptly increased peak broadening above these pressures is not likely to be due to pressure gradients across the nanocrystal aggregates, nor is it readily attributed to a bulk crystallographic distortion (such as a transition to lower symmetry) because the onset of such a crystallographic distortion is usually coherent and is unlikely to span a >12 GPa pressure range. Instead, we infer that the variable onset of peak broadening is due to strain fields generated as defects with differing preferred orientations are activated at varying critical stresses. Crystals usually contain a mixture of edge and screw dislocations. Weak-beam dark-field microscopy reveals that in MgAl2O4 full-edge dislocations can dissociate into partial dislocations [Reference Mitchell35]. The dissociation spacing can be as small as 10 nm. Dislocations move through the lattice and create regions of compressive, tensile, and shear stresses. The enhanced broadening of the (111) peak is seen at much higher pressure than for the other peaks. Thus, the critical stresses associated with pressures of less than 35 GPa mainly generate dislocations with preferred slip within the {111} plane.
The relative intensity of diffraction lines also varies with pressure [Fig. 3(c)], as is anticipated from the generation of defects during compression causing a shift in structural order. The Burgers vectors and dislocation lines lie preferentially on {111}, so dislocation-associated disordering affects the (111) diffraction line the least. The intensities of the other diffraction lines are more affected by compression. As a consequence, the relative intensity of the (111) peak increases with pressure with respect to the other peaks [Fig. 3(c)].
rDAC XRD
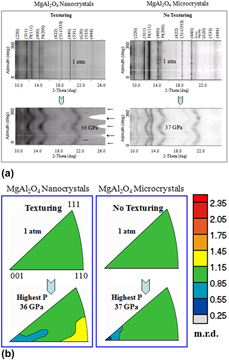
To have experimental evidence for the dislocation activity in the nanoceramics, we conducted high-pressure texturing measurements with rDAC XRD techniques (Fig. 4). Deformation texturing is known to originate from dislocations [Reference Merkel, McNamara, Kubo, Speziale, Miyagi, Meng, Duffy and Wenk24, Reference Kocks, Tomé, Wenk and Beaudoin36]. Plastic deformation by dislocation glide results in crystallite rotations, generating lattice preferred orientation or texture. We deformed MgAl2O4 samples nonhydrostatically in a panoramic diamond-anvil cell. The particle sizes of the MgAl2O4 samples are 25 ± 7 nm for nano-sized samples and 3 ± 0.8 µm for bulk-sized samples. No systematic variations in diffraction intensity are seen for the bulk-sized sample. In contrast, modest but resolvable intensity variations are observed in the nanoceramic sample above 4.0 GPa (Fig. 6).
(a) Azimuthally (0 to 360°) unrolled diffraction images of MgAl2O4 nanocrystals (left) and microcrystals (right) from radial DAC diffraction measurements. The long thick arrows represent the maximum compression direction and the short thin arrows the minimum compression direction. The curvature within the diffraction lines indicates that the sample is stressed. For MgAl2O4 nanocrystals at >4 GPa, texture is manifested by the systematic intensity variations of the diffraction peaks along the azimuthal direction. The narrow white line (horizontal) is due to blocking by the beam stop arm. The unlabeled weak diffraction lines are due to the partial crystallinity of the amorphous boron-epoxy gaskets. (b) The inverse pole figures (IPF) of MgAl2O4 nanocrystals (left) and microcrystals (right) along the compression direction (normal direction). Equal area projection and a linear scale are used. Texture strength is expressed as multiples of random distribution (m.r.d.), where m.r.d. = 1 denotes a random distribution and a higher m.r.d. number represents stronger texture. The IPF maximum of stressed MgAl2O4 nanocrystals appears at the 〈110〉 corner, which is compatible with the slip system {111}〈110〉.
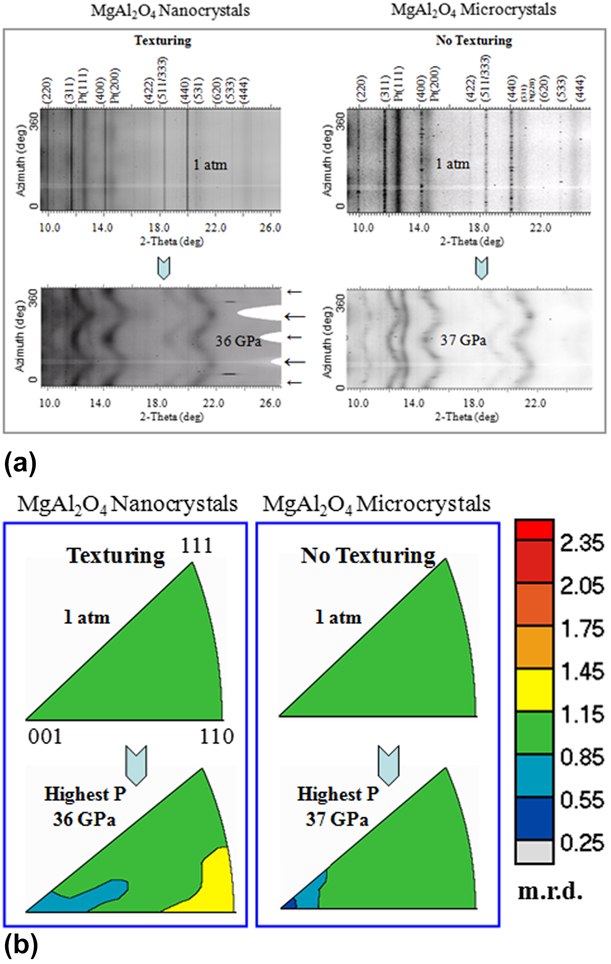
Rietveld refinement, implemented in the MAUD software [Reference Lutterotti, Matthies, Wenk, Schultz and Richardson27], was used to analyze the differential stress, microstructure, and texture of the samples at each pressure. Texture is represented with inverse pole figures of the compression direction (Fig. 6); these show the probability of finding the poles (normal) to lattice planes in the compression direction. Texture strength, the degree of lattice preferred orientation, remains unchanged at about 1 multiple of random distribution (m.r.d.) over the entire pressure range. Hence, no resolvable texture in the bulk ceramics evolves at pressures up to 37 GPa. In the experiment with the nanoceramic particles, texture starts to develop at 4.0 GPa with 1.27 m.r.d. On further compression to 36 GPa, the highest pressure of the measurements, the texture strength of the nanoceramics increases to 2.22 m.r.d. The observed texturing indicates that dislocation-mediated plastic deformation is active in the nanoceramics when high external pressures are applied. It is known that dislocation glide on preferred slip systems gives rise to crystallographic texture, whereas grain rotation by grain boundary (GB) sliding alone randomizes the grain orientation distribution [Reference Weissmüller and Markmann17]. Previous studies have established that the deformation texturing of nanocrystals arises from dislocations, not from GB processes.
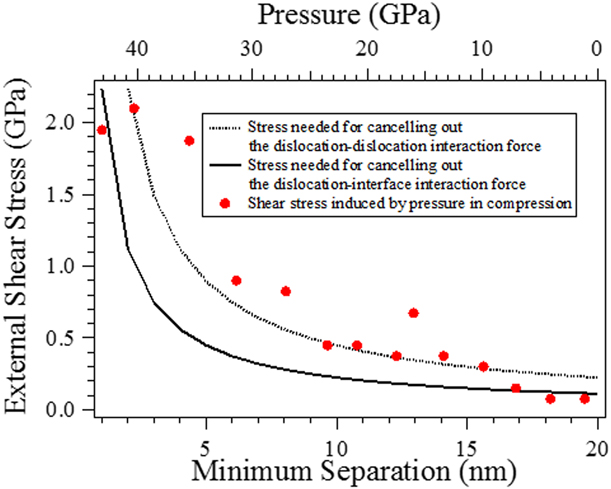
The physics governing the observed pressure-promoted stiffening and texturing in nanoceramics can be understood from the effect of pressure on dislocations. According to dislocation theory [Reference Hirth and Lothe37], stress can promote the retention of dislocations by decreasing their equilibrium distances and the distances between dislocations and the interfaces (Fig. 7). An external shear stress of 0.44 GPa (which is equivalent to an external pressure of 18 GPa in our axial DAC XRD experiment) could counteract the repulsion between dislocations and allow them to move within 10 nm of each other, as long as other effects do not impede dislocation motions and interactions. The estimation of image force and dislocation interaction includes straight edge dislocations chosen for the estimation of dislocation–dislocation interaction, for simplicity. The force per unit length of two edge dislocations separated by a distance of ldd is 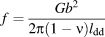 $f = {{G{b^2}} \over {2\pi \left( {1 - \nu } \right){l_{{\rm{dd}}}}}}$ (Reference Hirth and LotheRefs. 37 and Reference Nieh and Wadsworth38). In the estimation of the interaction force, published values, 62.9 GPa (Ref. Reference Anderson and Isaak39), 0.35 (Ref. Reference Wdowik, Parliński and Siegel40), and 0.286 nm (Ref. Reference Doukhan, Duclos and Escaig41), are used for the shear modulus (G), Poisson’s ratio (ν), and Burgers vector (b) of MgAl2O4, respectively. The image force (the interaction between a dislocation and a surface/interface) on per unit length of an edge dislocation at a distance of lds from the particle surface is
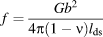 $f = {{G{b^2}} \over {4\pi \left( {1 - \nu } \right){l_{{\rm{ds}}}}}}$ (Reference Hirth and LotheRefs. 37 and Reference Nieh and Wadsworth38). The applied stress needed for canceling out the dislocation interaction force or image force is σext = f/b (Ref. Reference Nieh and Wadsworth38). Although more complicated dislocations may exist, the simplified calculation above is useful for a rough estimation of the dependence of dislocation concentration on compression.
External stress needed to achieve dislocation separations in the nanoceramic samples. External stresses push dislocations closer to one another, so dislocations become less controlled by particle size in stressed nanocrystals. The measured pressure gradients across the sample give an estimation of the shear stress induced by the nonhydrostatic pressure.
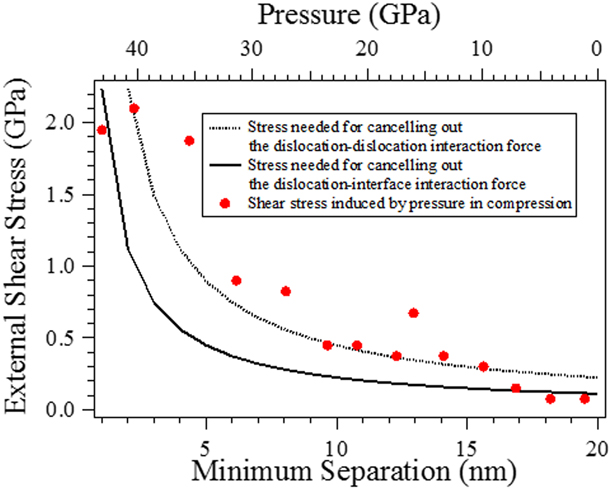
Because of nonhydrostaticity and different elastic strengths of nanocrystal cores and surface regions, external pressure induces shear stress within nanocrystals [Reference Ashby, Gelles and Tanner42, Reference Meade and Jeanloz43]. At each compression, the pressure was measured at multiple spots across the sample. Shear stress was estimated by using the empirical formula, 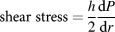 ${\rm{shear}}\;{\rm{stress}} = {h \over 2}{{{\rm{d}}P} \over {{\rm{d}}r}}$ (Ref. Reference Meade and Jeanloz43). The gasket thickness was assumed to be 10–30 µm. These values are underestimated because the elastic strength difference of nanocrystal cores and grain boundaries was not included in the estimation.
The dislocation density of MgAl2O4 at ambient conditions was reported to be of the order of 1012 m−2 (Ref. Reference Doukhan, Duclos and Escaig41). So, at room pressure, an MgAl2O4 particle of size 20 nm contains 1012 m−2 × π(10 nm)2 ≈ 0 dislocations. Under an external shear stress of 0.44 GPa, dislocations can be pushed as close as 10 nm to one another. Assuming there are only full-edge dislocations for simplicity, the dislocation density can be 4/[π(10 nm)2] ≈ 1016 m−2.
Because of the solidification of the pressure medium, the pressure in the axial DAC experiments is nonhydrostatic above 10 GPa. In the current study, the sample was compressed to 43 GPa, which should be sufficient to generate the shear stress needed to produce dislocation microstructures even within the nanocrystals (Fig. 7). Because no pressure medium was used in the texturing experiments, shear stress was generated even at low pressures. According to the MAUD calculations, at 4 GPa (the external pressure), the shear stress in the nanoceramic sample is ∼0.92 GPa (extracted from the differential strain of the crystal lattices) in this radial DAC XRD experiment.
Previous studies suggested that nanoceramics are expected to exhibit enhanced diffusional creep because of their greatly increased creep rate associated with grain boundary diffusion [Reference Karch, Birringer and Gleiter2]. Therefore, the conventional belief is that the enhanced diffusional activities would make nanoceramics less brittle. The contribution of diffusion cannot be assessed in this study, but the crystallographic dependence of texturing suggests that the deformation texturing is not arising from diffusion. The observed texturing in the nanoceramic sample indicates that dislocation mechanisms provide a significant mechanism of plastic deformation in nanoceramics. Although the textures formed at high pressure are quenchable, dislocations usually cannot remain in nanocrystals when no external shear stresses sustain them, so postdeformation measurements may not constrain dislocation-associated deformation in nanoceramics. In contrast, although dislocations can exist in bulk-sized ceramics, they tend to not move as rapidly in ceramics as they do in metals. This limits the amount of energy that can be dissipated ahead of a growing crack by plastic flow, resulting in brittle failure [Reference Clegg1]. The stress needed for the nucleation and propagation of cracks is lower than that for dislocations, so fracturing processes are more favorable, and dislocation mechanisms are not operative. Although grain fracturing may occur under pressure, the compression behavior of bulk ceramics appears to involve purely elastic deformation over a relatively large pressure range (Fig. 2).
In the nanoceramic sample, dislocations are not suppressed by cracks, as indicated by the observed texturing. The frictional-wear mechanism–associated crack growth was reported in grain-bridging ceramics [Reference Dauskardt44]. However, no cracks seem nucleating in the MgAl2O4 nanocrystals [Fig. 3(b)] in our experiments, although stepwise compression could be treated as escalating cyclic loading. Finite element analysis, which has been successfully applied to the crack behaviors in accumulative roll-bonded Cu/Nb nanolaminates [Reference Radchenko, Anwarali, Tippabhotla and Budiman45], could be useful for understanding the crack–dislocation transition in ceramics. Dislocations usually change the stress and strain profiles of a crystal and result in inhomogeneous deformation. The dislocationless-to-dislocation–mediated deformation transition accounts for the observed stiffening in the compression behaviors of MgAl2O4 nanocrystals. The stiffness of lattice is primarily determined by atomic bonding strength, and distorted bonds due to dislocations or other defects usually exhibit enhanced strength [Reference Gilbert, Huang, Zhang, Waychunas and Banfield46]. Even in the same sample, multiple deformation mechanisms could coexist and result in different mechanical behaviors in the different parts of the sample [Reference Lee, Kim, Burek, Greer and Tsui47, Reference Razorenov48]. The deformation mechanism transition pressure obtained in the rDAC XRD experiments, i.e., the texturing pressure (Fig. 6), is lower than that obtained in the axial DAC experiments (Figs. 2 and 3), which is expected from the lack of a pressure medium, and hence larger nonhydrostatic stresses, in the texturing measurements. Once immobilized, dislocations always tend to move from glide to climb configurations, forming a 3D dislocation network. Dislocation networks resist compression more than normal regions because the structure is already internally strained. We propose that the enhanced overlap of dislocation strain fields in smaller particles accounts for pressure-induced stiffening, as we observed in MgAl2O4 nanocrystals at high pressures. The differential stress analysis [Reference Chung, Weinberger, Levine, Kavner, Yang, Tolbert and Kaner49] indicates that the strength of the nano-sized and bulk-sized MgAl2O4 is comparable over the pressure range of this study. Thus, MgAl2O4 nanoceramics are stiff, strong, and ductile.
Conclusions
These results emphasize the importance of combined axial and radial DAC X-ray experiments in assessing nanoscale mechanics. The deformation characterization of materials with grain sizes down to several nanometers can be reproducibly measured using this technique, but it is technically impossible by any other technique available. Contrary to the conventional belief, our results demonstrate that dislocation mechanisms of deformation are operative in stressed nanoceramics. Dislocations make the nanoceramics stiff and ductile. By optimizing particle size and deformation textures, the mechanical properties of ceramics may be better engineered for various applications in semiconductor [Reference Godefroo, Hayne, Jivanescu, Stesmans, Zacharias, Lebedev, Van Tendeloo and Moshchalkov50], medical [Reference Jackson, Robinson, Ali, Kousar, Mei, Gracio, Taylor and Ahmed51], aerospace [Reference Lei, Chen, Guo, Wang, Tan, Khosravi, Yan, Vennila Raju and Yang52, Reference Presting and König53], and other fields [Reference Ikesue and Aung54]. This work provides a way for examining and engineering the strain-induced deformation behavior of ceramics, with prospectively a range of technological applications.
Methods
Synthesis of nanoceramic spinel samples
Spinel nanopowders were prepared by the molten salt baking method. High-purity NH4Al(SO4)2·12H2O and MgSO4·7H2O, with a molar ratio of 2:1, were first dissolved into deionized water. The solution, held in a quartz vessel, was then put into a muffle oven for calcination at 1150 °C for 4 h. Afterward, nanopowders of MgAl2O4 were obtained through screening. The average particle size of the powders is ∼20 nm.
Axial diamond-anvil cell XRD for elastic and plastic deformation measurements
High pressures were generated using a symmetric-type diamond-anvil cell with large openings to allow axial XRD. To minimize the nonhydrostatic pressure on the samples, a methanol:ethanol (4:1) solution was used as pressure. Ruby was used as a pressure calibrant. High-pressure XRD measurements were made at synchrotron beamline 12.2.2 of ALS, Lawrence Berkeley National Lab, USA, using the angle-dispersive mode.
Radial diamond-anvil cell XRD for texturing and differential stress measurements
High pressures were generated using a panoramic-type diamond-anvil cell with large openings to allow radial XRD. To maximize the deviatoric stress on the samples, no pressure medium was used. Platinum was used as a pressure calibrant. High-pressure XRD measurements were made at synchrotron beamline 12.2.2 of ALS, Lawrence Berkeley National Lab, USA, using the angle-dispersive mode.
Experimental
Sample materials preparation
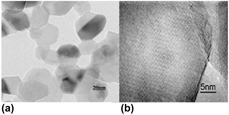
MgAl2O4 nanopowders were prepared by the molten salt baking method [Reference Lu, Chang, Qi, Luo, Wei, Zhu, Sun, Lian and Wang55]. The average particle size of the powders is ∼20 nm (Fig. 8). More details can be found in the Methods section.
(a) TEM and (b) HRTEM images of nanosized MgAl2O4 powders calcined at 1150 °C for 4 h.

Axial DAC XRD measurements
A spring-steel gasket, with a chamber having a diameter of 100 μm, was used to contain the sample between 350-µm culet diamonds. A methanol:ethanol (4:1) solution was used as a pressure-transmitting medium. A small amount of ruby (<2%) was included for pressure determination from its fluorescence shifts. High-pressure XRD measurements were made at synchrotron beamline 12.2.2 of the Advanced Light Source (ALS), Lawrence Berkeley National Lab (LBNL), in Berkeley, California. Measurements were made on compression and decompression at intervals of 3–6 GPa (Fig. 5).
rDAC XRD measurements
High pressures were generated using a panoramic-type diamond-anvil cell with large openings to allow radial XRD (Fig. 4). A boron-epoxy disc of ∼5 mm diameter was prepared as described in Ref. Reference Jang and Greer4. The disc was polished to 50 µm thickness. Small gaskets of 400 µm diameter were cut from the polished disc with a laser miller from Oxford Industries. The gasket, with a 50-µm-wide hole drilled at the center as a sample chamber, was inserted into a drilled Kapton support with a narrow rectangular shape. The whole gasket assembly was put between the two diamonds of the cell with clay to fix the Kapton gasket in place. The sample powders were loaded in the gasket chamber. A small fragment of ∼10-µm-thick platinum foil was put on top of the sample, which was used as a position marker and pressure calibrant in each experiment. To maximize the deviatoric stress on the samples, no pressure medium was used. The samples were compressed between diamond culets of 300 µm diameter. Monochromatic synchrotron X-ray was used to conduct the XRD experiments at beamline 12.2.2 of the ALS, LBNL. A Mar345 image plate was used to record the Debye diffraction rings of the samples. The exposure time was typically 60–180 s. Sample-to-detector distance and detector nonorthogonality were determined using a LaB6 standard before the experiment.
Acknowledgments
The authors acknowledge support of National Natural Science Foundation of China (Grant Nos. 51527801 and U1530402). BC thanks A. Paul Alivisatos, Katie Lutker, and David Walker for discussions; Rebecca Hardin and James Wu for microcrystal preparation; Jason Knight for technical assistance; and the Wenk group of UC Berkeley for their panoramic diamond-anvil cells and help with texturing analysis. Financial support for this work was provided by NSF, including from COMPRES, the Consortium for Materials Properties Research in Earth Sciences, under NSF Cooperative Agreement EAR 10-43050. The Advanced Light Source is supported by the Director, Office of Science, Office of Basic Energy Sciences, of the US Department of Energy under Contract No. DE-AC02-05CH11231.