


Introduction
In the 1970s, a considerable effort was made to relate acoustic emissions from snow to avalanche formation and slope stability. Both field experiments (Reference St. Lawrence and BradleySt. Lawrence and Bradley, 1977; Reference SommerfeldSommerfeld, 1977; Reference GublerGubler, 1979) and laboratory tests (Reference St. LawrenceSt. Lawrence, 1980) were carried out in a frequency range from a few hertz to several megahertz. Reference St. LawrenceSt. Lawrence, 1980 noted that in field experiments avalanche formation was related to both an increased acoustic-emissions activity (Reference St. Lawrence and BradleySt. Lawrence and Bradley, 1977; Reference SommerfeldSommerfeld, 1977; Reference GublerGubler, 1979) and a quiescent period, i.e. a period without acoustic emissions (Reference Bowles and LawrenceBowles and St. Lawrence, 1977). He supposed that avalanche formation occurring without premonitory signals was due to brittle failure. Furthermore, St. Lawrence maintained that low-frequency signals are associated with a local instability when fracture is arrested prior to catastrophic failure. Conversely, high-frequency signals are associated with microcracks occurring in the ice grains during primary creep, similar to the processes observed in polycrystalline ice (Reference GoldGold, 1960). Based on the assumption that high-frequency acoustic emissions are related to the deformation of snow, Reference St. LawrenceSt. Lawrence, 1980 developed a constitutive equation which described the acoustic emission activity as a function of both stress and strain for snow showing ductile behaviour.
The work of St. Lawrence remains the only effort to quantify the acoustic emission response of snow. The majority of work is limited to a qualitative analysis. Unfortunately, since the mid-1980s little experimental work has been undertaken in this research field. For other forms of ice (e.g. polycrystalline ice (Reference Weiss, Grasso and MartinWeiss and others, 1998) and frozen soils (Reference Fish and SaylesFish and Sayles, 1981)), a few quantitative investigations have been performed. Reference Fish and SaylesFish and Sayles (1981) have related the maximum acoustic-emission rate (AE rate) to the minimum strain rate occurring during secondary creep with a power law based on the application of rate-process theory.
Our investigations attempt to quantify the influence of temperature, applied strain rate and snow density on the acoustic emission response of snow. The power law presented by Reference Fish and SaylesFish and Sayles (1981) is used to describe the relationship between the applied strain rate and the peak AE rate, as a function of density and temperature. Further, the influence of the temperature on the rate processes generating acoustic emissions is investigated. The wide range of the strain rates investigated, covering both the ductile range and the transition to a brittle behaviour, allows qualitative insight into the origin of acoustic emissions in snow. In particular, the influence of the transition from ductile to brittle behaviour on the acoustic emission detected by two different piezoelectric sensors, a wide-range sensor (frequency 100–1000 kHz) and a resonant sensor (frequency 35– 100 kHz), is analyzed. These results give insight into the discussion of the hypotheses proposed by Reference St. LawrenceSt. Lawrence, 1980.
The data analysis is based on results of monoaxial deformation-controlled compression tests on fine-grained alpine snow with a density of 220–380 kgm-3 at temperatures between T = -11.2°C and T = -1.7°C. The applied strain rate was varied from ɛ̇ = 1.1 × 10⁻⁶ s-1 to ɛ̇ = 2.6 × 10⁻³ s-1.
Test Procedure
The tests were performed using a deformation-controlled triaxial apparatus (von Moos and others, 2003). In total, 70 compression tests with acoustic emission measurements were completed. For all tests natural, fine-grained (d < 0.2mm) alpine snow was used. This snow was collected near Weissfluhjoch, Davos, Switzerland, at approximately 2540 ma.s.l. The test samples, cylindrical specimens 126mm long and with a diameter of 58 mm, were compressed to an axial strain of ε = 15%. During the tests, acoustic emission signals were measured with the device depicted in Figure 1. As shown in Figure 2, the piezoelectric sensors were incorporated in both the bottom and the top load plate. The surface of the sensor was in contact with the loaded snow. The piezoelectric sensors are standard products delivered by the company EPA (Euro Physical Acoustic): a resonant sensor type R6 with a frequency spectrum of 35–100 kHz, and a wide-band sensor type WD with a frequency spectrum of 100–1000 kHz. As shown in Figure 1, the detected signals were amplified by a 60 dB power preamplifier and filtered in a low-pass filter to eliminate background noise and disturbance signals caused by the cold-room cooling apparatus (Fig. 3). The amplitude of the filtered background noise was 10 mV and that of the disturbance signal was approximately 100 mV. Therefore the disturbance signals could be eliminated easily using a burst trigger circuit, where the bursts were counted. As shown in Figure 3, one count was registered when the amplitude exceeded a trigger level of 250 mV. In order to count an event only once, we introduced a dead time of 200 μs for the R6 sensor and 20 μs for the WD sensor after each count. The dead time was selected on the basis of the analysis of the waveform (maximum amplitude, rise time and decay time) performed in preliminary tests. The cumulative counts and the AE rates were determined with a pulse counter, which was used to analyze the impulses received from the burst trigger circuit. An oscilloscope was connected to the acoustic emission testing system (Fig. 1) in order to depict the waveform and to calculate the power spectra (Fig. 4) of the acoustic emission signals.
Schematic diagram of the acoustic-emission measuring system.

Schematic diagram of part of the acoustic test equipment. One piezoelectric sensor was integrated into each load platen.
Threshold setting to avoid triggering by continuous background noise and short disturbance signals.
Power spectra for (a) acoustic emission of snow detected with the wide-band sensor WD for _ = 331 kgm-3, T = -3.6°C and ɛ̇= 1.1 × 10⁻⁵ s -1; (b) single disturbance signals generated by the cooling apparatus; (c) acoustic emission of snow detected with the resonant sensor R6 for a test during brittle failure for ρ = 333 kg m-3, T = -3.8°C and ɛ̇ = 2.6 × 10⁻³ s-1; (d) acoustic emission of snow detected with the resonant sensor R6 for a test in the ductile range ρ = 331 kgm-3, T = -3.8°C and ɛ̇= 2.0 × 10⁻⁴ s-1.
Test Results
Qualitative observations
Figure 4 shows typical power spectra for:
-
1 acoustic emissions from snow detected with the wideband sensor WD (Fig. 4a)
-
2 disturbance signals generated by the cooling apparatus (Fig. 4b). The disturbance signals occurred for a few seconds in an interval of a few minutes
-
3 acoustic emissions from snow detected with the resonant sensor R6 for a test in the ductile range (Fig. 4d) and during brittle failure (Fig. 4c).
The frequency distributions shown in Figure 4a and d are related to events measured during the ductile deformation of snow. As can be seen, the peak frequency is 500 kHz for the wide-band sensor and 100 kHz for the resonant sensor. The frequency distribution curves reflect the sensitivity of both sensors. These observations lead to a first conclusion, that the acoustic emission signal is a wide-band signal and can therefore be measured over a wide frequency range. Figure 4b shows the frequency distribution of a disturbance signal. As can be seen, the peak frequency is 2.6 MHz. Figure 4c shows the frequency distribution of an event occurring during brittle failure of snow. In this case, the frequency distribution differs from Figure 4d. During brittle failure, the peak frequency is spread over a range of 30– 100 kHz.
Figure 5 and Figure 6 show the evolution of the AE rate with increasing strain superposed with the stress–strain curve. The ductile behaviour of snow is depicted in Figure 5. For both sensors the AE rate increases with increasing stress and strain until a peak value is reached, then it decreases rapidly to zero. The strain at which the maximum AE rate was measured corresponds to the strain ε = 1.5% at which the material begins to yield. Note that the peak value of the AE rates is much larger for the wide-band sensor than for the resonant sensor. Figure 6 shows the material response during brittle failure. Note that the stress curve, which shows a series of abrupt movements, is characteristic for brittle failure. On the wide-band sensor, we observed an increase of the AE rate with increasing strain until a peak value, and then a decrease, very similar to the measurement for ductile behaviour. The measurements on the resonant sensor showed somewhat surprising behaviour: the AE rate increased to a peak value at a total strain of ε = 5%, that is during large-scale failure of the specimen, and decreased only at a total strain ε = 7.5%. Note that the peak AE rates are, contrary to Figure 5, of the same order of magnitude for both sensors.
AE rate and stress vs strain for ρ = 378 kg m-3, T = -3.6°C and ɛ̇ = 1.9 × 10⁻³ s-1. The specimen tested shows ductile behaviour.
AE rate and stress Vs strain for ρ = 377 kg m-3, T = -3.6°C and ɛ̇ = 2.6 × 10⁻³ s-1. The specimen tested undergoes brittle failure by a total strain εf = 0.5%.
AE-rate–strain-rate relationship
Researchers dealing with frozen soil (Reference FishFish and Sayles, 1978) and ice (Reference FishFish and Sayles, 1978) used the constitutive equation developed by Reference FishFish and Sayles, 1978, based on the theory of rate processes (Reference Glasstone, Laidler and EyringGlasstone and others, 1941), to describe the relationship between minimum creep rate and peak AE rate (Equation (1))

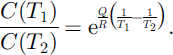
where Ṅm is the peak AE rate in bursts per second, C0 is a pre-exponential, temperature-independent constant in bursts per second, Q is the activation energy in kJ mol-1, R is the gas constant in kJ mol-1 K-1, T is the temperature in K, ɛ̇ m is the minimum creep strain rate in s-1 and γ is a dimensionless exponent. In our deformation-controlled tests, the applied strain rate is constant and the stress increases until a yield stress is reached (Fig. 7). At this point the relationship between yield stress and applied strain rate is equal to the relationship between applied stress and minimum viscous strain rate for creep tests (Reference Scapozza and BarteltScapozza and Bartelt, 2003), i.e. a steady state is reached. Therefore, Equation (1) is valid for both the minimum viscous strain rate during creep tests and the applied strain rate for deformation-controlled tests. As shown in Figure 8, for the wide-band high-frequency sensor WD, the power law expressed in Equation (1) is also valid for snow as long as the snow remains in the ductile deformation region. At the transition to brittle failure, we observe a decrease of the AE rate with increasing strain rate. Thus, Equation (1) is not valid for this region. Figure 9 shows the AE-rate–strain-rate relationship for emissions registered by the resonant low-frequency sensor R6. As can be seen, in this case the power law (Equation (1)) is valid for both the ductile and the brittle behaviour. Quantitatively, the AE rates measured on the wide-band high-frequency sensor WD are one order of magnitude larger than those measured on the resonant low-frequency sensor R6. Note that for strain rates below ɛ̇ = 1.1 × 10⁻⁵ s-1 no acoustic emissions were recorded. The values of the pre-exponential parameter C and the exponent γ of Equation (1) are reported in Table 1. The temperature- and density-independent exponent γ varies between 1.87 and 2.52. As shown in Figure 10, the pre-exponent C decreases with increasing temperature. Thus, for a constant strain rate the maximum AE rate decreases with increasing temperature. The influence of the temperature on the pre-exponent C can be described, transforming Equation (1) in the following equation:
Qualitative comparison between stress–strain curve and cumulative acoustic emissions υs strain.The yield stress is σy = 425 kPa.
Peak AE rate υs applied strain rate for a density ρ = 378 kg m-3 at different temperatures. The acoustic emission measurements were performed with a wide-band sensor WD with frequency range of 100–1000 kHz.
Peak AE rate υs applied strain rate for a density ρ = 378 kg m-3 at different temperatures. The acoustic emission measurements were performed with an R6 resonant sensor with frequency range of 35–100 kHz.
Parameter C υs temperature for different densities. The acoustic emission measurements were performed with a WD wide-band sensor with frequency range of 100– 1000 kHz.
Experimental values of the parameters C and γ used in Equation (1) for different densities and temperatures. r is the correlation coefficient and N is the number of data values

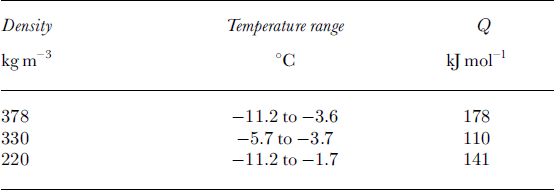
As can be seen in Equation (2), the influence of temperature on the parameter C is regulated by the activation energy Q. It was therefore possible to determine the activation energy Q from the data presented inTable 1. Note that values of Q could only be calculated when the exponent γ was approximately the same for the temperatures T1 and T2. The calculated values of the activation energy Q are reported in Table 2 for different densities and temperature ranges. As can be seen, the density-independent activation energy Q varies between 110 and 178 kJmol-1. The calculated values fit well with the calculated activation energy Q = 120kJ mol-1 for polycrystalline ice for temperatures above -10°C (Reference Barnes, Tabor and WalkerBarnes and others, 1971). Table 1 and Figure 10 also show the density dependence of the pre-exponent C: It increases with increasing density. Thus, for a constant temperature and strain rate, the maximum AE rate increases with increasing density.
Activation energy Q calculated from Equation (2) for different densities and temperature ranges
In addition to the analysis performed above concerning the source of rate-process-based acoustic emissions in snow, it is also possible to relate the evolution of acoustic emissions over time to the stress and strain state of the specimen. Empirically, a certain similarity can be established between the stress–strain curve and the cumulative acoustic-emission vs strain curve (Fig. 7). Based on this similarity, Reference St. LawrenceSt. Lawrence, 1980 developed a constitutive equation both for strain- and for stress-induced emissions. The constitutive equations developed by Reference St. LawrenceSt. Lawrence, 1980 are supported by our test results for strains above εfc, where εfc is the strain at which the first acoustic emission events were measured, over the whole investigated range of temperatures, strain rates and densities. A detailed analysis of the stress-and strain-induced acoustic emission is too extensive to be included in this paper.
Discussion of the Test Results
Qualitative observations
The power spectra shown in Figure 4 provide information about the microstructural origin of acoustic emissions. The emissions produced by microcrack formation inside the ice grains during ductile deformation have wide-band signals, i.e. they can be measured with different sensors, although the peak frequency of these acoustic emissions seems to be in the region of 500 kHz. These results agree with the measurements for ice performed by Reference Weiss, Grasso and MartinWeiss and others (1998) and can explain the difference in the AE rates measured by the two different sensors, WD and R6. Part of the event cannot be recorded with the resonant sensor, because the peak frequency is too far from the resonance frequency of the sensor and therefore the signal amplitudes are very small. The behaviour shown in Figure 5 and Figure 6 is somewhat surprising. Large-scale fracture within the ice skeleton of snow produces acoustic emissions, which cannot be detected in high-frequency range. In contrast to acoustic emission due to ductile deformation, where the AE rate decreases after reaching yield, the AE rates caused by brittle failure remain constant during the failure process.
Our laboratory experiments lead us to the following conclusions about the field observations reported by Reference St. Lawrence and BradleySt. Lawrence and Bradley (1977), Reference SommerfeldSommerfeld (1977), and Reference GublerGubler (1979). The observed avalanche release after a quiescent period (Reference Bowles and LawrenceBowles and St. Lawrence, 1977) is probably due to softening of the material at large strains. As shown in Figure 5, for ductile behaviour, relevant acoustic emissions are recorded for strains below ε = 3%, while ductile fracture due to softening occurs at strains of order ε = 20% (Reference NaritaNarita, 1980). Therefore, there is a period without acoustic emission before avalanche release. In the case of avalanche release due to brittle failure, acoustic emissions are directly related to avalanche release. The hypothesis of Reference St. LawrenceSt. Lawrence, 1980, that avalanche formation without premonitory signals is due to brittle failure, can be partly supported by our test results. For strain rates in a brittle range, the first acoustic emissions are detected at a strain εfc = 0.35%; this strain corresponds approximately with the strain at which the specimen undergoes brittle failure. Subsequently, the time interval between first acoustic emission and brittle failure is very short, probably <1s. The further hypothesis reported by Reference St. LawrenceSt. Lawrence, 1980, that low-frequency signals may be associated with a local instability, can also be supported by our experiments. The emissions recorded during both ductile deformation and brittle failure of the specimen can also be detected in the field by large-scale ductile deformation or brittle failure of local zones. These local instabilities do not necessarily lead to a catastrophic failure.
AE-rate–strain-rate relationship
As shown in Figure 8, the peak AE rate can be related to the applied strain rate using a power law based on the rate-process theory (Equation (1)). The calculated activation energy Q, based on the determination of the parameter C of Equation (1), corresponds well with the calculated values for ice creep based on Glen’s law (Reference Barnes, Tabor and WalkerBarnes and others, 1971) for the investigated temperature range. Therefore, we suppose that the microcrack formation, which produces high-frequency acoustic emissions during ductile deformation, is related to creep processes occurring in the ice skeleton. The parameter C increases with increasing density. This result was expected, because high-density snow contains a higher ice fraction per unit volume than low-density snow. As soon as brittle failure occurs, the above considerations are no longer valid and the peak AE rate decreases with increasing strain rate. Two possible mechanisms could produce the effect observed in Figure 8: (1) The strain at which the specimen undergoes brittle fracture is smaller than the strain needed for yielding. Therefore, the maximum peak AE rate due to microcrack formation within the ice grains cannot be reached because the specimen fails at a smaller strain. (2) Brittle failure involves localization of damage, rather than the distributed microcrack formation occurring during the ductile creep deformation. Therefore, fewer AE events per unit stream (1) or per unit time (2) are produced during brittle failure. Since the characteristic frequency decreases as the size of the AE source increases, the development of the larger flaws would be expected to produce more low-frequency emissions. This effect is indicated in Figure 5, Figure 6 and Figure 9.
As shown in Figure 9, for acoustic emissions measured with a low-frequency resonant sensor, the peak AE rate increases with increasing strain rate for brittle behaviour as well. Unlike the high-frequency wide-band sensor, with the resonant sensor R6 it was possible to measure both acoustic emissions due to ductile deformation (Fig. 5) and large-scale brittle failure occurring within the specimen. Hence, the events occurring during the failure of the specimen could be recorded.
Applicability of the laboratory test results
The following discussion concerns the applicability of the laboratory test results discussed above with field measurements. As shown in Figure 7–Figure 9, acoustic emissions and AE rates can be related to stress, strain or strain-rate state as functions of temperature and density. Therefore, it is supposed that the same relationships can be applied to describe the stress, strain and strain-rate state in the snow cover. However, some points cannot be overseen in these considerations. First, our tests were performed on small specimens where the maximum distance between the acoustic emissions source and the transducer was 126 mm. In the field the distance between a local source and the transducer could be of the order of metres. Second, the specimens tested were not subjected to a prior load history. As shown in Figure 11, acoustic emissions are strongly dependent on the load history. As can be seen, three different specimens were strained in a first load cycle up to a total strain of ε = 5% at three different strain rates. After a relaxation period of 10 min they were reloaded in a second cycle until a total strain ε = 10% was reached. Although the strain rate applied in the second cycle was the same for all the specimens, the peak AE rates differed considerably. The higher the applied strain rate in the first cycle, the lower the peak AE rate in the second cycle. The same procedure was repeated in a third cycle, which was started after 3 hours’ relaxation time. As can be seen, the peak AE rate was approximately the same for the three specimens loaded up to a total strain of ε = 15% at a strain rate ɛ̇ = 2.0 × 10⁻⁴ s-1. However, the peak AE rates reached during the third cycle are clearly smaller than those measured in the first cycle at a strain rate ɛ̇ = 2.0 × 10⁻⁴ s-1. These considerations lead us to the conclusion that a quantitative comparison between field measurements and laboratory tests will be very difficult.
Influence of the load history on the acoustic emissions for ρ = 329 kg m-3 and T = -11.3°C.
Conclusions
The test results reported above show that the relationship between applied strain rate and peak AE rate can be described using a rate-process-based constitutive equation as long as the specimen deformation is ductile. The influence of temperature on the acoustic emissions is controlled by the activation energy Q which fit well with the calculated values for ice creep based on Glen’s law. Therefore, we suppose that the microcrack formation, which produces high-frequency acoustic emissions during ductile deformation, is related to creep processes occurring in the ice skeleton. Because density does not influence the activation energy Q, we conclude that the microstructural deformation processes occurring within the ice skeleton are the same over a wide range of density. The transition from ductile to brittle behaviour influences the relationship between strain rate and peak AE rate, because brittle failure involves localization of damage, rather than the distributed microcrack formation occurring during the ductile creep deformation. Hence there are fewer acoustic emission events per unit time. The analysis of the power spectra shows that brittle failure is characterized by low-frequency acoustic emissions, produced by large crack formation originating from material flaws.
The constitutive relationship presented in this paper, in addition to the constitutive equation developed by Reference St. LawrenceSt. Lawrence, 1980, would be very helpful for monitoring the state of the snowpack in the field. Ideally, it would be possible to detect zones undergoing large viscous deformations, similar to measurements carried out to determine the structural integrity of steel structures. However, this is unrealistic for two major reasons. First, scaling problems from small-scale laboratory measurements to large-scale field measurements are present. Second, the load history, which is well known for specimens tested in the laboratory, is totally unknown in the field. Therefore, the equation parameters determined in the laboratory are not directly applicable to field studies.
Acknowledgements
The authors would like to thank the Swiss National Science Foundation for the financial support of this work. Particular thanks go to the technical staff of both the Institute for Geotechnical Engineering of the Swiss Federal Institute of Technology of Zürich and the Swiss Federal Institute for Snow and Avalanche Research of Davos for the impeccable technical support during the development.



