I. INTRODUCTION
The fracture toughness of brittle materials with linear-elastic deformation behavior can be tested quite reliably based on linear elastic fracture mechanics (LEFM). Even at the micron and submicron length scale, various studies Reference Di Maio and Roberts1–Reference Armstrong, Rogers and Roberts8 have shown that versatile fracture experiments can be adequately evaluated. Rectangular beams with and without notches were prepared in diamond-like carbon coatings by Schaufler et al. Reference Schaufler, Schmid, Durst and Göken2 to investigate the fracture toughness and the interface strength of their films with a thickness below 1 µm. Matoy et al. Reference Matoy, Schönherr, Detzel, Schöberl, Pippan, Motz and Dehm3 used a similar geometry and investigated among other things the fracture toughness of passivated silicon based thin films. Various geometries such as cantilevers, double-cantilevers, clamped beams, and pillars were applied by Jaya et al. Reference Jaya, Kirchlechner and Dehm5 in silicon to compare the fracture toughness obtained by different geometries and evaluation methods. Chevron-notches were used in rectangular beams by Mueller et al. Reference Mueller, Pejchal, Žagar, Singh, Cantoni and Mortensen6 to create stable crack propagation in the brittle materials fused silica and alumina. Pentagonal beams were chosen by Armstrong et al. Reference Armstrong, Rogers and Roberts8 to test stress corrosion cracking of individual grain boundaries in a steel.
In our study, we focus particularly on single crystals of the intermetallic compound NiAl with B2 crystal structure. Due to the strong anisotropy of the fracture behavior of this compound, the 〈011〉{100} crack system was chosen for the experiments as stable crack propagation accompanied by plastic deformation was found macroscopically for such an orientation. Reference Bergmann and Vehoff9,Reference Thome, Göken and Vehoff10 In that case a plastic zone ahead of the crack tip is formed which influences the fracture process decisively.
In a previously conducted study on NiAl, Reference Ast, Przybilla, Maier, Durst and Göken11 it could be shown that the J-integral technique in particular offers the possibility to determine the fracture toughness for elastic–plastic materials at the microscale. The J-integral concept has been previously used by Wurster et al. Reference Wurster, Motz and Pippan12 and Bohnert et al. Reference Bohnert, Schmitt, Weygand, Kraft and Schwaiger13 for investigations on single-crystalline tungsten by microcantilever experiments. In their experiments, multiple partial unloading segments were performed throughout the experiments to evaluate the stiffness at certain loading intervals. A new method is presented here which provides a continuous recording of crack resistance curves at the microscale. This helps to precisely determine the fracture toughness at the onset of stable crack propagation, and allows for a more detailed understanding of the fracture behavior.
To further evaluate the testing technique, NiAl single crystals containing 0.14 wt% Fe were investigated in addition to stoichiometric crystals. Bergmann and Vehoff Reference Bergmann and Vehoff9 performed macroscopic four-point bending tests using the same crystal and crack system. Compared to a pure stoichiometric NiAl single crystal, they found an increase in the room temperature fracture toughness for the Fe-containing sample of approximately 15%. Here, we further investigate if the enhanced fracture toughness of the Fe-containing crystals is also found at the microscale.
II. EXPERIMENTAL
A. Material and sample preparation
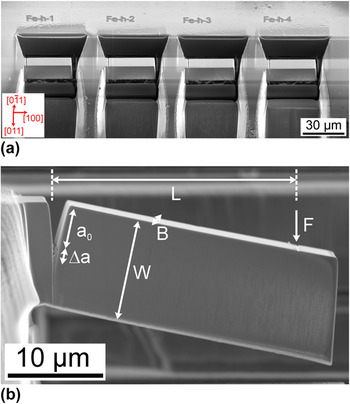
Details on the fabrication of the single-crystalline NiAl samples can be found in the literature. Reference Bergmann and Vehoff9,Reference Thome, Göken and Vehoff10,Reference Bergmann and Vehoff14 The samples were ground with SiC paper and were then polished using a mixture of oxide particle solution and hydrogen peroxide. Finally, the samples were electropolished using the electrolyte A3 from Struers to remove the remaining deformation. The nanoindentation approach described by Iqbal et al. Reference Iqbal, Ast, Göken and Durst15 was applied to check for a pop-in behavior in the load–displacement curves, as this indicates a sufficiently good surface quality for nondeformed materials. Focused ion beam (FIB) milling was used to shape the cantilevers and to create a notch. Details on the preparation are given in a previous publication. Reference Ast, Przybilla, Maier, Durst and Göken11 All milling steps were performed at a constant gallium ion acceleration voltage of 30 kV. The ion currents were progressively reduced from ∼20 nA down to ∼1 nA at the dual beam device (Helios NanoLab 600i, FEI Company, Hillsboro, Oregon) to fabricate the desired cantilever shape. In the final stage, the notch was milled as a line feature from the top with an ion current of ∼1 nA, leading to a straight and sharp notch tip with a crack tip radius, which was measured to be 60 ± 10 nm for the investigated samples. The final dimensions of the microcantilevers were measured using a scanning electron microscope (SEM). The height W and the width B of each cantilever were in the range of 9–15 µm and the total length was set to 30–40 µm to have a span L, which is sufficiently high to establish pure bending. The initial crack length a 0 was adjusted to be approximately 0.4W. The four cantilevers prepared into the sample edge of the Fe-containing NiAl crystal are shown in the secondary electron (SE) micrograph in Fig. 1(a) prior to testing together with the crystallographic orientation. One cantilever after testing with an indication of the relevant geometrical dimensions is presented in Fig. 1(b).
(a) SE micrograph showing a series of cantilevers prior to testing in the Fe-containing NiAl single crystal together with the crystallographic orientation of the sample and (b) SE micrograph of a micro-cantilever with a straight notch in pure B2-NiAl after testing and the relevant dimensions.

B. J-Integral testing at the microscale
Four microcantilevers for each material were tested using a nanoindenter (G200, Keysight Technologies, Chandler, Arizona). A wedge-shaped diamond indenter having a sharp edge and providing thus a precise contact line was chosen for loading the cantilever until fracture. Compared to a pointed indenter, the wedge indenter produces a much smaller indentation impression on the beam and undesired torsional displacements can easily be prevented. The alignment of the wedge was done by means of a custom-built goniometer and by performing shallow indentations into the bulk material which were subsequently analyzed by light microscopy.
Constant displacement rates of 8 and 30 nm/s were applied in the experiments. By superimposing a harmonic displacement with a constant amplitude of 2 nm to the applied load, the harmonic contact stiffness was measured continuously throughout the bending tests. Additionally, several partial unloading segments with an unloading rate of 50 nm/s were included at a later stage of the experiment. This was done to compare the stiffness obtained from dynamic testing with the one calculated from the slope of the partial unloading segments.
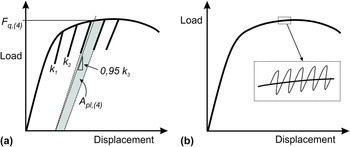
In Fig. 2, schematic load–displacement curves are presented to describe the evaluation of the experiments. According to the ASTM standard E 1820 (Ref. 16) for the measurement of the fracture toughness in terms of the J-integral, several characteristic steps are required.
Schematic load–displacement curves to describe the applied J-integral testing procedure: (a) conventional method with partial unloading segments to determine the contact stiffness k i and the relevant quantities A pl,(i) and F q,(i) and (b) new method using the dynamic stiffness which allows a continuous recording of the contact stiffness.

The approach conventionally applied for macroscopic testing is shown in Fig. 2(a). Partial unloading segments are used after specific displacement intervals to determine the contact stiffness from which the corresponding beam stiffness is then calculated. A decreasing stiffness indicates crack growth. By doing so the quantity A pl characterizing the amount of plastic energy stored in the sample can be calculated. Furthermore, for each cycle i the current force F q is calculated. This macroscopic procedure is also applicable at the microscale. However, as certain geometrical requirements from the macroscopic standard cannot be fulfilled, the measured dimensions are considered as conditional dimensions and are denoted by the subscript “q”. Figure 2(b) shows the newly developed procedure using harmonic oscillations with the so-called continuous stiffness method of the nanoindenter, to continuously derive the contact stiffness during loading. In that way, the J-integral is calculated according to the same procedure presented in Fig. 2(a). Yet, this time the J-integral is evaluated continuously allowing for a continuous record of crack resistance curves (R-curves) for materials showing plasticity during fracture.
C. Measurement of the fracture toughness by the J-integral
The J-integral consists of an elastic and a plastic part. 16 In the following equation the J-integral determination is shown for an isotropic material:
 $$\eqalignb{ & {J_{\left( i \right)}} = {J_{{\rm{el}},\left( i \right)}} + {J_{{\rm{pl}},\left( i \right)}} \cr & = {{{{\left( {{K_{Iq,(i)}}} \right)}^2}\left( {1 - {\nu ^2}} \right)} \over E} + \left[ {{J_{{\rm{pl}},\left( {i - 1} \right)}} + {{\eta \left( {{A_{{\rm{pl}},(i)}} - {A_{{\rm{pl}},(i - 1)}}} \right)} \over {B\left( {W - {a_{(i - 1)}}} \right)}}} \right] \cr & \left[ {1 - {{{a_{(i)}} - {a_{(i - 1)}}} \over {\left( {W - {a_{(i - 1)}}} \right)}}} \right]\quad . \cr}$$
For the elastic part, the elastic constants of the material must be known. Due to the strong elastic anisotropy of NiAl, Reference Rusović and Warlimont17 the elastic constants and the cantilever orientation have to be incorporated into J el. By means of the theory of a linear-elastic stress field around a crack tip according to Sih and Liebowitz Reference Sih and Liebowitz18 and by rotating the basis vectors into the coordinate system of the hard orientation as shown in Fig. 1, the elastic anisotropy as well as the cantilever orientation are accounted for. For the assumption of a plane-strain state, E/(1 − ν2) was therefore calculated to 195 GPa. The stress intensity factor according to LEFM is calculated by using the following equation taken from the ASTM standard E 399 (Ref. 19):
 $${K_{{\rm{Iq}},(i)}} = {{{F_{{\rm{q}},(i)}}L} \over {B{W^{{3 \mathord{\left/ {\vphantom {3 2}} \right. \kern-\nulldelimiterspace} 2}}}}} \cdot f\left( {{{{a_{(i)}}} \over W}} \right)\quad ,$$
where F q,(i) is the load determined by a line intersection method with a lower slope in each cycle as outlined in Fig. 2(a). For the method using harmonic oscillations, this construction is not necessary as the stiffness is measured continuously. The geometry factor f was determined for a rectangular beam geometry having a straight notch by means of finite element (FE) modeling by Iqbal et al. Reference Iqbal, Ast, Göken and Durst15 :
 $$\!f\left( {{a \mathord{\left/ {\vphantom {a W}} \right. \kern-\nulldelimiterspace} W}} \right) = 1.52 + 24.18 \cdot \left( {{a \mathord{\left/ {\vphantom {a W}} \right. \kern-\nulldelimiterspace} W}} \right) - 48.42 \cdot {\left( {{a \mathord{\left/ {\vphantom {a W}} \right. \kern-\nulldelimiterspace} W}} \right)^2} + 77.61 \cdot {\left( {{a \mathord{\left/ {\vphantom {a W}} \right. \kern-\nulldelimiterspace} W}} \right)^3}\quad .$$
Using the dynamic loading approach with harmonic oscillations additionally allows the derivation of the beam stiffness throughout the experiment. By means of FE modeling, this stiffness can be converted into a corresponding crack length a (i) supposing that the crack front is straight. A decrease in stiffness can then be attributed to crack growth. FE calculations as shown elsewhere Reference Ast, Przybilla, Maier, Durst and Göken11 help in understanding the correlation between the stiffness of a notched cantilever with the same dimensions as in the experiments and crack growth. For those FE simulations, a 2D model was applied with linear-elastic material behavior. By plotting the normalized stiffness as a function of a/W ratio, the correlation between the decrease in stiffness and the crack length was determined.
To compare methods from LEFM with elastic–plastic fracture mechanics (EPFM), the fracture toughness according to LEFM K Iq,LEFM was calculated using Eq. (2). Yet, for that case F q was set to F max and crack growth was not considered, meaning that the geometry factor was calculated for a constant ratio a 0/W. For the calculation of the plastic part of the J-integral J pl required for Eq. (1), the area underneath the curve A pl—as described schematically in Fig. 2(a) for the method with partial unloading segments—must be determined. For the approach using harmonic oscillations, this quantity is calculated incrementally using two subsequent force data points and their corresponding stiffness values. The constant η was set to two for the assumption of a plane-strain state. 16
By calculating the J-integral continuously and by assigning an increase in crack length to the change in stiffness, a continuous crack resistance curve (R-curve) can be generated. From such a curve a critical J-integral J q at the onset of stable crack propagation is determined, as will be explained in more detail in the results chapter. Using the following equation, the fracture toughness is then calculated as:
 $${K_{{\rm{Iq}},J}} = \sqrt {{{{J_{\rm{q}}}E} \over {\left( {1 - {\nu ^2}} \right)}}} \quad .$$
III. RESULTS
A. Hard oriented stoichiometric NiAl
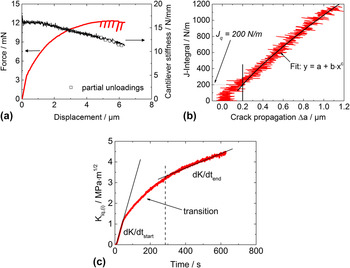
The results of an experiment on a hard oriented NiAl crystal are shown in Fig. 3(a). Corrections of the displacement and the stiffness were applied as the wedge indenter penetrates the cantilever surface. Further details on those corrections are found in the Appendix A(1). Initially, there is a linear elastic loading segment followed by a remarkable hardening regime. The experiment is stopped at a bending displacement of ∼6 µm. The stiffness of the cantilever stays constant over the first 1.5 µm of displacement, which is even further than that for the elastic loading part. Then it continuously drops during the course of the experiment indicating stable crack propagation. The fact that a drop in stiffness is linked to crack propagation was confirmed by testing un-notched cantilevers. These cantilevers showed a constant stiffness level in both the elastic and plastic parts of the experiment. Further details are presented in the Appendix A(2).
Fracture behavior of stoichiometric NiAl in the hard orientation: (a) load–displacement curve and cantilever stiffness, (b) crack resistance curve with fit for the determination of J q, and (c) stress intensity factor as a function of time for the determination of the effective loading rate.

Toward the end of the test six partial unloading segments were performed. The corresponding cantilever stiffnesses from calculations are illustrated as hollow square symbols in Fig. 3(a). The aim was to verify the stiffness as measured by the dynamic method. An excellent agreement was found between the two methods, therefore validating the dynamic stiffness approach.
Using Eq. (1) for the determination of the J-integral and the FE model to calculate crack growth, continuous crack resistance curves can be plotted as shown in Fig. 3(b). A constant initial cantilever stiffness means that the crack length stays constant and the J-integral rises vertically in the beginning due to the plastic component. Once the stiffness decreases, the resistance to crack propagation rises and the crack propagates stably. To evaluate the fracture toughness from such an experiment, it is important to monitor the stress intensity factor rate (in the following denominated as loading rate) dK/dt which is shown in Fig. 3(c). A change of the loading rate can have a decisive influence on the fracture toughness in NiAl single crystals. Reference Ebrahimi and Shrivastava20 In the presented experiment, the imposed displacement rate of 8 nm/s is translated into an initial effective loading rate of 0.029 MPa m1/2/s. Yet, with ongoing plastic deformation and the evolution of a plastic zone at the crack tip, the stress intensity factor consequently decreases, leading to a gradually lower loading rate. After nearly 300 s [dashed line in Fig. 3(c)], the loading rate stays nearly constant at approximately 0.003 MPa m1/2/s. Only data in this section were chosen to perform the fit in Fig. 3(b), which is adapted from the regulations in the relevant ASTM standard. 16
By choosing a critical crack length as Δa = 0.2 µm for stable crack propagation a critical J-integral J q can be calculated from the intersection point as is additionally illustrated in Fig. 3(b). The introduced critical crack length is adapted from macroscale testing where a lower exclusion line is constructed to exclude crack propagation data that is due to crack tip blunting. 16 As the exclusion line is drawn at a value of 0.15 mm at the macroscale, it was necessary to define a reasonable criterion for stable crack propagation at the microscale. It is supposed that the crack tip blunting regime is finished after a crack propagation of 0.2 µm. This is when the crack resistance starts to increase as depicted by the fit shown in Fig. 3(b). For the four tests on stoichiometric NiAl with similar loading rate, a J-integral of 213 ± 34 N/m was determined, which was then converted into a fracture toughness of 6.4 ± 0.5 MPa m1/2 according to Eq. (4).
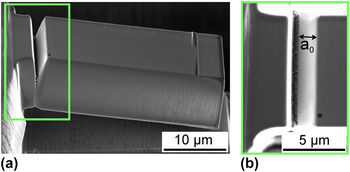
In Fig. 4, SE-micrographs of a fractured stoichiometric NiAl cantilever are shown. The beam was deflected quite strongly in the experiment, due to plastic deformation at the crack tip. In the magnified view in Fig. 4(b) the straight initial crack length can be noticed as well as the homogeneous crack propagation throughout the experiment.
SE-micrographs of a stoichiometric NiAl cantilever after testing: (a) overview and (b) magnified view from the top onto the homogeneously propagated crack.

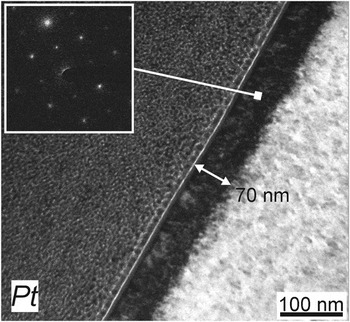
With respect to the often discussed and important issue of FIB-damage at the crack tip, the new approach for fracture toughness evaluation described here is also advantageous. As the fracture toughness is determined after a crack propagation of 0.2 µm, the crack tip has already passed the FIB-damaged zone. This was verified by transmission electron microscopy (TEM) investigations, as shown in Fig. 5. A piece of the bulk sample was exposed to 30 kV Ga-ions in normal incidence using a current of 1 nA for 15 min. This was done to reproduce the notching procedure in the cantilevers. Then Pt was deposited onto the top and a TEM lamella was prepared. It can be noted that the damaged zone at the surface is approximately 70 nm thick and at least partially crystalline according to the diffraction pattern. It is therefore ensured that the fracture toughness in the NiAl samples is determined once the crack is in a FIB-unaffected region.
Bright-field TEM-micrograph of the surface-near area in NiAl after 30 kV FIB exposure. The FIB-affected zone was determined to be around 70 nm and showed crystallinity according to the inserted selected area diffraction pattern.

B. Influence of Fe on the fracture toughness of NiAl
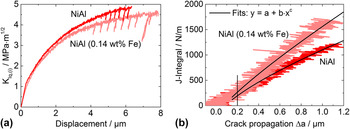
In addition to stoichiometric NiAl, also a single crystal containing a small amount of Fe was investigated. A comparison between two cantilevers of the two investigated materials loaded with the same displacement rate is shown in Fig. 6(a). The stress intensity factor from LEFM corrected for the actual crack length and calculated using Eq. (2) is again shown. Initially, the two materials demonstrate the same behavior. However, at larger displacements the stoichiometric NiAl shows a higher stress intensity factor. This is due to a larger effective crack length at a certain displacement for stoichiometric NiAl than for the Fe-containing NiAl crystal. This circumstance becomes even clearer when plotting the J-integral as shown in Fig. 6(b).
(a) Stress intensity factors as a function of the displacement for the two compared materials and (b) continuous crack resistance curves with fits for the determination of J q.

A more pronounced crack resistance behavior for NiAl–Fe compared to stoichiometric NiAl is noticeable. Initially, the two curves overlap, indicating that the crack tip blunting behavior is similar. Once the crack grows, the resistance to propagation in the Fe-containing NiAl sample is considerably higher. From again four samples fractured with the same loading rate as for the stoichiometric NiAl sample, a J-integral of 257 ± 39 N/m and a fracture toughness of 7.1 ± 0.5 MPa m1/2 were determined.
IV. DISCUSSION
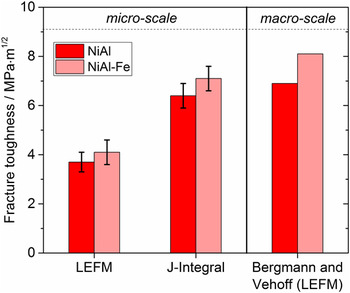
An overview of the data for the two materials with a 〈011〉{100} crack system is provided in Fig. 7. The comparison of the two different methods (LEFM and EPFM) at the microscale shows a clear difference. This is because the LEFM does not account for plasticity at the crack tip. Consequently by considering the plastic deformation at the crack tip by means of the J-integral technique, a notably higher fracture toughness is determined. When comparing the obtained EPFM values at the microscale with the ones from macroscopic four-point bend specimens investigated by Bergmann and Vehoff, Reference Bergmann and Vehoff9 a good agreement is found. As the microcantilevers were prepared from the same macroscopic single crystals investigated in their work, Reference Bergmann and Vehoff9 the chemical composition and the microstructure are identical. Since Bergmann and Vehoff used large single crystals, they could rely on the standard LEFM approach without using the J-integral technique. On the local scale, the EPFM has to be applied as certain requirements from LEFM cannot be fulfilled any more due to enhanced plasticity around the crack tip. However, a standard evaluation procedure for small-scale fracture tests does not exist so far. This makes it difficult not only to evaluate experiments but also to compare data from different length scales.
Fracture toughness data from microcantilever testing compared to literature data from macroscopic bend tests from Bergmann and Vehoff. Reference Bergmann and Vehoff9 The error bars are from four experiments in each material.

Further, the fracture toughness determined by the proposed method is not only remarkably close to macroscopic data but also reflects the alloying effect of NiAl with Fe. The approach described in this paper might therefore help to establish a standard method for small-scale fracture toughness testing.
It is assumed that similar effects, as already discussed by Darolia et al., Reference Darolia, Lahrman and Field21 are responsible for the increase of the ductility due to Fe. These are first of all the interaction of Fe with interstitial impurities such as O, C, N, and S. These elements are known to have a detrimental influence on the room temperature toughness of NiAl. By trapping clusters of interstitials around the substitutional iron atoms in the lattice, the dislocation mobility is enhanced, leading to an increased ductility and therefore to a slightly higher fracture toughness. Also it is likely that stoichiometric effects influence the fracture behavior as vacancies are created due to a reduction in the Ni content. Reference Bradley and Taylor22 The interaction of the substitutional Fe atoms with the inherent point defect concentration might also lead to an increase in ductility. With respect to the higher crack resistance behavior of the NiAl–Fe sample, it is suggested that this enhanced ductility leads to a more efficient shielding of the crack tip.
According to Irwin, Reference Irwin23 the size of the plastic zone r pl around the crack tip in the case of mode I loading conditions and a plane-strain state can be calculated as follows:
 $${r_{{\rm{pl}}}} = {1 \over {3\pi }}{\left( {{{{K_{\rm{I}}}} \over {{\sigma _{\rm{y}}}}}} \right)^2}\quad .$$
Taking into account the macroscopic yield strength σy of hard oriented NiAl single crystals of around 1400 MPa Reference Noebe, Bowman and Nathal24 and the fracture toughness shown in Fig. 7, the plastic zone size at the onset of stable crack propagation can be estimated. It was calculated as approximately 2.2 µm for stoichiometric NiAl and approximately 2.8 µm for the Fe-containing NiAl, if the same yield strength is assumed. Even though the plastic zone size is too large to fulfill the requirements listed in the conservative guidelines for J-integral testing of macroscopic samples according to the ASTM standard, 16 the plastic zone size here is significantly smaller than the sample dimensions. Furthermore, the actual yield strength at the crack tip could also be locally increased due to strain gradients at the crack tip leading to an even smaller plastic zone. Reference Iqbal, Ast, Göken and Durst15,Reference Wei and Hutchinson25 Moreover, Iqbal et al. Reference Iqbal, Ast, Göken and Durst15 studied specimen size effects on the stress state in single-crystalline NiAl microcantilevers. As their specimen thicknesses were found to be in the transition regime between plane stress and plane strain, they calculated the ratio K Ic,plane-stress/K Ic,plane-strain according to the Broek and Vlieger Reference Broek and Vlieger26 model. For the investigated hard orientation in NiAl, they could show that the resulting difference in fracture toughness was negligible even though the corresponding plastic zone sizes differed by a factor of two. The reason for this was the low fracture strain of NiAl and the high yield strength. It is therefore concluded that the fracture toughness obtained by our new approach is not strongly affected by the small specimen size and the stress state. Current investigations aim at studying plastic deformation in cantilever experiments in more detail to obtain a better understanding of the local elastic–plastic fracture behavior. In single crystals and especially at the microscale, the term plastic zone as known from macroscopic testing of polycrystals is no longer useful. The dislocation distribution and its interaction with the crack tip must be studied more thoroughly.
V. CONCLUSIONS
The local fracture behavior of NiAl, which showed a reasonable amount of plasticity, was investigated by microcantilever experiments. For that purpose the J-integral technique was further developed for the microscale by taking advantage of a continuous stiffness signal during nanoindentation experiments. In that way, continuous crack resistance curves were recorded which allow a precise determination of the fracture toughness at a given loading rate. The FIB-affected zone for the NiAl crystals was investigated by TEM and it could be shown that the thickness is around 70 nm. Consequently the fracture toughness data at the onset of stable crack propagation is not influenced by any damaged material. By adding low amounts of Fe to the single crystals, the fracture toughness increased slightly and the R-curve behavior became more pronounced. Both findings are in good agreement with macroscopic tests of the same material. As plasticity influences decisively the fracture behavior at the local scale, LEFM evaluations were no longer accurate. However, the fracture toughness calculated by means of the J-integral technique, which accounts for plastic deformation, showed a good agreement with literature data. This was explained by the plastic zone size which was calculated to be smaller than the cantilever dimensions. Therefore, a significant size effect was neither expected nor found.
ACKNOWLEDGMENTS
The authors gratefully acknowledge the funding of the German Research Council (DFG), which within the framework of its ‘Excellence Initiative’ supports the cluster of Excellence ‘Engineering of Advanced Materials’ at the University of Erlangen-Nürnberg. Lisa Freund and Benedikt Schönberger are gratefully acknowledged for their support with the TEM-analysis and sample preparation.
APPENDIX
A(1). Data correction for the penetration of the indenter
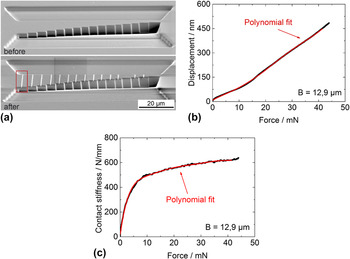
Due to the use of a sharp wedge-type indenter, the measured data needs to be corrected for indentations made into the cantilevers. As the correction for the indentation depends on the cantilever width B which was not constant for all samples tested, several imprints were performed into a FIB-milled H-bar of variable width which is shown in Fig. A1(a). The resulting “displacement-load” and “contact stiffness-load” responses for an imprint in this bar at a width of 12.9 µm (red rectangle), which corresponds to one of the used cantilever widths in this study, are depicted in Figs. A1(b) and A1(c), respectively. It is assumed that the measured displacement is the sum of the bending displacement and the indentation into the cantilever. From those reference indentations into the bulk the indentation depth at a given load can be measured and described by a polynomial fit function. The indentation depth is then subtracted from the measured displacement in the bending experiment. Similar adjustments are needed for the correction of the stiffness. The experimentally measured harmonic stiffness S measured is a function of the contact stiffness S imprint due to the imprint and of the requested bending stiffness of the cantilever S cantilever. During the indentation of the bar, the stiffness is continuously recorded and the data are again fitted. As demonstrated by Kupka and Lilleodden, Reference Kupka and Lilleodden27 the bending stiffness of the cantilever can be calculated by applying the model of two springs connected in series leading to the following:
 $${S_{{\rm{cantilever}}}} = {{{S_{{\rm{imprint}}}} - {S_{{\rm{measured}}}}} \over {{S_{{\rm{imprint}}}} \cdot {S_{{\rm{measured}}}}}}\quad .$$
(a) SE-micrographs of an H-bar with varying width in bulk single-crystalline NiAl before and after performing the indentations with the sharp wedge indenter; the red rectangle indicates the imprint with B = 12.9 µm for which respective curves are plotted in (b) and (c).

A(2). Stiffness signal of an un-notched cantilever
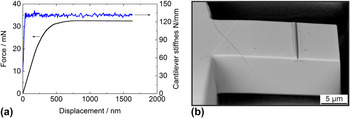
To attribute a decrease in cantilever stiffness purely to crack growth and consequently a reduction in cross-section, bending experiments were performed on un-notched cantilevers. These investigations were performed on single-crystalline tungsten. The force-displacement data as well as the stiffness evolution during elastic–plastic deformation are shown in Fig. A2(a).
(a) Corrected force–displacement curve and cantilever stiffness of an un-notched beam for which a SE-micrograph after testing is shown in (b).

The stiffness stays constant throughout the whole experiment. Initially there is a linear-elastic loading segment, followed by a pronounced hardening regime. Finally, a steady-state deformation behavior after a displacement of ∼700 nm is reached, where the applied force stays constant. The SEM image in Fig. A2(b) shows the sample after testing. An imprint of the sharp wedge indenter as well as distinct slip traces are visible on the surfaces of the beam.