

Introduction
The UK has long led the world in wellbeing policy-making and is still at the forefront of international developments. The 2004 Care Act enshrined wellbeing as a goal for local councils; there has been a What Works Centre for Wellbeing since 2015 that gathers and widely disseminates evidence on what can be done to increase wellbeing; the 2018 UK Treasury's Green Book openly accepted wellbeing as the valid object for new policies; and the UK has large charities that openly orient themselves on wellbeing, including Action for Happiness (with a million sympathizers) and various Happy City initiatives.
Despite such initiatives, measures of wellbeing are not yet routinely used to evaluate national policy, nor how our children are doing in school or whether a local housing policy is successful. There is still a long tail of workplaces with both low wellbeing and low productivity that show little sign of improving practices, and most departments and government entities have more specific goals than wellbeing, such as exam results, physical health or numbers of police officers. There is also ideological resistance to wellbeing: a suspicion that the pursuit of happiness is futile and childish. Wellbeing is thus not yet truly central to our thinking about society, nor our decision processes locally or nationally.
This article sketches the main reasons to set wellbeing at the heart of decision-making and maps out a way forward. No single individual or group owns this agenda, and we are hence mostly describing the economics part of a wider societal movement that has been around for centuries and has gained in impetus in recent decades. We focus throughout on the UK, but believe the general arguments apply to other countries, though we recognize that there are important wellbeing initiatives in countries like New Zealand, France and Italy.
A wellbeing orientation would lead to major changes in policy and culture. At present, the ‘low-hanging fruit’ in terms of wellbeing policies seems to lie in the areas of mental health and social relations, with increased emotional-skills teaching and relationship coaching for high-risk groups as key examples. The Incredible Years parenting programme is a promising intervention based on both young children with conduct problems and their parents. The Healthy Minds curriculum, which teaches life skills, has been positively evaluated for the UK and might well soon become widespread.Footnote 1
We would like to move to a system wherein councils, firms, households and institutions learn from the best practices around the country and beyond. This requires both an experimental mind-set and institutions that gather the evidence on what has worked. In the medium run, we thus expect a flood of experimentation by individuals, firms, communities and departments in all areas of life to see what improves wellbeing. Information on successful and failed examples can be collected by the What Works Centre for Wellbeing (https://whatworkswellbeing.org), as well as other institutions that make it available to others.
A useful model for this kind of learning is the Imperial system of Botanical Gardens of the eighteenth and nineteenth centuries that collected new plants from all over the world. The Botanical Gardens made these available to local farmers around the Commonwealth to experiment with. Kew Gardens, the central hub in London, then collected information on where the experimentation was (un)successful and disseminated both the plants and the knowledge of where and when they would be useful around the smaller botanical gardens. This combination of decentralized experimentation and centralized knowledge of examples and experiences is also a good general model for wellbeing, particularly when it comes to best practice in major public services like education and health that can be expected to be around for a long time in the future and thus lend themselves to gradual optimization.
In the longer run, we might well adopt the lessons of other countries with high wellbeing. We could, for instance, end up organizing our cities the way the Danes do, celebrating our lives and communities in the manner of the Costa Ricans and embracing the positive psychology lessons of the primary school system in South Australia.
We do not envisage that this agenda will be taken up in a quick revolution, but rather that it will follow the example of the use of quality-adjusted life-years (QALYs) in health. Some 20–30 years ago, the UK and other countries had institutions that openly adopted measures of QALYs based on surveys of respondents who had to evaluate hypothetical health states. Those measures then became the basis for judging the effectiveness of new medicines and health procedures. This gradually focused the minds of policy-makers and health practitioners around the world on what ‘health’ was and how to make trade-offs in the health budget.
The original QALY measures became subject to challenge and improvement in a slow evolutionary process, for instance leading to the EuroQol tool – a five-dimensional instrument to measure and value quality of life-related health. Twenty years on, in Whitehall there now exist agreements between departments on how much a QALY is worth and how many QALYs are gained from various interventions (e.g., reducing air pollution). Yet, there are still large sections of the health service that do not have a QALY orientation, and there remain inconsistencies in the system.
The experience of the QALY shows that measurement does not need to be perfect to be useful: what is important is that the measures adopted capture a large part of the concept they were designed to capture (i.e., health) so as to move the policy dial in the right direction. The system as a whole then learns the pros and cons of this measure, leading to improved measures and procedures. This takes decades, but there is progress in that new health procedures do have to prove their claims of usefulness. This has made the system more rational.
Wellbeing-adjusted life-tears (WELLBYs) expand the QALY idea to the whole of life, not just health. It is hence a tool for judging the trade-offs between large government programmes, as well as the trade-offs between major choices by firms and households. Knowledge of what increases wellbeing can be used in programme design and the everyday operation of the workplace.
This article proceeds as follows. We shortly discuss the history of wellbeing as the goal of government and then the main measures on offer to operationalize this goal. Based on our preferred measure of life satisfaction, we then use the large literature on this measure to give an idea as to the changes in policy priorities that might occur if we took wellbeing more seriously. Next, we sketch how we might synthesize the lessons of the wellbeing literature into actual estimates of how wellbeing depends on particular policy instruments. This leads to a brief discussion of cost–effectiveness methodology that could be used to determine policy priorities in Whitehall. We end with reflections on the next steps that would be needed.
Brief history
Preamble
The general study of happiness has deep philosophical roots and is part of the classical Western discussions surrounding the ‘good life’, the Greek concept of eudemonia, and also has resonance in non-Western streams of thought such as Buddhism. We limit ourselves here to a brief look at what has happened in the last few centuries in Anglo-Saxon thought and in economics, which dominates the world of policy.
The main take-away argument is that over the last 300 years it has become completely normal, in the West, to assume that the nation state should orient itself towards improving the happiness of the population, loosely understood as an evaluation of the inner experiences of individuals. The only question has been whether it is feasible and sensible to truly establish a system to this end, or whether instead to rely more on proxy outcomes like economic growth and physical health as the goals for government policy.
On the issue of language: because this has been such a long tradition, different words have been used over time and the meanings of words differ from period to period and scholar to scholar. We will thus use the words ‘happiness’, ‘life satisfaction’ and ‘wellbeing’ interchangeably, but will be more precise in how they subtly differ when we talk about measurement and cost–effectiveness. Here, we are more interested in giving a general account of the history of the idea that governments should care about the inner lives of individuals as judged by individuals themselves.
Anglo-Saxon thought and the development of metrics
In the long Anglo-Saxon tradition of debates over happiness, this was often considered as the goal of life and of society itself. Prominent early contributors here were eighteenth- and nineteenth-century philosophers like Jeremy Bentham, John Stuart Mill and Francis Edgeworth. Jeremy Bentham famously advocated that societies should orient themselves towards the ‘greatest happiness of the greatest number’ (in ‘A fragment on Government’, 1776). Similarly, John Locke argued in ‘Essays Concerning Human Understanding’ (1689) that the highest perfection of intellectual nature lies in a careful and constant pursuit of true and solid happiness. The United States Declaration of Independence of 1776 reflects that tradition by speaking of ‘Life, Liberty and the pursuit of happiness’ as inalienable rights.
Some nineteenth-century utilitarians even made attempts to measure the effects of direct pleasurable or negative inputs on happiness. Long discussions were had in the nineteenth century about ‘ideal utilitarianism’, ‘hedonistic value theory’ and other forms of utilitarianism that took the internal experiences of humans as central to the goal of society. Concurrently, early psychophysicists started experimenting with stimulus–response models of outcomes (such as happiness) and, for instance, formulated the Weber–Fechner law of response–stimulus, essentially postulating a logarithmic relationship between a stimulus (say, pressure or income) and the subsequent psychological response (say, pain or happiness). The logarithmic function is still the dominant functional form today to describe the relation between income and happiness, simply because it fits the data best.
In the twentieth century, the main influence came in the form of the measurement tools used, and in particular the development of the Likert scale (1932, 1934) whereby people are asked to rate a psychological outcome on an ordered scale with some maximum and some minimum scores that are given emotive labels (like ‘completely satisfied’, ‘very unhappy’ or ‘very good’). The Likert scale remains one of the dominant measurement devices in use today, although there are now a number of versions and new distinctions such as current mood versus happiness versus mental health.
The other main measurement tool developed in the twentieth century that is still currently in wide use is an aggregate of underlying items, such as a question module leading to an index. There is no dominant index, however, merely a vast wilderness of different ones. A prominent early example is the General Health Questionnaire (GHQ-12), developed by Goldberg, which poses 12 questions to respondents, including whether they feel happy, which researchers then aggregate and sometimes interpret as an alternative measure of happiness (e.g., Clark & Oswald, Reference Clark and Oswald1994; see also Goldberg et al., Reference Goldberg, Gater, Sartorius, Ustun, Piccinelli, Gureje and Rutter1997). The ‘Satisfaction with Life’ scale developed by Diener et al. (Reference Diener, Emmons, Larsen and Griffin1985) has been one of the most widely used in psychology, though not in economics. The Quality-of-Life Scale developed by Cummins et al. (Reference Cummins, McCabe, Romeo and Gullone1994) is another.
At the national level, there are even more indices attempting to measure happiness or wellbeing. Amongst hundreds, we can mention the Human Development Index, the Bhutan Happiness Index, the Macau Quality of Life Reports and the Gallup Wellbeing Index. These are based on aggregations of a set of characteristics that are deemed desirable for individuals or countries, such as life expectancy and literacy, and are often labelled as happiness. There are now a number of recurrent publications detailing the levels of ‘happiness’ for nearly all countries in the world, such as the World Happiness Report (2013, 2018). Stiglitz et al. (Reference Stiglitz, Sen and Fitoussi2009) document many such indices relating to quality of life, recommending that users should pick the index that best fits their purpose, but singling out Life Satisfaction as the most useful for those looking for a summary measure.
Although the fundamental contributions to happiness measurement came from previous generations of psychologists and sociologists, there are also pioneers in the current generations. Daniel Kahneman, for instance, has been pivotal in the development of the Day Reconstruction Method, wherein happiness is measured as an aggregate of measures of mood taken throughout the day (Kahneman et al., Reference Kahneman, Krueger, Schkade, Schwarz and Stone2004). This method and its offspring have not been widely taken-up yet, as they are expensive (the method requires individuals to answer many questions – potentially hundreds – about the previous day), suffer from very selective non-response (individuals might not mention episodes they are embarrassed about) and beget unlikely outcomes (i.e., unemployment does not make you unhappy). Nevertheless, they represent one of the few real innovations in happiness measurement of recent decades.Footnote 2
A brief history of happiness economics
From a long-run perspective, the study of happiness has been innate to economics from its conception. Adam Smith in his ‘The Theory of Moral Sentiments’ (1759) already remarked that individuals have a propensity to care about the happiness of others, thereby elevating happiness to be the goal of life. He was arguably a utilitarian in the limited sense of advocating that people should care for the happiness of the groups they belonged to, as witnessed by the quote:
…the care of the universal happiness of all rational and sensible beings, is the business of God and not of man. To man is allotted a much humbler department, but one much more suitable to the weakness of his powers, and to the narrowness of his comprehension: the care of his own happiness, of that of his family, his friends, his country.
Of course, Smith said a lot more about the duties of individuals and governments, but this quote nicely illustrates the basic position that was popular in economics throughout the next 150 years, with classic utilitarians such as Bentham and Edgeworth advocating much the same goals (i.e., that economists should measure what it is that people enjoy and base their theories and policy prescriptions on the principle of the maximization of the happiness of individuals or some relevant group as a whole). This is also exactly the tradition we follow in this article (i.e., the notion that the government should care about the happiness of its citizens).Footnote 3
This inclusion of happiness in the main thought processes of economists changed with the marginalist revolution of the late nineteenth century and the subsequent move away from the measurement of individual psychology and towards the axiomatization of preferences. This counter-movement had a strong proponent in Lionel Robbins, who boldly declared that economists should not be involved in questions of ethics and should leave the measurement of the inner lives of people to others, doubting that it could ever be carried out in a scientific way. In his Reference Robbins1932 book on the significance of economics, he accepts the implication that economics ‘is incapable of deciding as between the desirability of different ends. It is fundamentally distinct from Ethics’ (p. 152). People were acknowledged to have feelings and desires, but it was deemed outside of the realm of economics to take their actual feelings and desires as valuable outcomes.
Despite prominent dissenters throughout the twentieth century (including Ragnar FrischFootnote 4 and Jan Tinbergen, the first Nobel Prize winners in economics), Robbins’ position was more or less dominant until relatively recently. Economists in diverse fields simply assumed the shape of the utility function that was acceptable amongst their peers and declared utility immeasurable by any other means than their own introspection or consumer choices, and even those choices merely identified preference orderings and not any absolute measure of utility that could meaningfully be used by a policy-maker in order to base trade-offs between people. As Wansbeek and Kapteyn (Reference Wansbeek and Kapteyn1983), both PhD students of Bernard Van Praag, succinctly said during this period:
Utility seems to be to economists what the Lord is to theologians. Economists talk about utility all the time, but seem not to have hope of ever observing it this side of heaven. In micro-economic theory, almost any model is built on utility functions of some kind. In empirical work little attempt is made to measure this all-pervasive concept. The concept is considered to be so esoteric as to defy direct measurement by mortals. Still, in a different role, viz. of non-economists, the same mortals are the sole possessors of utility functions and they are able to do incredible things with it … As a result, there is a giant gap between theory and empirical work.
To be sure, throughout the 1970s and 1980s, there were some lone contributions of the odd economist to measure utility, such as Easterlin (Reference Easterlin, David and Weber1974), Scitovsky (Reference Scitovsky1975) and Layard (Reference Layard1980), but they had little influence on the profession until recently.
Only in the 1990s did the study of happiness-as-a-measure-of-utility amongst economists start to take off, with the main early interest being in the question of whether economic growth increases happiness. Amongst psychologists and sociologists, it had long been argued that money and happiness were but weakly related (e.g., Cantril, Reference Cantril1965), but such insights did not permeate economics.
The main initial impetus for happiness economics came from Richard Easterlin. In his 1974 piece called ‘Does Economic Growth Improve the Human Lot’, where he acknowledged earlier thinkers who had also advocated similar things (such as Moses Abramovitz, Reference Abramovitz, Abramovitz, Alchian, Arrow and A1959), he postulated that economic growth only brought greater average happiness to a country up to a fairly low level of income, after which there was almost no aggregate happiness benefit from further economic growth. He explicitly equated happiness with the goal of society and thus connected it to the economic concept of utility (i.e., ‘the thing one would on reflection want to maximise’).
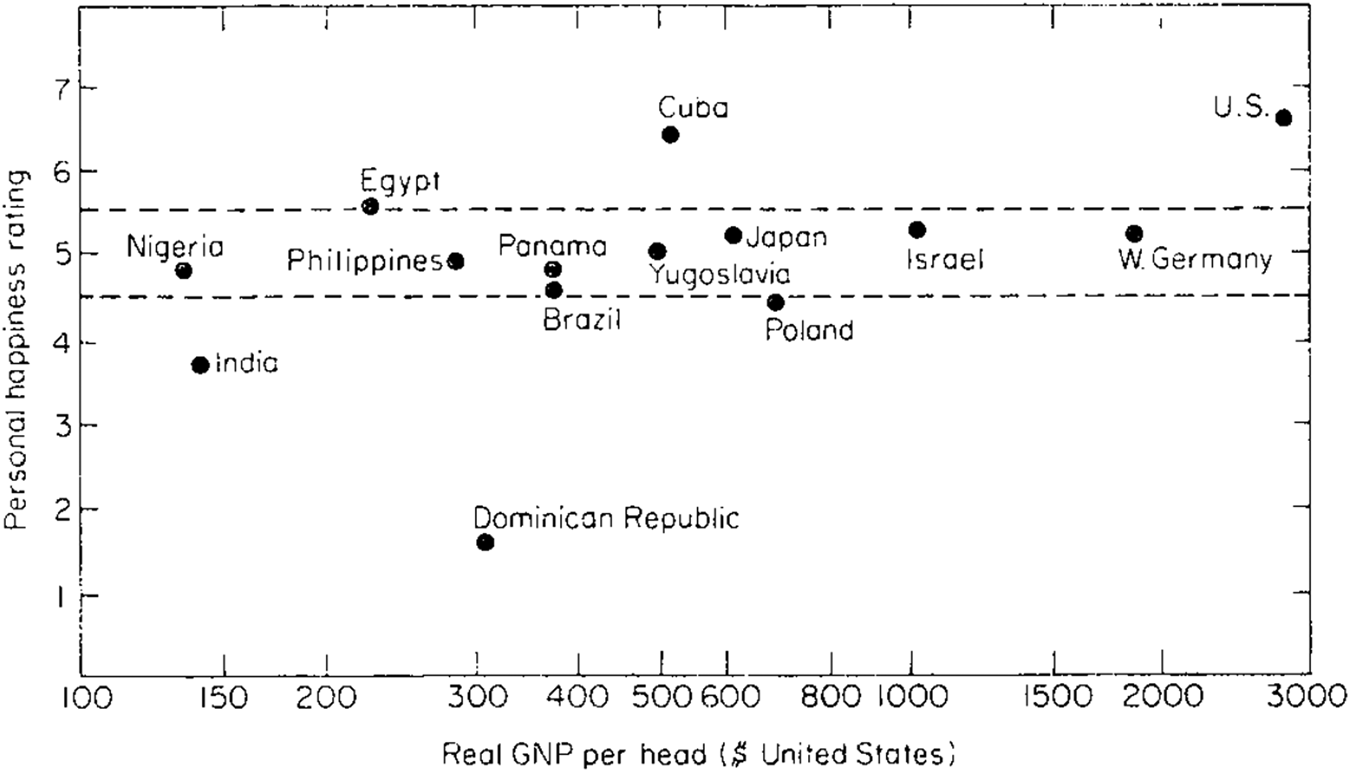
Easterlin's figure 1 was meant to show that there were poor and rich countries with relatively high levels of happiness – such as Nigeria and West Germany – that were in the same average happiness band (dashed lines in Figure 1). It also shows a positive relation between happiness and average gross domestic product (GDP) per capita, where we can mention that in later data the cross-section relation looks much stronger than the weak relation you see in Figure 1. That positive cross-sectional relationship should be contrasted with his table 8, which shows that, after a happiness increase following the end of the Second World War, there was no further happiness increase in the USA from 1956 to 1970 despite a near 50% increase in GDP in that same period.
Personal happiness rating and gross national product (GNP) per head, 14 countries, ca. 1960. Source: Easterlin (Reference Easterlin, David and Weber1974).

The fact that economic growth no longer begets much noticeable happiness increase in rich countries has since been confirmed many times for many rich countries, including many Organisation for Economic Co-operation and Development (OECD) countries. There have, of course, been counter-claims and important nuances, such as the importance of comparisons with neighbouring countries and the realization that higher aggregate incomes do often feed through into safety nets that buy happiness. Yet, it remains the case that the USA has witnessed economic growth without happiness growth for the last 60 years, with little indication that the happiness growth in some other rich countries has had much to do with income. The UK, for instance, has seen its life satisfaction increase in the last 10 years despite the Global Financial Crisis. So Easterlin's main contention – later called the Easterlin Paradox – and his main explanation have stood the test of time, with the remaining controversy relating to the degree to which it holds.
In his 1974 paper, Easterlin puts forward a mathematical theory of this finding, drawing on Duesenberry and others, wherein he assigns central roles to the importance of relative income and to the adaptation of tastes. His final conclusion is thus that
economic growth does not raise a society to some ultimate state of plenty. Rather, the growth process itself engenders ever-growing wants that lead it ever onwards.
Outside of economics, the idea that people compare themselves to others and are envious if others have more than themselves is ancient. One of the Ten Commandments in the Old Testament warns of jealousy of what other men have. Veblen (Reference Veblen1899) recounts many anecdotes from antiquity where the motivation of dictators and commoners was to outdo others. Adam Smith in his Theory of Moral Sentiments similarly remarked that it was ‘vanity’ that urged men on. Outside of the Anglo-Saxon tradition, the same idea was prevalent. Karl Marx (Reference Marx1880), for instance, remarked that ‘A house may be large or small; as long as the surrounding houses are equally small it satisfies all social demands for a dwelling. But if a palace rises beside the little house, the little house shrinks into a hut’ (Das Kapital, chapter 6). So, in a sense, Easterlin (Reference Easterlin, David and Weber1974) was reintroducing the notion of relativity into economics by using it to explain the lack of any long-run benefit of greater income for aggregate happiness. A whole school of thought – the Leyden school that emerged in the 1970s and 1980s – focused largely on the idea of relative utility (for a review, see Van Praag & Frijters, Reference Van Praag, Frijters, Kahneman, Diener and Schwarz1999).
To be fair, at virtually the same time as Easterlin wrote on happiness and status, there was an active literature in micro-economics that talked about status. Early names included Duesenberry (Reference Duesenberry1949). Yet, these approaches were mainly concerned with consumer demand and not with the direct measurement of utility, nor the importance of relativity for other domains of economics.
The relativity idea as a motivational factor did have a stronghold in the literature on poverty. Sen (Reference Sen1983) reflected a large body of opinion and scholarly study when he advocated that we should interpret ‘poverty’, which really is a state of low material welfare and unhappiness, as an inherently relative phenomenon and that we should thus strive to reduce inequality. This position is still dominant today in terms of the measurement of poverty by means of counting people as poor when their income is below half the mean or 60% of the median in their society (the definition in most frequent use by the OECD), or below an imposed threshold such as US$2 per day.
In summary, economists have long accepted the cardinal measurement of wellbeing, except for a brief period of 60 years or so (1930–1990) when they preferred ordinal utility and GDP to the idea that we should ultimately ask individuals to be judges of their own circumstances. There was thus no common method of making strategic trade-offs, which, as Ragnar Frisch remarked, requires a cardinal utility concept. Economists now are slowly re-joining psychologists and others who have never let go of the idea of direct measurement and who thus pushed for the inclusion of direct measurement in many surveys. It is now time to seriously consider the next step, which is what measures we have that are suitable and how to base policy on them.
Measurement and validity of wellbeing
For wellbeing to be a workable policy goal, we need to be able to measure it with a reasonable degree of accuracy, at least in terms of how major policies affect it on aggregate over time.
One advantage of subjective wellbeing measures is that they are easily understood by survey respondents. The percentage of missing values for life satisfaction questions in the British Household Panel Survey (BHPS) and German Socio-Economic Panel Study (SOEP) are only around 1% and compare favourably to those on income, for example.
But individuals answering questions does not mean that they provide us with the information that we require on the distribution of wellbeing in a society. There are, however, by now a considerable number of types of evidence suggesting that the subjective wellbeing responses are valid in this sense.
Cross-rater validity
We want to know whether asking Individual A how happy she is will provide information about her unobserved real level of subjective wellbeing. One external way of checking the validity of the answers is then to ask Individual B whether he thinks Individual A is happy.
Individuals are able, to a large extent, to recognise and predict the satisfaction levels of others. Friends’ and family members’ reports of how happy they believe the respondent is correlate with the respondent's own report; this is also the case for the report given by the interviewer. Equally, respondents sometimes give open-ended interviews in conjunction with standard questions about their wellbeing. The wellbeing evaluations by third parties, who do not know the respondent, when they listen to these interviews match those of the respondent. In general, respondents who are shown pictures or videos of others can identify whether the individual shown to them was happy, sad, jealous and so on. It is tempting to think that there is an evolutionary advantage in being able to accurately evaluate others’ feelings.Footnote 5
Physiological and neurological evidence
If answers to survey questions reflect the individual's latent level of wellbeing and are comparable across individuals, then they should be correlated with relevant measures of physical wellbeing.
First, it is common that those with worse objective physical health report lower wellbeing scores, where the former includes heart disease and strokes, for example. In Blanchflower and Oswald (Reference Blanchflower and Oswald2008), happiness and high blood pressure are negatively correlated both across countries and within countries. Subjective wellbeing scores also predict health reactions: individuals with higher positive emotion scores were less likely to catch a cold when exposed to a cold virus and recovered faster if they did (Cohen et al., Reference Cohen, Doyle, Turner, Alper and Skoner2003), although there was no relationship here with negative emotions. Diener and Chan (Reference Diener and Chan2011) show that happier people have stronger immune systems, experience less inflammation and cardiovascular disease and suffer from fewer infections. They also have less telomere shortening (see Epel, Reference Epel2009), where telomeres are ‘surplus’ genes at the ends of the chromosomes that get shorter with each cell division. Cells stop dividing when they run out of telomeres, meaning that reduced telomere shortening increases the number of times a cell can divide and hence is important for the length of life of organisms.
In addition, there is a strong positive correlation between wellbeing scores and emotional expressions like Duchenne smiles and frowning. In terms of neurological measurement, there has been work on activity in the left and right prefrontal cortices of the brain, the differences between which are shown by Urry et al. (Reference Urry, Nitschke, Dolski, Jackson, Dalton, Mueller, Rosenkranz, Ryff, Singer and Davidson2004) to be correlated with the answers to a number of subjective wellbeing questions. These findings are consistent with the notion that individual subjective wellbeing corresponds to basic brain functioning and emotional expression. This in turn corresponds to the idea that individuals’ evaluations of their own lives serve a basic evolutionary function (i.e., for the individual to improve choices via regular self-reflection) and are partly observable by others (which leads to the shared understanding of language).
Wellbeing scores match our common-sense predictions
When we carry out regression analyses of the correlates of wellbeing scores, using information on tens or hundreds of thousands of individuals, the patterns of results (in terms of which individuals are happier than others) make sense in that they mostly correspond to what we would have predicted. Again, were subjective wellbeing scores not to be comparable across individuals (so that we do not know if your 5 represents higher or lower wellbeing than my 6), then we would find no such relationships.
Amongst others, the following correlations are found reasonably systematically, both in panel analyses where the variable is time-varying within individuals (such as employment or marriage) and in pooled cross-section analyses. Higher wellbeing scores are reported by individuals who:
– Are in employment;
– Have good health;
– Are partnered;
– Have higher income;
– Are either young or older (i.e., not in their mid-life crisis).
Such common-sense correlations are also found at the more aggregate level. In particular, respondents living in areas with higher inflation or unemployment are less satisfied (Di Tella et al., Reference Di Tella, MacCulloch and Oswald2001), while those with greater access to green spaces (Krekel et al., Reference Krekel, Kolbe and Wuestemann2016) or who are less exposed to pollution (Luechinger, Reference Luechinger2009) are more satisfied. Lastly, US states with more attractive characteristics (in terms of weather, environment, crime, education, real income and so on) also give higher life satisfaction scores using Behavioral Risk Factor Surveillance System (BRFSS) data from 2005–2008 (Oswald & Wu, Reference Oswald and Wu2010). Major economic collapses produce large negative swings in life satisfaction, which return to normal when the economy recovers (e.g., Easterlin, Reference Easterlin, McVey, Switek, Sawangfa and Zweig2010; Frijters et al., Reference Frijters, Haisken-DeNew and Shields2004; World Happiness Report, 2018, chapter 2). One might think that the UK experience of almost continuous growth in life satisfaction in the 2005–2018 period is a counterexample to this claim, since this period includes the Global Financial Crisis of 2008–2009, but the opposite is true: the life satisfaction data do show a small blip then, but, more importantly, the Global Financial Crisis in the UK was not associated with large employment losses, with labour force participation rates dropping by less than 1%, returning to previous levels within four years and then increasing to historically high levels. So, in fact, the life satisfaction experience in the UK during the Global Financial Crisis corresponds to a basic finding in the wellbeing empirical literature, which is that the hurt in recessions is mainly due to unemployment, not fewer consumption goods.
Wellbeing predicts future outcomes
If satisfaction scores reflect latent wellbeing and are comparable across individuals, then we should find that the cross-section distribution of wellbeing scores at a certain date predicts the distribution of future outcomes for the same individuals. The research here is carried out using panel data that allow the same individuals to be followed over time.
One active area of research here has been the labour market, where lower job satisfaction has been shown to predict future job quitting (e.g., Clark et al., Reference Clark, Georgellis and Sanfey1998; Freeman, Reference Freeman1978) and earlier retirement (Clark et al., Reference Clark, Mavromaras and Wei2015). Clark (Reference Clark2003) used UK panel data to show that the fall in wellbeing upon entering unemployment predicts unemployment duration: those who suffered the sharpest drop in wellbeing upon entering unemployment were the quickest to leave it. Lastly, wellbeing measured during one's teenage years in the American National Longitudinal Study of Adolescent to Adult Health (Add Health) data is a good predictor of earnings at the age of around 30 (De Neve & Oswald, Reference De Neve and Oswald2012).
Turning to family life, measures of life satisfaction among the single have been shown to predict future marriage (Stutzer & Frey, Reference Stutzer and Frey2006), while low wellbeing of the married predicts future marital break-up (Gardner & Oswald, Reference Gardner and Oswald2006). Along the same lines, in German Socio-Economic Panel data, levels of life satisfaction in one's teenage years predict future fertility (Cetre et al., Reference Cetre, Clark and Senik2016): the childless who will in the future have children are happier than the childless who will not have children.
Lastly, the distribution of current wellbeing predicts life expectancy: one well-known contribution here is the ‘Nun Study’ of 180 nuns in Milwaukee who joined the sisters of Notre Dame in the 1930s. Those who wrote more positive short sketches of their lives when they joined – in their late teens and early twenties – were significantly more likely to still be alive 60 years later (Danner et al., Reference Danner, Snowdon and Friesen2001). In more recent – and larger-scale – work, Banks et al. (Reference Banks, Nazroo and Steptoe2012) presented equivalent findings relating a variety of measures of wellbeing to survival probabilities measured six years later in data from the English Longitudinal Survey of Ageing. Similar results have been found in Germany (Frijters et al., Reference Frijters, Johnston and Shields2011).
Which measure is best?
While there is then a considerable amount of varied research suggesting that subjective wellbeing scores do reflect underlying wellbeing (and in a way that is at least partly comparable across individuals), the question of which is the best measure remains largely open. In large-scale surveys, we commonly find measures that are cognitive/evaluative (like life satisfaction or overall happiness), those picking up affect (mood or emotions) over a short time period like now or yesterday (happiness, sadness, stress, boredom, etc.) or even eudemonic measures of meaning and purpose in life. Which of these does the best job in picking up latent wellbeing in a cardinal manner?Footnote 6
One strand of literature has underlined that these various measures, when they exist in the same survey (and are thus asked of the same respondents at the same point in time), are fairly closely correlated with each other: individuals who report high scores on one wellbeing measure also do so on the others. In addition, the data patterns in regression analyses of the different wellbeing measures are very similar: the variables that predict higher levels of life satisfaction often also predict greater affect and higher levels of eudemonic wellbeing. Some examples of this kind of research are Clark and Senik (Reference Clark and Senik2011) and Clark (Reference Clark, Adler and Fleurbaey2016).
We can also imagine mobilizing the kind of research described in the ‘Wellbeing predicts future outcomes’ section above to ask which wellbeing measure best predicts behaviour. This is the approach taken in Clark (Reference Clark2001), where the different domain job satisfaction measures in the BHPS were compared in terms of their ability to predict future worker quitting (the ‘winner’ turned out to be satisfaction with job security), or in Green (Reference Green2010), who used panel data from the UK Skills Survey to show that overall job satisfaction better predicts quitting than do scales of job-related wellbeing along the Depression–Enthusiasm and the Anxiety–Comfort axes. In this context, it would be useful to compare the roles of different wellbeing measures in predicting future mortality. Although Banks et al. (Reference Banks, Nazroo and Steptoe2012) did consider a number of these as mortality risk factors, including measures of eudemonic wellbeing, they did not carry out a formal statistical comparison (see Becchetti et al., Reference Becchetti, Bachelet and Pisani2019).
A novel take on this question appeared in Benjamin et al. (Reference Benjamin, Heffetz, Kimball and Rees-Jones2012), who asked their survey respondents to consider a sequence of hypothetical pairwise choice scenarios. For example, respondents were faced with one option involving higher income but less sleep and a second option with more sleep but less income. They were first asked to indicate which of the two ‘would give you a happier life as a whole’, and then ‘which do you think you would choose’. Their first result was that not everyone chose the option that they say would make them happier (although this figure in their table 2 was only above 25% for one choice scenario out of 17). Second, a student sample was asked to evaluate the options in terms of not only happiness, but also 11 other aspects of life, such as control over your life, spirituality, social status and sense of purpose. The regression analysis of the stated choice revealed that own happiness was by far the strongest predictor of choice, but that, conditional on own happiness, some of these other aspects were also significant predictors. As such, choice (reflecting latent wellbeing) reflects not only own happiness, but also a number of other aspects. It is worth noting, however, that the gain in predictive power from these 11 other aspects is arguably only small in size (with the R2 statistic rising from 0.38 in the regression with only own happiness to 0.41 in the regression including own happiness and the 11 other aspects: see their table 3).
The frontrunner at the moment remains life satisfaction, generically measured by the first question in the UK's Office of National Statistics wellbeing module: ‘Overall, how satisfied are you with your life nowadays’, where a 0 is ‘not at all’ and a 10 is ‘completely’.
To summarize the advantages of this approach: it is cheap to collect; it is easy to explain; individuals give answers that relate intuitively to both their choice behaviour and their voting behaviour; it takes individuals seriously as political agents and sets them at the top of the judgement tree; there is a huge amount of data and research on its determinants, both in terms of correlations and causation; and politicians are comfortable with it.
To summarize the disadvantages of this approach: people can lie about it; it is easily manipulated via the design of the questionnaires and the format of the surveys; it is coarse grained (individuals can only answer with whole numbers); it is highly volatile such that one needs large numbers of individuals to get precise estimates of effects; and the effect of individual income seems too small compared to the effort people put into obtaining higher incomes, meaning there is something to be explained about behaviour.
Life satisfaction is thus, like QALYs, not a perfect measure, and one would like to see a process via which challengers can emerge so as to take the place of the ‘current best measure’. There is the practical question of how to decide upon supplementary measures for groups that have no political agency, such as very small children or those incapable of sensible communication. In addition, more fine-grained measures capable of precisely picking up small effects are needed for many applications. There thus needs to be a continuous search for improved and supplementary measures, as well as an ongoing system for producing some degree of consensus as to what measure is the best we have at the moment.
Is there real additional information in this measure, though, and would the policy dial change course if it were taken more seriously? In other words, would policy priorities be different if we were to target the wellbeing of the population rather than standard economic outcomes?
Wellbeing policy priorities
For strategic policy design that sets the budgets that different sectors have to spend, two types of evidence on wellbeing are needed. First – especially if the aim is to reduce the number of people with low levels of wellbeing – policy-makers must decide which policy areas need further development. For this purpose, the relevant evidence needs to show which factors contribute most to the variance of wellbeing in the population. The essential thinking here is that variation within the population tells us what can be changed by moving individuals from the worst to the best circumstances befalling the population.
Variation breakdowns
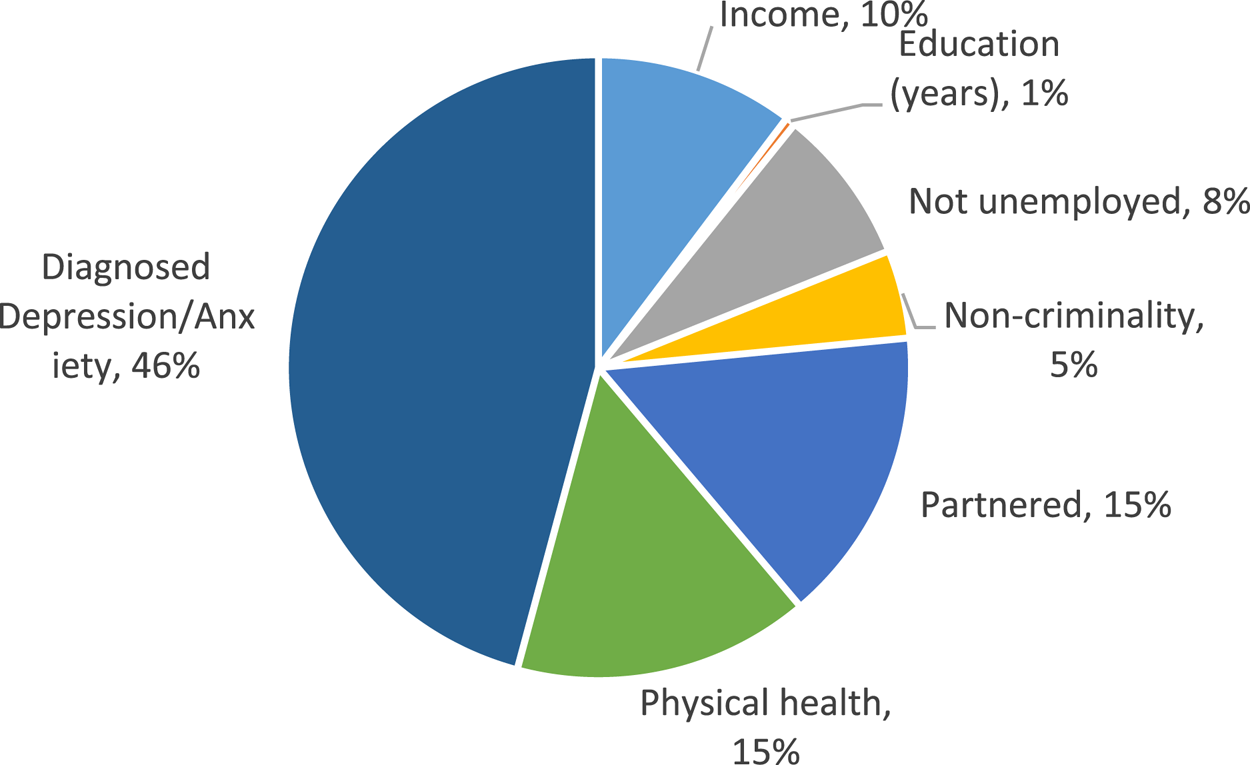
Figure 2 gives some evidence on this based on all adults over 25 years of age in the BHPS, which is representative and available over time.Footnote 7
The contribution of different socioeconomic factors to adult life satisfaction in the British Household Panel Survey over several years. Source: Clark et al. (Reference Clark, Flèche, Layard, Powdthavee and Ward2018).

Figure 2 is based on the partial correlation coefficients in an equation in which life satisfaction is regressed upon log household income per head, years of education, whether or not unemployed, number of criminal convictions (times minus one), whether partnered, number of physical health conditions and whether diagnosed as suffering from a depression or anxiety disorder. Prior to running this regression, the outcome and covariates are standardized with means of zero and standard deviations of one. The square of each coefficient measures the fraction of the explained variance of life satisfaction that is independently captured by the variable in question. Thus, Figure 2 shows the importance of different areas of life in terms of what can be explained about adult life satisfaction, which itself is 19% of the variation in adult life satisfaction (a lot of other factors not in here are fixed, like genetics or personality aspects, or very transient, like the weather).
As Figure 2 shows, the fraction of variance that is explained by income per head is around 10%. The other main factors are connections to other humans (being partnered and in a job) and health (physical and especially mental health).
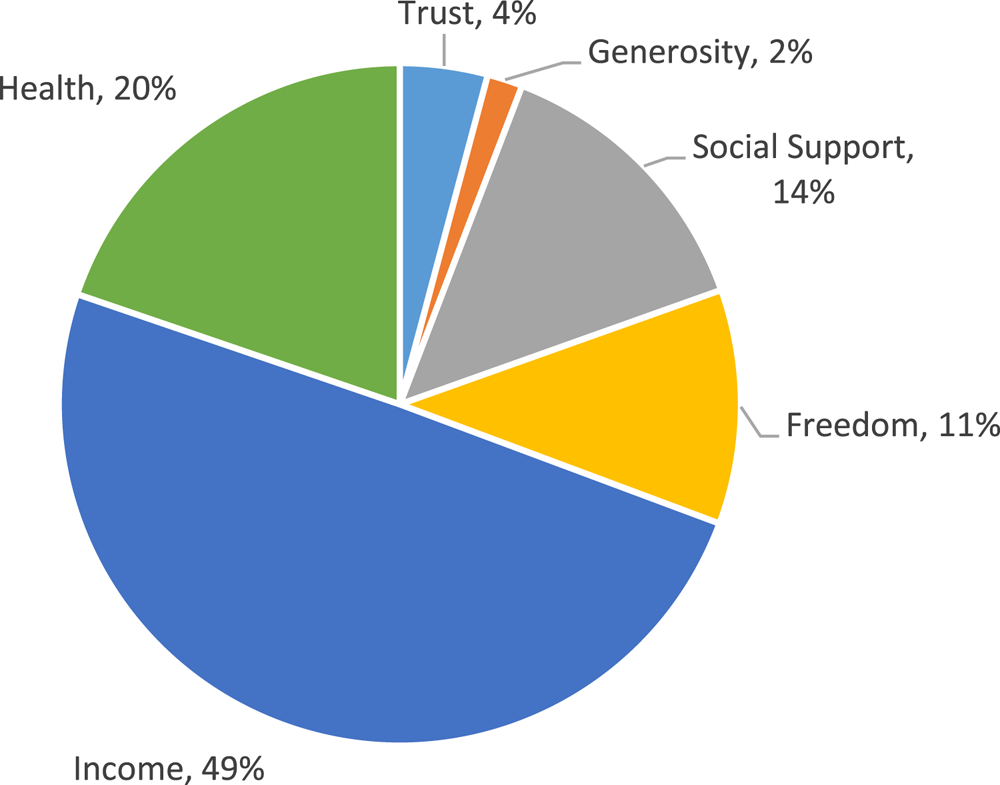
We can carry out the same exercise across countries by looking at what explains the variation in national life satisfaction.Footnote 8 Again, the idea for policy is that variation between countries gives us hints as to what can be achieved by moving from the institutions, culture and systems operating in countries with low wellbeing to those with high wellbeing.
Figure 3 shows how different areas of life contribute to what can be explained about cross-national life satisfaction, which is 76% of the variation in cross-national life satisfaction (other factors include things like wars, weather and cultural aspects not captured in the above). The reason that these factors are very different from the factors that explain individual life satisfaction is that some aspects vary only a little at the national level, such as partnerships and employment, whilst others differ a lot more, such as freedom. Importantly, income varies quite substantially both between individuals and between countries, which means it has a role in both sources of variation. Yet, income at the national level co-moves strongly with other elements, such as public services and social cohesion, making the question of causality very difficult to answer.
The contributions of different factors to national life satisfaction variation in the Gallup World Poll, 2008–2015. Source: Clark et al. (Reference Clark, Flèche, Layard, Powdthavee and Ward2018).

Estimates of key effects
The literature on wellbeing is by now vast and the ‘Bibliography of Happiness’ by Ruut Veenhoven lists thousands of correlates of happiness. Yet, for policy purposes, we must have causal estimates based on research designs that cut the mustard.
We argue that a useful approach would be to have an interactive process in terms of ‘agreed-upon metrics and causal effects’. The idea is that the bureaucracy should adopt a current metric for wellbeing (i.e., life satisfaction) until a better one comes along. Similarly, it should maintain and regularly update a list of believed effects of various policies and circumstances on its chosen metric of wellbeing. Such a list is crucial in terms of setting the policy priorities within and between different departments and in terms of having a consistent process for generating internal estimates of how much a complicated policy increases wellbeing via multiple channels. There are many ways by which the updating process could take place, but the idea is very similar to the current practise of departments having appraisal guidelines for their analysts. A regular shared list of believed effects would form part of a UK-wide appraisal guideline.
Because the list would be so influential in setting priorities and generating effects, its elements must be arrived at via a transparent process and improvements should be as scientifically argued as possible. In order to be practical, one has to have an openly visible list with point estimates for what the believed effect is, which come with explicit or implicit standard deviations. Given the importance of openness, we think it is probably best to have a headline estimate derived from whatever the supposed ‘best study’ is on some topic, because that allows practitioners to see all of the elements of the process (i.e., the type of measurement, the type of individuals, the conditioning set of other variables, etc.). Of course, any such nominated ‘best estimate’ would need to be backed up by several other studies that have similar results, and if their methodology is close enough, one could advocate a meta-estimate of them.
The great advantage of an open best estimate that comes from nominated studies is that it forces critics into the situation of coming up with better estimates: it is child's play to complain about any estimate from any study on a whole raft of very reasonable grounds, which means that complete agreement and consensus is an unachievable fantasy. Yet, a process in which there is a nominated current best estimate sharpens the debate, as it both allows an open contest for better estimates to emerge and be agreed to and forces critics to come up with an argued position of their own that leads to estimates of their own.
How frequently contestable such a list should be is open for debate, because one needs to balance the importance of predictability and hence persistence with the importance of allowing new insights to be incorporated. Who should organize the reviews of any current list is yet another matter, which in current UK policy practise is basically largely up to the Whitehall machinery and its assessment of whether there are good reasons to update their current internal advice and standards. If we gradually move towards a system in which scientific evidence is mainstreamed and ubiquitous in decision-making, it would seem to make sense to make the process of updating more transparent, but it would seem unlikely that one could start out that way, so there is also a transition issue here in terms of institutional set-up.
The International Panel for Climate Change (IPCC) process for generating a consensus number in terms of climate change is a good example of how governments can funnel science into a competitive process for arriving at overall numbers. That, too, involved a transition in the process itself as lessons were learned. As with climate change estimates, a wellbeing list would always be provisional and subject to caveats and disagreements, but that is to be expected in any explicit or implicit priority setting. Having open lists and debates can only improve upon the gut feeling that otherwise prevails.
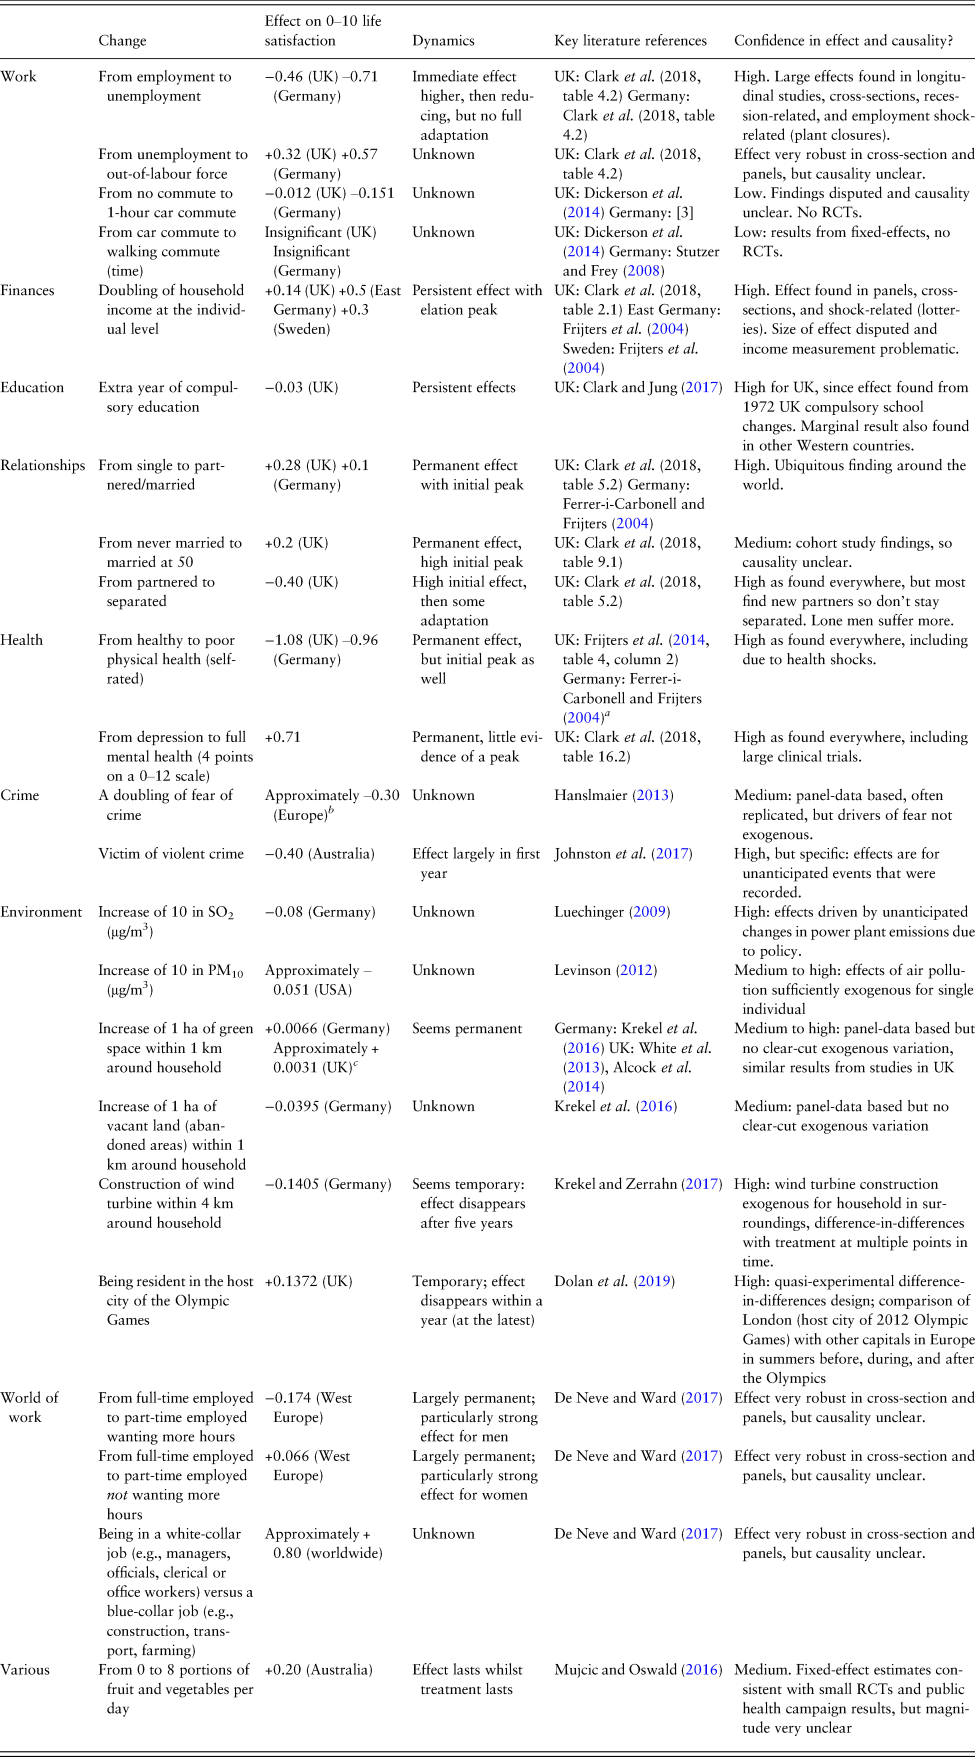
To kick off this process, we offer a preliminary list in Table 1, which has been generated within the What Works Centre for Wellbeing in the UK. Most of the numbers on the list come from studies that employ natural experiments or some other best available sources of variation to arrive at the effects. We do not have the space to defend and explain all of the items in Table 1, but will lift out one (the long-run effect of income at the individual level) and explain where that comes from.
A selection of key findings from the literature on Life Satisfaction (0–10).

a Based on a three-point change in a 1–5 self-reported measure of health.
b Derived from the relative effect of fear of crime versus the effect from unemployment in a log-odds setting.
c Converted from a 1–7 to a 0–10 scale of life satisfaction.
Example: the long-run wellbeing benefits of more money – what we now know from a Swedish lottery
A fundamental question for the economics of wellbeing is just how much wellbeing a pound buys if you give it to someone. Associated with that is the question of whether the wellbeing benefits of more money for an individual come at the expense of others who become more envious.
The standard story in the literature has so far been that more income for an individual does buy more life satisfaction, but not much, and largely at the expense of the life satisfaction of others. A recent 2018 snap survey of 50 world wellbeing experts thus found a large majority agreeing with the statement that increases in productivity were better spent on improved public services than more individual consumption.Footnote 9
Yet, we all still want to know how much wellbeing we as individuals gain if we become richer. The best data on that came from studies of UK lottery winners, such as Gardner and Oswald (Reference Gardner and Oswald2002), who found modest effects. The key problem with that study and the many subsequent ones from different countries that followed was that they had very few lottery winners who won substantial amounts in them, and the individuals who won small amounts were often heavy gamblers who were bound to pick up small prizes now and then. The average ‘lottery winning’ in that study was thus under £40, and only 65 people in their data won more than £1000.
A recent 2018 Swedish study from the University of Stockholm by Erik Lindqvist et al. (Reference Lindqvist, Oestling and Cesarini2018) managed to find 3362 winners of lotteries with average prizes close to US$100,000. The unusual feature of this study is not merely that they were able to find so many lottery winners, but also the nature of the lottery itself: they looked at a lottery amongst all members of the Swedish Labour Party, which included nearly half of the population in the period of the lottery wins (1990 onwards). Hence, the lottery winners were not committed gamblers, but rather accidental lottery participants who were ‘typical Swedes’ and who received large wins that were worth over half their lifetime incomes in hundreds of cases. It is an almost ideal type of ‘experiment’ to study the effect of more income on unsuspecting individuals.
The drawback of this study is that the authors were not able to follow individuals before and after the lottery, but only at least four years after they had won the lottery, so the study misses all of the short-run gains from winning the lottery, such as the elation that comes with such a gain. Nevertheless, the researchers were able to ascertain winners’ physical health, mental health, life satisfaction and how they spent the money in the many years following their lottery wins. They were able to match these winners with people from the same pool of potential winners (i.e., the lottery participants who did not win), allowing them to look at long-run effects.
Their results illuminate many aspects of wellbeing economics. First, the additional money had no effect on health, either physical or mental. The main reason for such a ‘nil effect’ is that Sweden, like the UK, has a rather good national health system that provides for all citizens. There are therefore few physical health services that additional money can buy an individual. The same explanation probably holds for the lack of mental health benefits: when the social safety net works well, mental health problems are not due to a lack of income. These are very policy-relevant findings.
Yet, there is a marked effect on life satisfaction, even after 20 years: a 10% increase in lifetime income buys about 0.04 in life satisfaction on a 0–10 scale for every remaining year of life. That may not sound like much, but it is easily twice as much as one usually finds income to matter in the cross-section of European countries like Sweden and the UK. This large effect indicates that more ‘regular’ studies of income and life satisfaction suffer from statistical problems, such as individuals who are particularly happy in a year underreporting their actual incomes because they feel less need to mention all of the money they made (for a discussion, see Clark et al., Reference Clark, Frijters and Shields2008).
Equally interesting is that the study found the Swedish lottery winners to have spent their winnings very sensibly: the winners had not spend it in one go, but effectively saved up the vast majority and only slowly spent the winnings, partially by working fewer hours and partially via greater consumption (holidays, houses, etc.). The idea that people are stupid with money and spend prizes in a big splurge is simply not true, at least not for Swedes.
The fact that these lottery winners significantly reduced their working hours tells us that before their wins they were indeed working longer hours than they would have wished, potentially to keep up their consumption level in a status race. Evidence for such a status race has, for instance, been found in a study on lottery winners in The Netherlands (Kuhn et al. Reference Kuhn, Kooreman, Soetevent and Kapteyn2011), where the neighbours of those who had won a luxury car were found to be much more likely to buy a new car themselves.
The results of this fairly simple study are thus quite profound for wellbeing economics: they suggest that a 10% increase in income increases life satisfaction by 0.04, which is thereby the new benchmark for what the long-run effect of income is on individuals. The lack of any effect on physical and mental health furthermore suggests that we should not expect many health benefits from spreading income around more: a good health system manages to largely overcome the advantage of money.
Cost–effectiveness
So how would a policy-maker decide whether a policy change was desirable if the goal was the happiness of the relevant population?Footnote 10 What follows is a simplified version of how one would proceed. It assumes throughout that happiness is measurable on a cardinal scale (like temperature) and that levels of happiness can be compared between one person and another.Footnote 11
We can begin with the problem of how to spend a given sum of money so as to deliver the best value, where value is measured in units of happiness. Thus, in the case of government expenditure, we take the size of the state as given, and we assume initially that the problem is how to maximize the aggregate happiness of the relevant population, subject to that constraint.Footnote 12
The correct approach is then to rank all possible policies in terms of the extra happiness which they generate per pound of expenditure, starting with the most effective and working down.Footnote 13 We then undertake as many policies as it is possible to do before the total money available is exhausted.
In the process of doing this, we can usefully focus attention on the policy that only just qualifies to be undertaken. The extra happiness which that policy generates per dollar of expenditure provides the critical ratio λ, which all other projects must exceed if they are to pass the test of value for money. So the criterion for a policy to be accepted is:
 $$\displaystyle{{Extra\; happiness} \over {Net\; cost}}\, \gt \; \lambda $$
This critical ratio can be established by trial and error and, once established, provides the criterion that can be used in taking decisions about individual policies, one at a time, without looking at all policies simultaneously. This decentralized approach is the essence of effective policy-making.
As we have formulated the approach, it is a form of cost–effectiveness analysis. We measure the benefits in one set of units (happiness) and the costs in another (money), and we assume that the total amount of money available is predetermined. By contrast, in traditional cost–benefit analysis, both benefits and costs are measured in the same units. So traditional cost–benefit analysis, applied across the board, in principle determines the total scale of public expenditure. This is politically unrealistic because deciding on the overall budget is deemed to be the job of elected politicians, where changes are hotly contested, so taking budgets as given by the political process leads to cost–effectiveness analysis as a sensible way forward.
Much information is required to do this well, as is true for traditional cost–benefit analysis. Ideally, we would carry out a properly controlled experiment that would measure directly the impact of the policy upon happiness. The experiment would also measure carefully not only the direct public expenditure cost of the policy, but also its indirect cost implications (e.g., it might subsequently lead to savings on welfare benefits or it might involve the additional cost of extra years of education). The desirability of the project would then depend on the extra happiness it delivered relative to the extra expenditure involved, measured in net terms.
But, for governments, there are other important policy problems in addition to how to spend a given budget total. There is the issue of how to raise taxes. The approach here is more direct. If we envisage a self-financing tax change, we simply evaluate how this alters the happiness of each member of the population and aggregate these changes (if we are, as assumed so far, simply maximizing the sum of happiness across all individuals). Similarly, if we are considering a new regulation, we simply add up its effects on happiness across all members of the population. In practice, of course, a new regulation may also affect the budget deficit, making possible greater (or fewer) opportunities for public expenditure. So we need a way to value such extra money in units of happiness. We already have the answer: the value of the extra money is the extra happiness that is generated by the marginal public expenditure project.
That said, many key questions remain, which also arise with traditional cost–benefit analysis. They include: the aggregation of happiness across people; the aggregation of happiness over time (the discount rate); and the length of life and the birth rate.
The aggregation of happiness across people
In any policy analysis, we have to aggregate its effects on different people: normally, some people gain but others lose. The approach we have used so far is that advocated by Jeremy Bentham: we simply add up the effects. But should we not give more weight to changes (up or down) in the happiness of people who are currently miserable than of people who are already quite happy? This can be argued, but how much extra weight should be given? One approach is to ask the population what they think about the weights.Footnote 14 One can also use sensitivity analysis to see what difference (if any) is made when comparing mutually exclusive project options.
Before moving on, we ought to mention some other more data-intensive approaches that focus directly on misery. One approach is to focus specifically on negative emotion as measured by replies to questions like ‘How sad/worried/frustrated/angry were you yesterday?’Footnote 15 Alternatively, we could use time-use data, where individuals are asked about each episode in the previous day, with questions for each episode about the extent of various positive and negative emotions. As Krueger et al. (Reference Krueger, Kahneman, Schkade, Scharz, Stone and Kruger2009) have proposed, we could then rate an episode as miserable if the most powerful negative emotion during it was more powerful than the most positive emotion (see also Layard, Reference Layard and Kruger2009). From this, we could find what fraction of the day each person spent being miserable – what Krueger et al. called the person's ‘misery’ index – and we could make the average misery index into our measure of social welfare. Such an exercise, however, is very data intensive and requires the collection of time-use data.
The discount rate
The next issue is how to add up effects occurring at different points in time. For most individuals, the effects of a policy change are spread over a number of years, and indeed some policies affect people not yet born. So what discount rate should we use to combine effects that occur in different years? In traditional cost–benefit analysis, the discount rate consists of two elements that are added together. The first (the ‘social discount rate’) reflects the general uncertainty about the future and the degree to which the future matters less than the present; the second reflects the fact that future generations are expected to be richer and therefore to have a lower marginal utility of income. In the current UK Treasury's Green Book, the first element is put at 1.5% per annum and the second at 2%.Footnote 16 There is clearly a case for a discount rate. But, when our measurements are in units of happiness, declining marginal utility of income ceases to be relevant, although there is still the distributional issue of how we should allow for differences in happiness between different generations (or indeed different years of one person's life). There is no neat solution to this problem, and where it is severe it must be shown explicitly in the analysis. Where it is not, the pure time discount rate may suffice.Footnote 17
If this is the approach to discounting happiness, how should we discount future public expenditure? In principle, there should be a separate price attached to public expenditure in each period. But in practice, if the path of public expenditure is reasonably smooth, we can probably assume that the price of public expenditure in units of current happiness would remain the same from one year to the next. This would mean that the price of future public expenditure in units of today's happiness should fall at the same discount rate as is used for future happiness. Yet, if funds come from borrowing from outside the system, such as from international capital markets, then one should use the appropriate interest rate for the costs.
The length of life and number of births
Finally, how should we value changes in the length of life? Most people would agree that a longer life is better, but so is a happier one. So how could we combine these two desirable things into a single objective measure of what we are aiming at for an individual? The most common approach is to multiply the person's length of life by his or her average happiness – so that the result equals the total happiness the person experiences – or in medical parlance the number of QALYs.
However, for this to make sense, we need to assume that there is such a thing as zero happiness – in other words, happiness is measured on a ratio scale rather than a cardinal scale. The typical scale that measures life satisfaction runs from 0 (‘not at all satisfied’) to 10 (‘extremely satisfied’), and at a stretch one could interpret 0 as equivalent to zero happiness.Footnote 18
But are all years of life after birth equally important? For example, if life expectancy is 80, is it twice as valuable if we save the life of a new-born infant as if we save the life of a 40-year-old? Any other assumption is bound to be controversial.
Finally, there is the issue of the numbers born. Some policies clearly do affect the number of births, and some countries, like France, India, China and Japan, have all tried to influence the fertility of their populations. How do we evaluate such policies? We can imagine two extreme positions: one position says the only thing that counts is the proportional distribution of WELLBYs among all of those who are born, and that the number of people born is immaterial. Thus, a world of one million people is as good as one of seven billion who are equally happy. The opposite position says that what matters are total WELLBYs, added up over all of the people born.Footnote 19 According to that second position, we should prefer a trebling of births even if it halved the WELLBYs per person born. Most people would probably hold some intermediate position, but few of a liberal disposition would want government regulation of births beyond relatively mild incentives one way or the other.
Acceptability
This completes our outline of an approach to policy analysis based on happiness as the measure of benefit. We think it should be generally applied throughout the public services and by non-governmental organizations. As it took hold, people would become familiar with which ratios of happiness per unit of expenditure were typically acceptable and which were not.
One final question: could we not do all of this equally well using money as the measure of benefit? After all, money has a specific impact on every person's happiness (its marginal utility), so we could always measure a person's change in happiness by the change in money that would produce the same change in happiness. In the jargon, this is known as the ‘equivalent variation’. Why not use that?
The most obvious problem is that the marginal utility of income differs widely between people. It is much lower for richer than for poorer people. Can this problem be handled within the existing money-based framework of cost–benefit analysis? One approach would be to show separately the money-equivalent net benefits for different income groups, as the Treasury does now. But the problem with this is that income is not very closely correlated with happiness. Thus, for example, if mental illness were properly treated, it would mainly benefit people who were miserable, which is important (see Layard & Clark, Reference Layard and Clark2014). But if the breakdown were by income class, the benefits would be shown as being more evenly spread across the board (as the poor require less income in order to be happier). So the most natural approach is to carry out the analysis in units of happiness. We could then show net benefits separately for people with different levels of happiness.Footnote 20
Next steps
What has to happen next for wellbeing to become the goal of government? We see developments in three areas as pivotal: measurement, methodology and government guidelines on policy analysis and appraisal. Finally, interventions with high public impact that target population wellbeing explicitly can help generate the necessary public momentum to push the government towards using wellbeing as the ultimate policy evaluation metric. We discuss each area in turn below.
Measurement
If you do not measure it, you cannot act on it. Hence, for wellbeing to become the goal of government, it is necessary to systematically integrate a commonly agreed-upon small set of core wellbeing indicators – the principal being life satisfaction – in surveys regularly conducted by national statistical agencies. This will allow the government to identify wellbeing inequalities in the population at a given point in time and to track changes in wellbeing as more and more data are accumulated over time. Integrating these wellbeing indicators into all surveys should be the default option.
Following recommendations by Dolan et al. (Reference Dolan, Layard and Metcalfe2011, Reference Dolan and Metcalfe2012), the Office for National Statistics (ONS) in the UK has taken a lead role in measurement: starting in 2011, the agency has included (at least) four wellbeing indicators, covering evaluative, experiential and eudemonic dimensions of wellbeing, in all of its surveys.Footnote 21 Eight years on, there is now a wealth of data that are used by the UK government and other actors to study, for example, the drivers of regional wellbeing inequalities and wellbeing developments within the UK over time. Such initiatives are being followed by other governments to allow comparisons between countries. International organizations such as the OECD, with its Better Life Initiative and wellbeing at the core of its strategy, are helping to coordinate and develop a small common set of core wellbeing indicators. Events such as the Global Dialogue on Happiness, part of the World Government Summit, can foster exchanges between policy-makers and practitioners, and its releases (e.g., the Global Happiness and Wellbeing Policy Report) can provide high-level guidance on measurement, methods and specific topic issues. The United Nations Sustainable Development Solutions Network's World Happiness Report has been measuring wellbeing around the world since 2012.
Although this article has focused primarily on the developed world, it is important that these developments do not bypass the developing world: international organizations such as the World Bank or national development agencies should mimic these efforts. There is much to learn from wellbeing data, for example, about the exact nature of poverty (Haushofer & Fehr, Reference Haushofer and Fehr2014; Schilbach et al., Reference Schilbach, Schofield and Mullainathan2016), poverty measurement (Duclos et al., Reference Duclos, Sahn and Younger2006) and effective programme implementation (Haushofer & Shapiro, Reference Haushofer and Shapiro2016). Interventions in developing countries should therefore include the core wellbeing indicators to capture broader impacts, identify potential transmission channels and spill-overs across groups of people and make programmes comparable to each other; national statistical offices in developing countries should be assisted in their wellbeing data collection efforts.
A national agreement on the currently used wellbeing measure also needs agreement on the proxy measures to be used for groups that cannot express themselves, such as very young children below 10 years of age and patients with severe Alzheimer's disease. The most promising candidate is some notion of carer-rated life satisfaction for these groups, but this too is a choice that should be subject to challenge by promising alternatives.
The analysis of wellbeing can proceed outside the core set of indicators into existing survey instruments: notwithstanding issues of data protection and ethical considerations, Big Data sources such as Facebook or even simple imagery, from which wellbeing data may be elicited using deep learning techniques such as convolutional neural networks, provide a hitherto untapped potential for analysis.Footnote 22 Their purpose is at least fourfold: the continued search for an alternative to the core set of wellbeing indicators; replication of policy analysis based on the core indicators; new analyses on policy experiments for which Big Data has wellbeing proxies that are not available elsewhere; and more in-depth analysis of subgroups and drivers. The key advantage of Big Data indicators is their greater power.
Methodology
Closely related to measurement is methodology: we have sketched the long-run scenario wherein wellbeing cost–effectiveness becomes the central mechanism to allocate budgets, but there is the question of how one goes from current practice to that outcome via smaller steps.
At the moment, subjective wellbeing analyses already complement traditional economic methods that evaluate the benefits of interventions in the form of changes in consumer and producer surplus in traded goods. A good example in which subjective wellbeing complements this comes from the environment and the valuation of externalities: as there exist no market prices for environmental externalities such as air pollution and noise or public goods such as green spaces, one needs to deduce their value by other means.Footnote 23 To the extent that markets are imperfect to varying degrees, wellbeing data can be used to value the externality by simply comparing those who live under varying levels of the externality (e.g., see Luechinger, Reference Luechinger2009). In completely imperfect markets (or in markets with few transactions), as an extreme case, externalities can only be detected in wellbeing data, underscoring the need for collecting data and evaluating impacts on wellbeing.
There are at the moment conflicting estimates for the conversion rate between money and life satisfaction. It is well known, for example, that wellbeing regressions yield relatively small income coefficients, typically of the order of 0.1–0.2 for log income in UK panel data settings and slightly larger in cross-sections (Clark et al., Reference Clark, Flèche, Layard, Powdthavee and Ward2018).Footnote 24 We find larger effects in lotteries (Gardner & Oswald, Reference Gardner and Oswald2007) and much larger effects when looking at self-identified financial shocks (Frijters et al., Reference Frijters, Johnston and Shields2011). Why these estimates differ so much is the subject of ongoing research. Solving this puzzle and coming up with a consensus estimate for income to translate money into wellbeing features high on the wellbeing research agenda.
The longer-run aim of evaluating all benefits in terms of wellbeing also needs to confront current limitations, including the questions of: where the current average wellbeing per pound spent actually lies; what an appropriate zero point of wellbeing is for analyses that involve changes in the number of individuals and the length of life; the issue of how to deal with fractional attachment to the population (i.e., those yet to be born or people yet to migrate to the UK); and what the conversion rate is from various subjective measures (e.g., mental health or conduct disorders) into the preferred wellbeing measure.
There is also the question of how to actually use the many conflicting results in the wellbeing literature and the social science literature to inform policy. In effect, one wants to see the emergence of models of how various policy areas relate to wellbeing so as to be able to trace the benefits of this or that change. This comes with particular challenges in the case of wellbeing, such as from the great importance of the anticipation and adaptation of effects (which require particular care in empirical analyses: before–after is not good enough to identify effects in many cases). In addition, there are as yet no macro-models of wellbeing that relate to cultural issues or the wide array of investments by the state. How investments into identity (such as via national museums) fit in is similarly not formalized as yet. The London School of Economics team is developing microsimulation models that simulate the impacts of hypothetical future policy changes (mostly in the areas of mental health and emotional skills), but the state bureaucracies will need a far greater modelling effort in many fields in order to fully utilize all of the literature information already out there.
For wellbeing to become a practical goal of government decision-making, both cost–benefit analysis augmented by wellbeing data and wellbeing cost–effectiveness analysis need to be advanced.
Government guidelines on policy analysis and appraisal
Ultimately, government needs to be empowered to apply the wellbeing toolkit for wellbeing to become the goal of policy-making. This has both a top-down and a bottom-up element: there need to be top-down government guidelines and handbooks on how to use wellbeing data, cost–benefit analysis based on wellbeing data and wellbeing cost–effectiveness analysis for policy analysis and appraisal. The appendix on wellbeing cost–effectiveness analysis in the UK Treasury's Green Book is an important first step in this direction. Analysts in government departments and agencies then need to be trained – bottom-up – on how to apply the wellbeing toolkit in daily policy-making. There needs to be a common language on and understanding of wellbeing across government, including a process of funding approval based on wellbeing policy analysis and appraisal that is granted the same chance of success as that based on traditional methods.
Training analysts, however, goes beyond educating the current labour force: it also includes educating future analysts already at the university level. Wellbeing needs to have a place in policy school curricula, and students should be trained on how to use the wellbeing toolkit in their future work, be it in the public, private or third sectors. There is fortunately quite a demand for such courses on the student side, and the number of courses on offer is growing steadily.
Fuelling this demand are often interventions with high public impact that target population wellbeing explicitly: interventions such as the Exploring What Matters course by the Action for Happiness charity in England – a course targeting mental wellbeing and pro-social behaviour that is conducted by volunteers in their local communities, currently in more than 19 countries worldwideFootnote 25 – or the Improving Access to Psychological Therapies scheme by the National Health Service in the UK place wellbeing in the public spotlight (Clark, Reference Clark2018), sparking debate about a more systematic use of wellbeing as a policy evaluation metric. This helps in generating the necessary, bottom-up momentum to push the government towards using wellbeing as part of a policy indicator dashboard, enriching traditional indicators that are insufficiently capable of dealing with issues such as the environment, public goods or behavioural elements like anticipation and adaptation or relative comparisons. Ultimately, this is in the best interest of the government: wellbeing is amongst the strongest predictors of voting for the incumbent, even stronger than economic fundamentals (Ward, Reference Ward2015). There are exciting times ahead.