INTRODUCTION
Soils of the western Amazon, derived from the uplift of the Andes, are relatively young geologically and therefore rich in mineral nutrients (Gregory-Wodzicki Reference GREGORY-WODZICKI2000, Sombroek Reference SOMBROEK2000). In contrast, soils in central and eastern Amazonia, having eroded from the Guiana Shield and the Brazilian Highlands over the course of 300 million years, are ancient and therefore extremely poor in weatherable minerals (Quesada et al. Reference QUESADA, LLOYD, ANDERSON, FYLLAS, SCHWARZ and CZIMCZIK2011, Sombroek Reference SOMBROEK2000). These soil fertility differences determine differences in nutrient levels of whitewater and blackwater rivers (Sioli & Klinge Reference SIOLI and KLINGE1962) and vegetation on upland terre firme soils between rivers (Quesada et al. Reference QUESADA, LLOYD, ANDERSON, FYLLAS, SCHWARZ and CZIMCZIK2011, Sombroek Reference SOMBROEK2000). Apparently these soil differences underlie differences in forest dynamics because there is a close correspondence between terrestrial plant productivity and soil fertility across South America, with higher productivity closer to the Andes (Malhi et al. Reference MALHI, BAKER, PHILLIPS, ALMEIDA, ALVAREZ, ARROYO, CHAVE, CZIMCZIK, DIFIORE, HIGUCHI, KILLEEN, LAURANCE, LAURANCE, LEWIS, MONTOYA, MONTEAGUDO, NEILL, VARGAS, PATINO, PITMAN, QUESADA, SALOMAO, SILVA, LEZAMA, MARTINEZ, TERBORGH, VINCETI and LLOYD2004). As differences in autotrophic productivity can be transferred to higher trophic levels, we ask here whether differences in soil fertility and plant productivity across the Amazon Basin can explain variation in the biomass of an important group of secondary consumers – frogs and lizards.
Leaf-litter plots have been used extensively in tropical regions to investigate terrestrial herpetofaunal assemblages, particularly for estimating species richness and density (Jaeger & Inger Reference JAEGER, INGER, Heyer, Donnelly, McDiarmid, Hayek and Foster1994). For this reason, there are more robust datasets available for leaf-litter herpetofauna than for other guilds. We hypothesized that differences in soil fertility and plant productivity drive characteristics, particularly the biomass and abundance, of leaf litter herpetofaunal assemblages. Here, we first test whether a difference in herpetofaunal biomass and abundance exists between sites on soils of recent origin in western South America and sites in the central Amazon, with the prediction that there will be greater biomass and abundances at younger-soil sites. We then test whether frog and lizard biomass from litter plots are a function of plant productivity and soil fertility for 10 Neotropical lowland wet forest sites. As biomass is the product of both the abundance of individuals and individual mass, we also tested whether abundance and individual mass were functions of plant productivity and soil fertility.
METHODS
Study sites
We reviewed a number of litter-plot studies throughout the Neotropics to find herpetofaunal datasets comparable to recent standardized datasets from five sites in Ecuador and Brazil (Deichmann et al. Reference DEICHMANN, LIMA and WILLIAMSON2011). In particular, we searched for studies conducted with similar methods in lowland rain forests during the rainy season within 10° of the equator. Furthermore, as we intended to test biomass differences, we needed studies that included biomass data for frogs and lizards or those where biomass could be estimated from snout–vent length (SVL) measurements. Our review yielded two comparable studies, one for a site in the Peruvian Amazon (Toft Reference TOFT1980b) and the other for two lowland sites in Panama (Toft Reference TOFT1980a). These three sites have soils of recent origin, comparable to the Ecuadorian sites. To further expand the comparisons, we sampled two sites in French Guiana with the expectation that they would exhibit biomass intermediate between sites on nutrient-rich and nutrient-poor soils of the western and central Amazon because soils in the north-central Amazon across the Guiana Shield, although old, are more variable in soil type and nutrient content than soils of the eastern Amazon Basin proper (Sombroek Reference SOMBROEK2000).
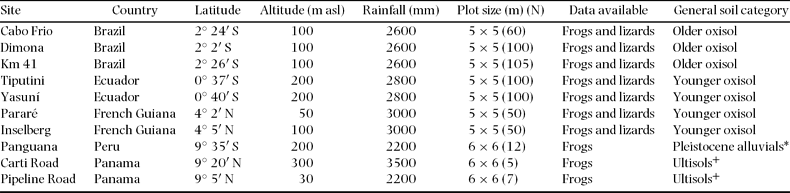
Biomass data were compiled from the following ten sites: Cabo Frio, Dimona and Km 41 at the Biological Dynamics of Forest Fragments Project (BDFFP) near Manaus, Brazil; Tiputini Biodiversity Station and Yasuní Research Station in Orellana Province, Ecuador; Pararé and Inselberg sites at Nouragues Biological Station in central French Guiana; Panguana Biological Station in Huánuco Department, Peru; and Pipeline and Carti Roads in Colon Province, Panama (Table 1). Although Panama is politically part of Central America, we included it because it shares litter herpetofauna and young soils with the western South American sites, and part of Panama is continental. Site descriptions and basic data collection methods are described by Deichmann et al. (Reference DEICHMANN, LIMA and WILLIAMSON2011) for Brazil and Ecuador, Toft (Reference TOFT1980a) for Peru, and Toft (Reference TOFT1980b) for Panama. The sites in French Guiana, described by Bongers et al. (Reference BONGERS, CHARLES-DOMINIQUE, FORGET and THÉRY2001), were sampled following the protocol of Deichmann et al. (Reference DEICHMANN, LIMA and WILLIAMSON2011). Data on anurans were available for all sites; however, only seven of the 10 sites included data on lizards (Table 1). We edited the datasets from each site to include only diurnally sampled quadrats of similar size (5 × 5 or 6 × 6 m) from terra firme forest during the wet season. In this way, we hoped to minimize confounding due to variation in time of day of sampling, quadrat size, habitat type and season. Many valuable datasets were excluded because they employed sampling that did not meet our comparison standards. Sites sampled within each country in our report were within reasonable proximity to one another and shared soil types, so here we refer to them by country, although some countries, like Brazil, include large areas of both ancient and young soils.
List of sites included in this study. N represents the number of plots conducted on primary terra firme forest in the wet season at each site. Some data from the Brazil and Ecuador sites have been previously published in Deichmann et al. (Reference DEICHMANN, LIMA and WILLIAMSON2011); Panama data are from Toft (Reference TOFT1980b); Peru data are from Toft (Reference TOFT1980a). General soil categories are taken from Malhi et al. Reference MALHI, BAKER, PHILLIPS, ALMEIDA, ALVAREZ, ARROYO, CHAVE, CZIMCZIK, DIFIORE, HIGUCHI, KILLEEN, LAURANCE, LAURANCE, LEWIS, MONTOYA, MONTEAGUDO, NEILL, VARGAS, PATINO, PITMAN, QUESADA, SALOMAO, SILVA, LEZAMA, MARTINEZ, TERBORGH, VINCETI and LLOYD2004; Closest available data come from sites at +Barro Colorado Island and *Manu National Park.

Biomass, abundance, and individual mass
Biomass per plot was calculated as the sum of the actual mass of each individual found in a plot. Frogs and lizards from Ecuador, Brazil and French Guiana had mass measurements accurate to 0.01 g (measured with an Ohaus Scout Pro electronic balance). For sites in Panama and Peru, the masses of individual frogs and lizards were estimated from snout–vent length (SVL) using species, genus or family-specific mass-SVL regression equations (Deichmann et al. Reference DEICHMANN, DUELLMAN and WILLIAMSON2008). Although a few individuals escaped during sampling, these individuals were typically identified to species and their life stage was recorded as ‘juveniles’ or ‘adults’ where possible. In order to estimate mass for escapees, we determined the average size of only juveniles, the average of only adults, and the average of all individuals of the species at the site, and then applied the appropriate average to each individual escapee. This procedure follows other biomass studies where capturing all individuals is not possible (Peres & Dolman Reference PERES and DOLMAN2000). In order to standardize the data, given the use of different plot sizes in data collection, both abundance and biomass were calculated per unit area from all sites and logarithmically transformed for statistical analyses.
We tested for differences in biomass (g per 100 m2) and abundance (number of individuals per 100 m2) among sites nested in countries where country and site were fixed effects in a mixed model ANOVA (PROC MIXED) in SAS 9.1.2 (Cary, North Carolina, USA). No significant effects of site were found within countries, so abundance and biomass were compared across the main effect of country alone. Where countries exhibited significant effects, pairwise differences between countries were examined by Tukey's multiple comparisons.
We also compared the distribution of individual mass across countries with Kruskal–Wallis ANOVAs, separately for frogs and lizards, followed by pairwise tests for differences between countries with the Wilcoxon rank sum tests.
Plant productivity and soil fertility
We selected data on coarse woody productivity (CWP) and annual stem turnover rate (STR) for our sites as indicators of plant productivity and the dynamic nature of forests (Malhi et al. Reference MALHI, BAKER, PHILLIPS, ALMEIDA, ALVAREZ, ARROYO, CHAVE, CZIMCZIK, DIFIORE, HIGUCHI, KILLEEN, LAURANCE, LAURANCE, LEWIS, MONTOYA, MONTEAGUDO, NEILL, VARGAS, PATINO, PITMAN, QUESADA, SALOMAO, SILVA, LEZAMA, MARTINEZ, TERBORGH, VINCETI and LLOYD2004). CWP is approximately proportionate to above-ground productivity in tropical forests, and STR measures the per cent of stems being replaced annually (Malhi et al. Reference MALHI, BAKER, PHILLIPS, ALMEIDA, ALVAREZ, ARROYO, CHAVE, CZIMCZIK, DIFIORE, HIGUCHI, KILLEEN, LAURANCE, LAURANCE, LEWIS, MONTOYA, MONTEAGUDO, NEILL, VARGAS, PATINO, PITMAN, QUESADA, SALOMAO, SILVA, LEZAMA, MARTINEZ, TERBORGH, VINCETI and LLOYD2004). For sites where more than one measurement was available, we calculated the average CWP and STR values. We also obtained data for cation exchange capacity of the clay fraction of the soil (CECc) as a measure of soil fertility from the soil and terrain database for Latin America and the Caribbean (SOTERLAC), the most recent compilation for the region (Batjes Reference BATJES2005). This database is available at the 1:5 million scale and was compiled according to the uniform SOTER methodology (Van Engelen & Wen Reference VAN ENGELEN and WEN1995). The data are available for download as ArcGIS shapefiles. To determine the CECc of our ten sites of interest, we entered the coordinates of each site into ArcMap and used the corresponding CECc from a depth range of 0–20 cm (Batjes Reference BATJES2005, Van Engelen & Wen Reference VAN ENGELEN and WEN1995) of the defined SOTER unit that corresponded to each location on the SOTERLAC map. Because these SOTER units are largely based on a small number of sampling sites compiled from natural and agricultural areas in each region and extrapolated to cover a greater area based on similarities in physiography (landform, parent material and soil properties), application of the dataset to primary forests is potentially problematic. However, it remains the most extensive and inclusive soil map in existence for Latin America. Although many soil variables are available in the SOTERLAC database, CECc, which measures the sum of K+, Ca+2, Mg+2, Al+, Na+ and H+ available in the clay component of a surface (0–20 cm) sample, is a proven indicator of soil fertility in tropical South America (Laurance et al. Reference LAURANCE, FEARNSIDE, LAURANCE, DELAMONICA, LOVEJOY, RANKIN-DE MERONA, CHAMBERS and GASCON1999, Peña-Claros et al. 2011, Quesada et al. Reference QUESADA, LLOYD, ANDERSON, FYLLAS, SCHWARZ and CZIMCZIK2011). For all three variables, CECc, CWP and STR, we used data from sites as near as possible to the herpetological study sites (Table 1).
We applied forward stepwise regression to determine which independent variables (CECc, CWP and STR) could best explain frog and lizard biomass, abundance and individual mass where significant variables entered the models at P ≤ 0.05. Prior to analysis, all dependent and independent variables were logarithmically (base 10) transformed.
RESULTS
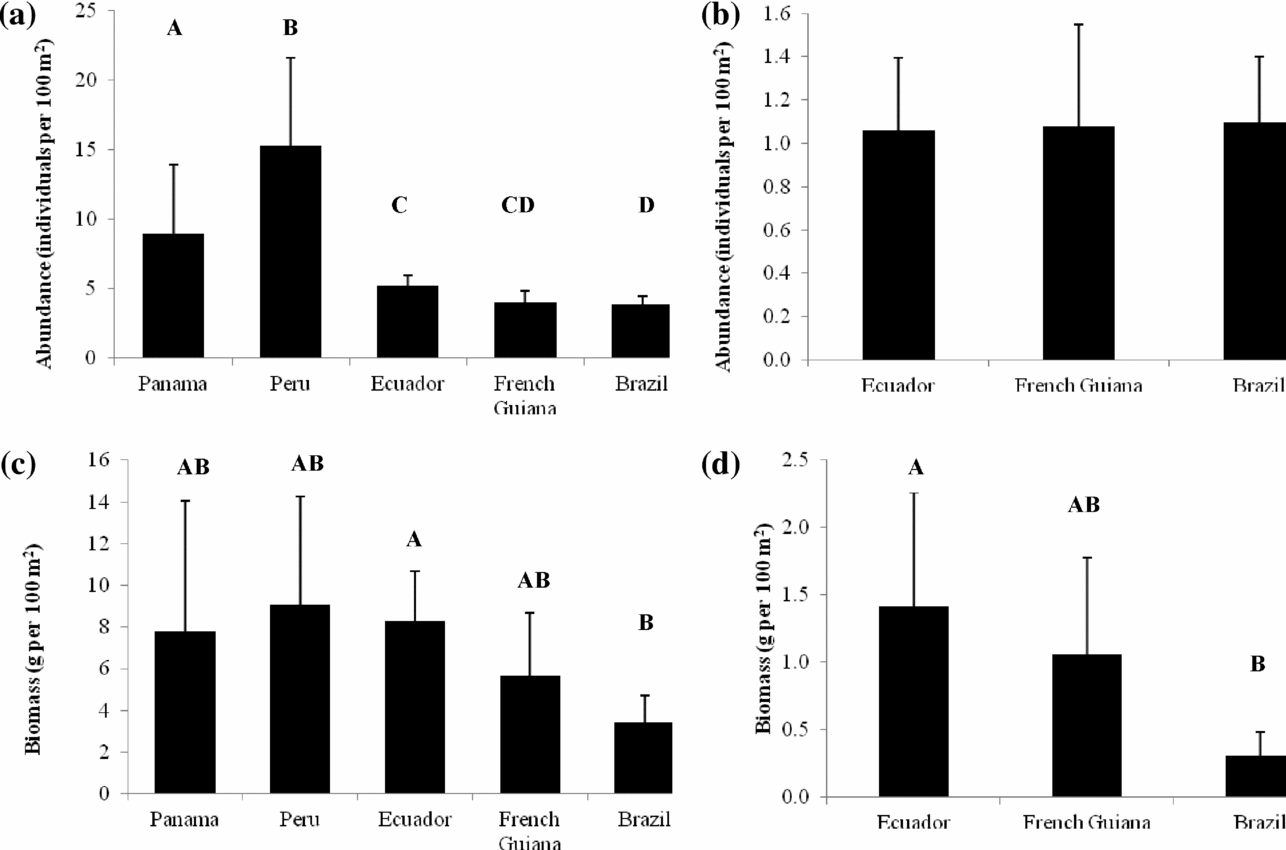
There was significant variation in amphibian abundance among countries (F 4,580 = 16.0, P < 0.001), with the sites in Panama and Peru having higher abundances than each of the other countries (Figure 1a), and the Peruvian site exceeding Panamanian sites as well. Frogs at the Ecuadorian sites were more abundant than frogs at Brazilian sites (t = 2.56, df = 580, Tukey adj. P = 0.033) as shown previously (Deichmann et al. Reference DEICHMANN, LIMA and WILLIAMSON2011). Frog abundance at French Guianan sites was intermediate between sites in Ecuador and Brazil, but not significantly different from either one. In contrast, for lizard abundance, there was no significant effect of country (F 2,557 = 0.01, P = 0.992; Figure 1b) for the three countries tested: Brazil, French Guiana and Ecuador (Figure 1b). There was no significant effect of site within country for amphibian abundance (F 7,580 = 1.47, P = 0.174), lizard abundance (F 5,557 = 1.75, P = 0.122), anuran biomass (F 7,580 = 1.38, P = 0.212) or lizard biomass (F 5,557 = 1.00, P = 0.418).
Abundance and biomass of frogs and lizards at sites in five regions in South America. Error bars are 95% confidence intervals. Bars with different letters are significantly different as detected by post hoc Tukey comparisons (P ≤ 0.05). Separate figures show data for abundance of frogs (a) and lizards (b) and biomass of frogs (c) and lizards (d). Brazil and Ecuador data are published in Deichmann et al. (Reference DEICHMANN, LIMA and WILLIAMSON2011); Panama data are from Toft (Reference TOFT1980b); Peru data are from Toft (Reference TOFT1980a).

For anuran biomass, there was a significant country effect (F 4,580 = 4.61, P = 0.001) with sites in Ecuador having higher biomass than sites in Brazil as shown previously (Deichmann et al. Reference DEICHMANN, LIMA and WILLIAMSON2011). The sites in Peru and Panama showed biomass comparable to Ecuadorian sites and greater than Brazilian sites, but not significantly so (Figure 1c). The biomass of anurans at sites in French Guiana was greater than that at sites in Brazil and less than Ecuadorian sites, but again not significantly so. For lizard biomass, there was a significant country effect (F 2,557 = 5.32, P = 0.005) with Ecuadorian lizard biomass significantly greater than that of Brazilian sites as shown previously (Deichmann et al. Reference DEICHMANN, LIMA and WILLIAMSON2011). Again, lizard biomass at sites in French Guiana was intermediate between biomass at sites in Ecuador and Brazil, but not significantly different from either (Figure 1d).
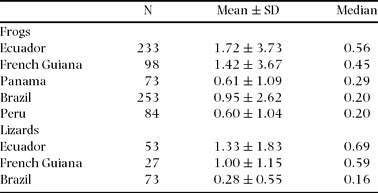
The mass distributions of individual frogs showed significant heterogeneity among countries (Kruskal–Wallis ANOVA, KW = 50.6, N = 741, P < 0.01). By country, frog mass divided neatly into two groups: Ecuador and French Guiana on one hand and Panama, Brazil and Peru on the other (Table 2). Members of the first group (Ecuador and French Guiana) were statistically larger than members of the second group (Wilcoxon rank sum tests, P ≤ 0.01 in each case).
Mean mass, SD and median mass (g) of individual frogs and lizards from five and three countries, respectively. Pairwise Wilcoxon rank sum tests for frogs revealed two groups (Ecuador and French Guiana versus Panama, Brazil and Peru) where there are no significant differences within a group, but each country in one group is different (P ≤ 0.01) from each country in the other group. For lizards, only Brazil was significantly different from French Guiana and from Ecuador (P < 0.01).

The mass distributions of lizards showed heterogeneity among countries (Kruskal–Wallis ANOVA, KW = 69.4, N = 153, P < 0.01). Lizards from Brazil were significantly smaller than those from French Guiana (Wilcoxon rank sum test, RS = 5050, N = 100, P < 0.01) and those from Ecuador (RS = 8001, N = 73, P < 0.01), but the mass of individual lizards from Ecuador and French Guiana was not significantly different (RS = 3240, N = 80, P = 0.15; Table 2).
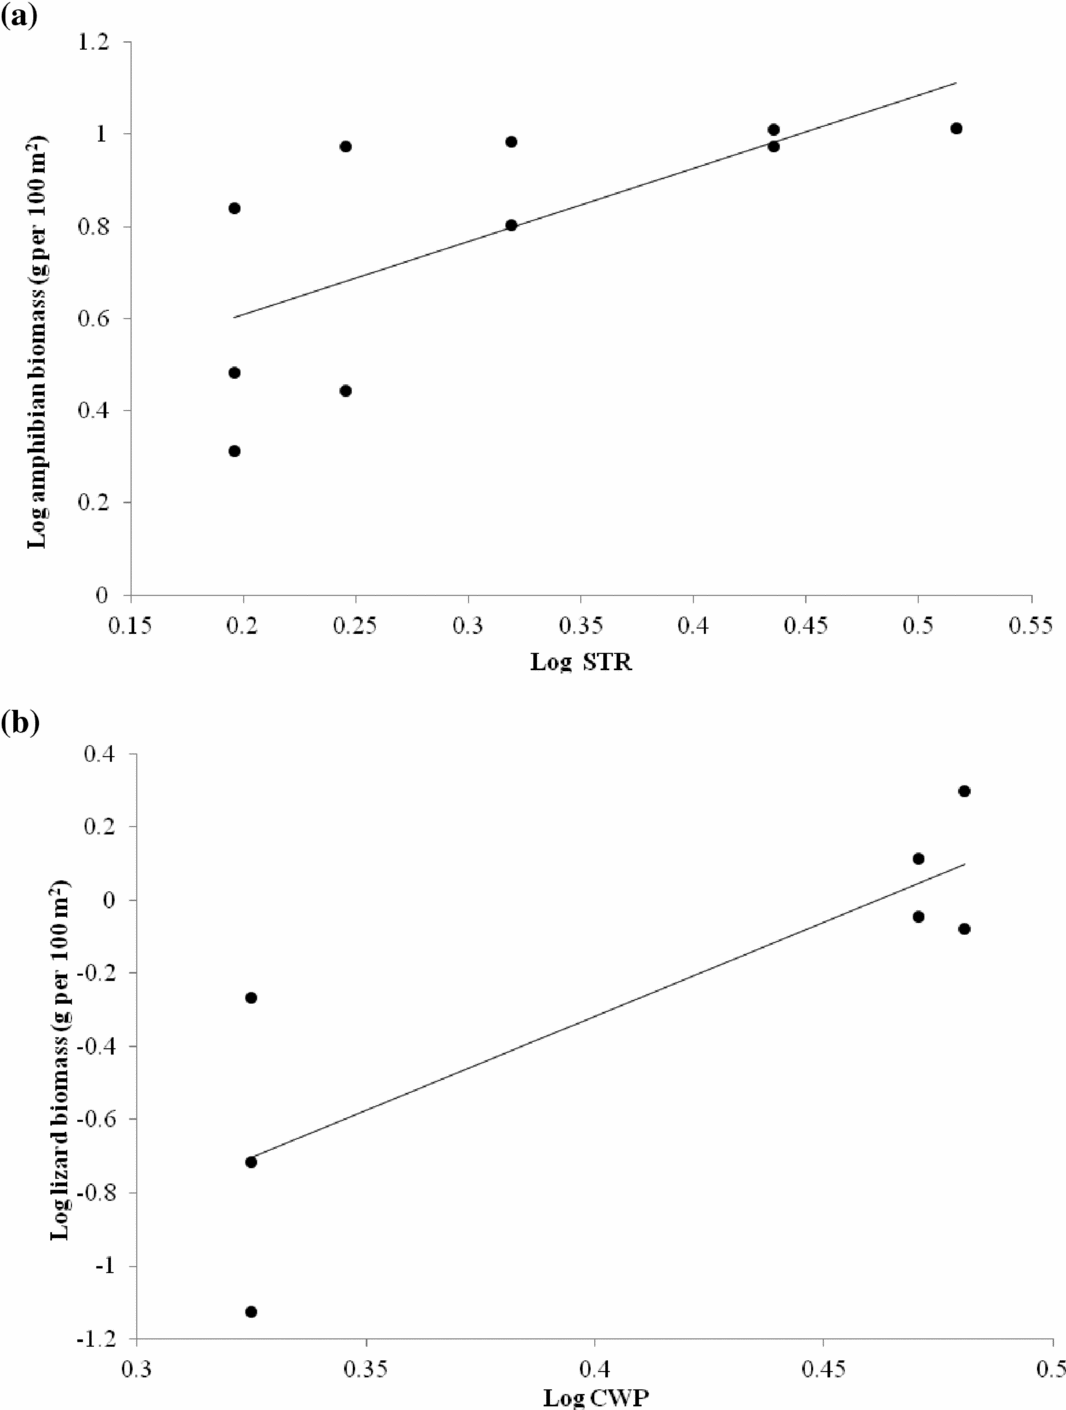
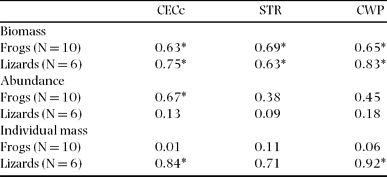
In a stepwise regression with CECc, CWP and STR as independent variables, STR explained 48% of the variation in frog biomass across South American sites and it was the only variable selected (Figure 2a). For lizard biomass, CWP was the only variable selected and it explained 69% of the biomass across sites (Figure 2b). Although only one variable was selected in each stepwise regression, each of the three variables could explain a significant proportion of the variation in frog and lizard biomass (Table 3). The three independent variables – CECc, STR and CWP – were highly correlated (R = 0.83–0.88 for each pair), so it is unlikely that more than one would have been selected in stepwise regression.
Linear relationship between amphibian biomass and annual stem turnover rate (STR) for ten sites from five regions in South America (a) and between lizard biomass and coarse woody productivity (CWP) for seven sites from three regions in South America (b).

Correlation coefficients (R) of frog and lizard biomass, abundance and individual mass with soil fertility (CEC), stem turnover rate (STR) and coarse woody productivity (CWP). Values indicated with an asterisk are statistically significant at P ≤ 0.05. Critical values for N = 10 are R ≥ 0.55 for P ≤ 0.05 and R ≥ 0.72 for P ≤ 0.01, for one-tailed hypotheses. For N = 6, critical values are R ≥ 0.73 for P ≤ 0.05 and R ≥ 0.88 for P ≤ 0.01.

For frogs, abundance was positively correlated with CECc, STR and CWP, but significantly so only with CECc (Table 3). In contrast, mean individual mass of frogs showed absolutely no relationship to CECc, STR and CWP (Table 3). For lizards, abundance was unrelated to CECc, STR and CWP (Table 3). In contrast, individual mass was strongly dependent on the soil fertility and plant productivity variables (Table 3).
DISCUSSION
Previous studies of litter frogs and lizards have focused strictly on abundance without regard to biomass. Comparing data from Costa Rica, Panama, Borneo and the Philippines, Scott (Reference SCOTT1976) suggested that abundances of litter frogs and lizards in the lowland wet forests of Central America were an order of magnitude greater than abundances in South-East Asia, even though species richness between the two regions did not differ. Scott's interpretation, characterized as Asian tropics versus American tropics, was modified when Allmon (Reference ALLMON1991) demonstrated that abundances of litter frogs in the Brazilian Amazon were substantially lower than abundances in Peru and Central America (Allmon Reference ALLMON1991). In a recent study, Deichmann et al. (Reference DEICHMANN, LIMA and WILLIAMSON2011) confirmed both abundance and biomass differences of the leaf-litter herpetofauna between the western Amazon in Ecuador and the central Amazon in Brazil. Deichmann et al. (Reference DEICHMANN, LIMA and WILLIAMSON2011) postulated that differences in abundance were caused by differences in soil nutrients that affect plant productivity which affects biomass of arthropods, which in turn affects biomass of frogs and lizards; however, no soil fertility or productivity data were presented.
Results of the regression analyses here confirm that variation in the biomass of secondary consumers can be partially explained by variation in plant productivity or soil fertility. Coarse woody production, stem turnover rate, and cation exchange capacity proved more or less equally effective in explaining frog and lizard biomass as each of the three could explain a significant portion. Although the variables are all highly correlated, coarse woody production may more directly reflect whole plant productivity (Malhi et al. Reference MALHI, BAKER, PHILLIPS, ALMEIDA, ALVAREZ, ARROYO, CHAVE, CZIMCZIK, DIFIORE, HIGUCHI, KILLEEN, LAURANCE, LAURANCE, LEWIS, MONTOYA, MONTEAGUDO, NEILL, VARGAS, PATINO, PITMAN, QUESADA, SALOMAO, SILVA, LEZAMA, MARTINEZ, TERBORGH, VINCETI and LLOYD2004), and may therefore be an important variable to pursue in future studies. These data are strictly correlative, so experimental tests are needed.
How greater plant production translates into higher biomass appears to differ between frogs and lizards. The mass of individual frogs was independent of soil and productivity variables, but abundance per site varied with them and was statistically significant in the case of CECc (Figure 1a, Table 3). For lizards, increased biomass across sites was achieved mostly from increased individual mass, while abundance was independent of CECc, STR and CWP (Figure 1b, Table 3).
The different responses by frogs and lizards to variation in plant productivity may be related to different patterns of growth and development. Growth in both taxa can be classified as indeterminate to some degree or determinate but habitat dependent such that asymptotic adult size varies with resources (Sebens Reference SEBENS1987). Lower productivity could result in less available nutrition and possibly smaller adult size. How lower nutrition, particularly during development, influences the growth-reproduction trade-off and the resulting adult size may differ between the taxa (Taborsky Reference TABORSKY2006). Forest litter lizards are predators throughout their lives, whereas most Neotropical litter frogs are initially herbivorous or non-feeding as tadpoles and then metamorphose into predators, although the size of litter species at metamorphosis is often very small.
Did results for the five added sites from Peru, Panama and French Guiana follow the differences previously shown between Brazil and Ecuador, characterized as ancient and young soils, respectively? The trends in biomass and abundance for the added sites are promising in that they tend to conform to the hypothesis of dependence on soil age. The regression models for biomass are also promising, indicating that soil and productivity variables play a strong role in the determination of herpetofaunal biomass across the sampled sites.
Peru and Panama constitute young-soil sites and French Guiana an ancient-soil site, although somewhat intermediate due to its mixed origins. For frog abundances, all sites produced values consistent with the soil fertility hypothesis with Panama and Peru exhibiting high abundance and biomass like Ecuador. Abundances were actually significantly higher than the Ecuadorian sites while biomasses were the same. The low abundance and biomass at French Guianan sites matched, as expected, the Brazilian sites. Relative to the other sites, Central Amazonia and the Guiana Shield lie primarily on very old Oxisols which have no remaining weatherable mineral reserves (Sombroek Reference SOMBROEK2000). These old soils support forests with lower productivity than forests on younger soils in Western Amazonia (Malhi et al. Reference MALHI, BAKER, PHILLIPS, ALMEIDA, ALVAREZ, ARROYO, CHAVE, CZIMCZIK, DIFIORE, HIGUCHI, KILLEEN, LAURANCE, LAURANCE, LEWIS, MONTOYA, MONTEAGUDO, NEILL, VARGAS, PATINO, PITMAN, QUESADA, SALOMAO, SILVA, LEZAMA, MARTINEZ, TERBORGH, VINCETI and LLOYD2004). Low primary productivity in Central Amazonia and the Guianas should translate into reduced biomass at higher trophic levels (Deichmann et al. Reference DEICHMANN, LIMA and WILLIAMSON2011).
It is noteworthy that French Guiana had biomass of frogs and lizards which was intermediate between western and central Amazonia. Although the soils from our sites in Brazil and French Guiana are largely derived from ancient parent material, the soils from our sites in French Guiana are distinct from those at our Brazilian sites, with French Guianan soils having more local variation in weatherable minerals (Sombroek Reference SOMBROEK2000). More specifically, soils at Nouragues have a higher cation-exchange capacity that those at the BDFFP (Fearnside & Filho Reference FEARNSIDE, FILHO, Bierregaard, Gascon, Lovejoy and Mesquita2001, Grimaldi & Riéra Reference GRIMALDI, RIÉRA, Bongers, Charles-Dominique, Forget and Théry2001, Malhi et al. Reference MALHI, BAKER, PHILLIPS, ALMEIDA, ALVAREZ, ARROYO, CHAVE, CZIMCZIK, DIFIORE, HIGUCHI, KILLEEN, LAURANCE, LAURANCE, LEWIS, MONTOYA, MONTEAGUDO, NEILL, VARGAS, PATINO, PITMAN, QUESADA, SALOMAO, SILVA, LEZAMA, MARTINEZ, TERBORGH, VINCETI and LLOYD2004). For this reason, through primary productivity, we would expect our sites in French Guiana to be able to support a higher biomass of secondary consumers in the leaf-litter herpetofaunal assemblage than our Brazilian sites, but less than sites in western South America. Although the biomass differences between sites in Panama, Peru, French Guiana and Brazil exhibited in this study were not statistically significant, the trends shown warrant further investigation as statistical significance might be achieved with larger sample sizes. The added sites in Panama, Peru and French Guiana had fewer quadrats sampled than the original sites in Ecuador and Brazil (Table 1).
For lizards, the French Guianan sites exhibited no difference in abundances, just as Ecuadorian and Brazilian sites showed no difference in the previous study (Deichmann et al. Reference DEICHMANN, LIMA and WILLIAMSON2011). In contrast, lizard biomass at French Guianan sites was intermediate between the higher biomass of Ecuadorian and the lower biomass of Brazilian sites. As mentioned previously, the sites sampled in French Guiana lie on soils that are intermediate in terms of their age and weatherable mineral nutrients of the soils of Western and Central Amazonia. The intermediate lizard biomass is congruent with the soil age hypothesis.
In regard to individual size, sites in Peru and Panama did not have consistently larger individuals than Brazilian sites, and they were smaller than those of Ecuadorian sites. Sites in French Guiana did not have small individuals as we predicted, but instead seemed to resemble frog size distributions from sites in Ecuador. However, lizards in French Guiana did show size distributions intermediate between Ecuador and Brazil, as predicted. It is important to note that amphibian population structure is very dynamic and sites must be sampled further to confirm the patterns shown here.
Reduced community biomass on the weatherable mineral-poor soils could result from smaller adults or fewer adults or both at these sites. The pattern of smaller individuals on poorer soils does not appear to be an artifact of phylogeny because the average size attained by all species known to occur in the leaf-litter habitat at the Brazilian and Ecuadorian sites does not differ (Deichmann et al. Reference DEICHMANN, LIMA and WILLIAMSON2011). Higher primary productivity could increase the likelihood of reaching adulthood. In fact, of all frogs found in quadrats over different sampling periods, adults constituted 52% at Ecuadorian sites and only 43% at Brazilian sites. A reduced number of juveniles reaching an adult stage on ancient soils relative to the proportion reaching adulthood on young soils would potentially contribute to the reduced abundance and biomass found on ancient soils. It is important to note that the present analysis includes data collected during the wet season at each of the 10 sites, but these data were collected during different years in which the sites likely experienced differences in rainfall and seasonality.
Although leaf-litter herpetofauna datasets for La Selva Biological Station in Costa Rica and Barro Colorado Island (BCI) in Panama are the most extensive in the Neotropics, we did not include them in abundance and biomass analyses here. We excluded La Selva primarily because evidence points to declining populations of leaf-litter herpetofauna at that site (Whitfield et al. Reference WHITFIELD, BELL, PHILIPPI, SASA, BOLAÑOS, CHAVES, SAVAGE and DONNELLY2007). Furthermore, Central America has a very complex geological history, with part of the continent from Southern Nicaragua to Colombia having been under water for much of the Tertiary (Savage Reference SAVAGE1982). In addition, there is extreme heterogeneity in soil types throughout southern Central America with rapid changes in parent material over short distances (Sollins et al. Reference SOLLINS, SANCHO, MATA, SANFORD, McDade, Bawa, Hespenheide and Hartshorn1994, Yavitt Reference YAVITT2000). On BCI, a 1500-ha island, there are at least three different types of parent material and they exhibit different forest dynamics within a relatively small area (John et al. Reference JOHN, DALLING, HARMS, YAVITT, STALLARD, MIRABELLO, HUBBELL, VALENCIA, NAVARRETE, VALLEJO and FOSTER2007, Yavitt Reference YAVITT2000). In addition, BCI, an island for nearly a century, is known to have lower densities of leaf-litter herpetofauna compared with mainland Panama (Heatwole & Sexton Reference HEATWOLE and SEXTON1966).
Although we took great care to compile datasets derived from relatively similar methods, it is difficult to distinguish true differences and trends given variation in sampling techniques. In developing our comparisons, some datasets had to be excluded due to researcher bias in skill and preferences in terms of leaf-litter quadrat sampling (Heatwole Reference HEATWOLE, McDiarmid, Foster, Guyer, Gibbons and Chernoff2012). This disorder highlights the need for communication among investigators in the data collection and data-sharing processes as well as the need for caution when interpreting results of meta-analyses.
In the present study, we were limited by available datasets. Young-soil sites, primarily in Western South America, have been sampled much more extensively than old-soil sites. More sites throughout the lowland tropics, in particular on the geomorphologically ancient soils, would provide a clearer test of soil nutrient and primary productivity effects on the herpetofauna of South America. Additionally, given the extreme heterogeneity in parent materials in some areas such as the Guiana Shield, it would be prudent to systematically sample areas of different soils within countries for more direct investigations into the effects of geomorphology on leaf-litter herpetofauna.
Finally, we suggest that community biomass is an important variable for conservation across the Amazon Basin. Lower biomass per unit area on ancient soils may require larger reserves to sustain similar population sizes. Likewise, the components of biomass – abundance and individual mass – are likely to affect community vulnerability. A community of rare, large-bodied species is likely to be more at risk than one of abundant, small-bodied species for any given biomass.
ACKNOWLEDGEMENTS
We thank the staff at all of our field sites, particularly P. Gaucher at Nouragues, K. Swing, D. Romo and C. Barriga de Romo at Tiputini, L. Baldeón at Yasuní and R. Hipólito at the BDFFP for their help with logistics. We are grateful to S. Whitfield for allowing access to herpetofauna data from La Selva. We also thank M. Rodríguez, A. Enomenga, I. Nenquimo, H. Ahua and J. Fragata for assistance in the field. This work was supported by grants from the Conservation, Food and Health Foundation, Louisiana Governor's Office of Environmental Education, the Louisiana State University Biograds, and the US National Science Foundation (DEB-0639144 and DEB-1147434). Herpetofauna sampling procedures were approved by Louisiana State University Animal Care and Use Committee (Protocol 04-132). Fieldwork was conducted in Ecuador with permission of the Ministerio del Ambiente (004-IC-FA-PNY-RSO) and in Brazil with permits from CNPq (EXC 006-06-C) and IBAMA (n° 222/2006). This is publication #600 in the Technical Series of the Biological Dynamics of Forest Fragments Project (INPA–STRI).