





Introduction
The rainfed lowland ecosystem in Asia comprises about 30% of the world's rice production area (McLean, Reference Mc Lean, Dawe, Hardy and Hettel2002). These environments are characterized by poor soils (about 30%), frequently associated with high acidity and P deficiency (Haefele and Hijmans, Reference Haefele and Hijmans2009). For agricultural use of these soils, P deficiencies can be alleviated by fertilizer application. However, soluble P fertilizer sources are costly (Gregory et al., Reference Gregory, Haefele, Buresh, Singh, Pandey, Byerlee, Dawe, Dobermann, Mohanty, Rozelle and Hardy2010) and their application to acid and highly weathered soils is often ineffective (Dobermann and Fairhurst, Reference Dobermann and Fairhurst2000). In addition, costly solutions are often beyond the available resources of rice farmers in such marginal environments. When rice (Oryza sativa) is direct seeded as for example in Northeast Thailand (Sanusan et al., Reference Sanusan, Polthanee, Seripong, Audebert and Mouret2009) the young rice seedlings not only have to cope with P deficiency but also have to compete with weeds. Successful weed competition necessitates a fast and even germination and good seedling vigor (Farooq et al., Reference Farooq, Siddique, Rehman, Aziz, Lee and Wahid2011; Fukai, Reference Fukai, Pandey, Mortimer, Wade, Tuong, Lopez and Hardy2002). Seedling vigor may be compromised under conditions of P deficiency and furthermore, rice seeds from plants grown under such conditions may contain very low amounts of seed P. Low seed P has been shown to reduce shoot biomass in rice seedlings (Ros et al., Reference Ros, Bell and White1997). Thus, there is the need for low-cost options to overcome P limitations and enhance seedling vigor in these direct seeded rice environments. Ideally, such approaches should be seed-based for good adoption by farmers in low-input production systems. Seed priming is a technique that can successfully enhance seedling vigor in rice (Harris et al., Reference Harris, Tripathi, Joshi, Pandey, Mortimer, Wade, Tuong, Lopez and Hardy2002). In this procedure, seeds are soaked in water for approximately 12–24 h, a period shorter than required to induce germination in rice, before drying the seeds to storage moisture. A variation of water priming is nutrient priming where seeds are soaked in solution containing the limiting nutrient (in this case P) to supply additional nutrients to the seed (Ajouri et al., Reference Ajouri, Asgedom and Becker2004). This procedure requires much smaller amounts of P fertilizer than its replacement if this is added to the soil as in P placement or band application, which are other P-saving alternatives to broadcast application (Dobermann and Fairhurst, Reference Dobermann and Fairhurst2000). Seed P priming successfully enhanced seedling growth of barley in an alkaline, P-deficient soil (Ajouri et al., Reference Ajouri, Asgedom and Becker2004) as well as in maize (Miraj et al., Reference Miraj, Shah and Arif2013). A more recent option to overcome the problem of P limitation is the use of genotypes that carry the Phosphorus uptake 1 (Pup1) major quantitative trait locus (QTL), located on rice chromosome 12 (Wissuwa et al., Reference Wissuwa, Wegner, Ae and Yano2002). Pup1 is associated with the specific protein kinase gene ‘Phosphorus Starvation Tolerance 1’ (OsPSTOL1). This gene enhances and maintains root growth under stress, thereby enabling plants to explore a larger soil volume for limiting nutrients such as P (Gamuyao et al., Reference Gamuyao, Chin, Pariasca-Tanaka, Pesaresi, Catausan, Dalid, Slamet-Loedin, Tecson-Mendoza, Wissuwa and Heuer2012).
This study was designed to test both seed- and genotype-based options, sole and in combination, for enhancing seedling vigor and tolerance to P limitation in an acid soil. The objectives were to assess the effect of (i) seed characteristics (high or low seed P concentration and absence or presence of the Pup1 QTL) and (ii) of seed priming options (none, water, P) on seed germination, seedling growth and P uptake of 3 different rice genotypes, namely, DJ 123 (rainfed), Sadri Tor Misri (rainfed), and IR74 (irrigated).
Material and Methods
The study was conducted at the International Rice Research Institute (IRRI), Los Baños, Laguna, Philippines (14°10′N 121°15′E) from May to November 2012 and comprised a laboratory (seed incubator) study and two greenhouse experiments in potted soil.
Plant materials
Genotypes DJ 123 and Sadri Tor Misri were collected from a long-term experiment in a rainfed lowland field in Pangil, Laguna, Philippines (14°24′11″N 121°27′58″E). While high-P seeds were obtained from fertilized plots (having received 30 kg P ha −1), the low-P seeds were obtained from unfertilized control plots. Near-isogenic sister lines (NILs) of IR74 with (IR74 +Pup1) and without (IR74 −Pup1) the Pup1 QTL (Chin et al., Reference Chin, Gamuyao, Dalid, Bustamam, Prasetiyono, Moeljopawiro, Wissuwa and Heuer2011) were collected from demonstration plots at the IRRI experimental farm. Table 1 presents selected genotype attributes.
Seed characteristics of the genotypes selected for the study.
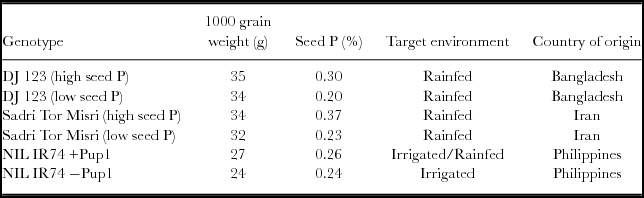
NIL: near isogenic line.
Treatment application
Experiment 1 - seed germination in the laboratory. Uniform seeds were selected, tied in nets, and soaked for 24 h in either water or in solutions containing 200 mM P (KH2PO4). During priming, no aeration was provided and the seeds in their solutions were left standing at ambient temperature. The maximal permissible concentration of P for the priming solution had been determined in a pre-study with at least 80% germination considered as the satisfactory threshold and a 24 h priming duration described as suitable for on-farm seed priming (Harris et al., Reference Harris, Tripathi, Joshi, Pandey, Mortimer, Wade, Tuong, Lopez and Hardy2002). Soaked seeds were recovered from the solution, spread on absorbent paper and allowed to dry at ambient temperature to ~14% moisture content. When this was reached after 6 – 8 h (checked by moisture meter; (Kett Riceter L Series Grain Moisture Tester), twenty-five seeds of each treatment (unprimed, water primed, P-primed) were sown within about one day in Petri dishes with a diameter of 9 cm, containing two layers of Whatman No. 1 filter paper and 5 mL distilled water. Dishes were incubated (Thermo Scientific Precision Dual-Program Growth Refrigerated Incubator Model 818) at 30/20 °C alternating temperature and a light/dark regime on 12/12 h duration for seven days. Distilled water was re-applied when necessary. The number of seeds germinated was counted daily and expressed as cumulative percentage of the total seed number. The criterion for germination was a radicle length of >1 mm as the appearance of the embryo marks the beginning of seedling growth (Nonogaki et al., Reference Nonogaki, Bassel and Bewley2010). At 7 days after seeding (DAS), shoot and root lengths were measured. Seedlings were separated into shoot, root and seeds, and oven-dried at 70 °C for 72 hours to record dry biomass.
Experiment 2 - seedling growth in pots with P deficient soil. Seeds were primed as described above and sown in pots (height = 31 cm, diameter = 27 cm) containing 15 kg of air dried, sieved soil collected from Siniloan, Laguna, Philippines (14° 28′ N 121° 29′ E). The soil was a P-deficient (2.35 mg available Bray-1 P kg−1) and acid (pHH2O 4.8) clay loam. Ten seeds per pot were covered thinly with soil. The pots were initially watered by spraying until the topsoil became moist and were thereafter irrigated daily until complete saturation (water flowing out of the holes at the bottom of the pots). Urea was applied at a rate of 2 g kg−1 to each pot at 21 DAS. Plant height was determined weekly until 35 DAS. At 35 DAS, whole plants were harvested and roots were washed of the soil. Seedlings were cleaned under running water, oven-dried at 70°C for 7 days, weighed and analyzed for P at IRRI's Analytical Service Laboratory (ASL).
Experiment 3 - root length of IR74 NILs (+/−Pup1). Seeds of each NIL were primed as described above and 2 seeds each were sown to PVC pipes of 40 cm height and 4 cm inner diameter, containing 400 g of air dried soil (see experiment 2) which was adjusted to ‘field capacity’ by daily irrigation. At 3 DAS, plants were thinned to one plant per pipe. Each treatment consisted of 10 individual tubes from which, at 14 DAS, seedlings of uniform height were harvested from three tubes to form one composite sample. Roots were separated from soil and cleaned with running tap water. Before root length scanning, the samples were rinsed in 70% ethanol and kept cold in an ice chest. Root samples were scanned using STD4800 Scanner Epson Perfection V700/V750. From the image analyses (WinRHIZO program) total root length was calculated.
Experimental design and statistical analysis
All experiments were laid out in factorial randomized complete block designs with four replications. Experiment 1 and 2 were repeated once (run1 and run2) with three factors: priming treatment (3 levels: unprimed, water- and P- primed), genotype (3 levels: DJ 123, Sadri Tor Misri, and NILs of IR74) and seed P content/Pup1 (two levels: high and low seed P content/ +−Pup1) (Table1). Experiment 3 consisted of the factors Pup1 (2 levels: +/− Pup1) and priming treatment (unprimed, water primed, P-primed).
Data were analyzed using SAS version 9.2 as split plots in a randomized complete block design with ‘run’ (the repetition of the experiment) as main plot. Experiment 3, which had no second run, was analyzed as randomized complete block design. For all experiments, the mixed procedure (proc mixed) was applied with replicate as random, and variety, P-status and priming as fixed factor. Where ‘run’ was treated as main plot, it was used as fixed factor and as random factor in combination with replicate. When significant interactions for a parameter between two factors occurred, the data set for each variety was analyzed separately for each P-status, and all statistical references refer to this level of analysis for all varieties. Means were separated by least significant difference test (LSD) at a significance threshold of 0.05. The data of plant survival (Experiment 2) were arcsine transformed before analysis.
Results
Effects of seed P concentration and Pup1
Seed germination and seedling survival differed between genotypes and seed attributes. Seeds of plants grown under low soil P concentration contained only 65% (DJ 123), and 61% (Sadri Tor Misri), of the P present in seeds from plants grown under high soil P concentration. For the –Pup1 NIL, the seed P concentration was reduced by 10% compared to the +Pup1 NIL (Figure 1). In potted soil (experiment 2), plant survival was reduced by up to 60% in the low-P seed plants of DJ 123 and Sadri Tor Misri. Likewise cumulative germination percentage in the Petri dish experiment (Figure 2) was reduced in the low-P seeds of these two genotypes. While seeds with high P concentration reached a germination level of 80% by latest day 5, germination remained at about 70% in DJ 123 (low seed P) and 40% in Sadri Tor Misri (low-P seed). Water priming but not P-priming enhanced germination especially in the low-P seed plants of Sadri Tor Misri. In IR74 Pup1 NILs, germination was relatively poor during the first 3 days. Again, water priming was most effective in increasing germination. Overall, highest germination rates were obtained in DJ 123, followed by IR74 (+/−Pup1) and Sadri Tor Misri.
Shoot biomass of 35 day-old plants in potted soil (experiment 2) grown from P-primed (PP), unprimed (UP) and water primed (WP) seeds. Data are sorted according to their initial (pre-priming seed P content; given above the genotype name on the X-axis) and are averaged over run1 and run2; DJ: DJ 123, Sadri: Sadri Tor Misri, +Pup1: IR74 +Pup1, −Pup1: IR74 −Pup1; HP: seeds of high P content, LP: seeds of low P content. Error bars represent the standard error of the mean (n = 8). Numbers within bars represent biomass of low seed P plants in percent of the respective high seed plants. The table shows the ANOVA results for the factors ‘run’, ‘priming’ and their interaction; P values indicate probability of significance, F values are not shown.

Cumulative percent germination in Petri dishes (experiment 1) of seeds that were P-primed (dark grey symbols), water-primed (light grey symbols) and unprimed (white symbols) from day 1 (D1) to day 7 (D7); circles: seeds of high seed P content or the +Pup1 seeds; triangles: seeds of low seed P content or the −Pup1 seeds. Data are averaged over run1 and run2 and error bars represent the standard error of the mean (n = 8).

Effect of priming
The effects of seed priming on biomass accumulation, plant height and seedling P content, differed by genotype. The highest plant biomass after 35 DAS was obtained by water priming, with the exception of the low seed P plants of Sadri Tor Misri (Figure 1). Shoot biomass from unprimed low-P seeds was 88% (DJ 123), 98% (Sadri Tor Misri) and 80% (IR74 NILs) of the respective plants from high-P seeds. For the water and P-primed treatments in DJ 123 and IR74 NILs, these ratios were similar, with about 90% and 70%, respectively. For Sadri Tor Misri, however, the ratio declined to 73% in water-primed seeds, but remained at 98% in P-primed seeds. Thus, water and P priming, both significantly increased shoot biomass. There was hardly any difference between the effects of water or P-priming with low-P seeds, while with high-P seeds, water priming significantly outperformed P-priming. In P-primed rainfed genotypes (DJ 123 and Sadri Tor Misri), plants derived from high-P seeds had a similar biomass as those from low-P seeds. In the lowland type IR74, +Pup1 outperformed −Pup1 by about 25% in P-primed plants.
Shoot P concentrations at 35 DAS were enhanced by priming treatments in all cases. Shoot P concentration was similar in water and P-primed plants of DJ 123, though biomass and P content of the other genotypes tended to be higher with water priming than with P priming (Figure 3). IR74 NILs had distinctly higher shoot P concentrations than Sadri Tor Misri and DJ 123 both of which appeared to be P deficient (< 0.1% P) in all treatments. Nevertheless, highest shoot biomass was obtained in Sadri Tor Misri and DJ 123 (primed, high seed P treatments).
Relationships of shoot P concentration and shoot biomass of 35 day-old plants in potted soil by seed treatment: P-primed (dark grey symbols), unprimed (light grey symbols), water-primed (white symbols); DJ: DJ 123, IR74, and Sadri: Sadri Tor Misri; symbols with bold border lines: seeds of high seed P content or the +Pup1 seeds. Data are averaged over run1 and run2 and error bars represent the standard error of the mean (n = 8). The table shows the ANOVA results for the factors ‘run’, ‘P-status’, ‘priming’ and their interaction; P values indicate probability of significance, F values are not shown.

In Petri dishes, plant shoot length varied by genotype and priming. Genotypes for rainfed environments, DJ 123 and Sadri Tor Misri, had longer shoots than the lowland type, IR74 NILs. Plants of primed seeds were taller than those of unprimed seeds after 7 days in Petri dishes (data not shown). In the potted soil experiment, the same pattern was observed and plants from high-P seeds were taller than those of low-P seeds throughout the growing period of 35 days when the IR74 NILs were about 25 cm and the rainfed genotypes about 40 to almost 60 cm tall (data not shown). Root length in the Petri dish experiment was enhanced by water priming, with no additional benefit from P-priming, except for the low seed P plants of Sadri Tor Misri where roots of P-primed plants were significantly longer than those of water primed plants (Figure 4A). Similar observations were made in the pot experiment, as water priming enhanced root length of the IR74 NILs, with no extra benefit of P-priming, although there was a tendency to increase root length for IR74 -Pup1 in the P-primed treatment. In this experiment, root length was highest in IR74 +Pup1 (Figure 4B). For the shoot/root ratios, only the potted soil experiment showed significant effects after 35 DAS. Generally, priming resulted in lower ratios indicating higher root biomass. Water priming and P-priming ratios were similar (Figure 5).
Root length in petri dishes in mm (A, experiment 1), and root length in km in potted soil (B, experiment 3) according to seed treatments: unprimed (white bars), water primed (light grey bars) and P-primed (black bars); HP: seeds of high P content, LP: seeds of low P content; Data are averaged over run1 and run2 and error bars represent the standard error of the mean (n = 8; n = 4 in 4B with only one run). The tables show the ANOVA results for the factors ‘run’, (P-status) ‘priming’ and their interaction; P values indicate probability of significance, F values are not shown.

Shoot/root biomass ratio in potted soil (experiment 2) according to seed treatments: unprimed (UP), water primed (WP) and P-primed (PP); DJ: DJ 123, Sadri: Sadri Tor Misri, +Pup1: IR74 +Pup1, −Pup1: IR74 −Pup1; HP: seeds of high P content, LP: seeds of low P content. Data are averaged over run1 and run2 and error bars represent the standard error of the mean (n = 8). The table shows the ANOVA results for the factors ‘run’, ‘priming’ and their interaction; P values indicate probability of significance, F values are not shown.

Discussion
Priming rice seeds with water or P solution, in general, had a positive effect on seedling growth. However, plants grown from seeds with low P contents (including IR74 −Pup1) did not perform as well as high seed P plants, even when P-primed. Only seedlings from low-P seed of Sadri Thor Misri generally tended towards a positive response to P priming. Thus seed P-priming appears a promising option only in the case of seeds with low P contents, while water-priming is the treatment of choice in seed with high P content.
Effect of seed P concentration and Pup1
In our experiment, the damaging effect of P starvation became evident in cumulative germination percent which remained considerably below the germination rates of high-P seeds. However, the impaired germination of P-starved seeds may not be a direct consequence of low seed P content but rather the effect of the (P)-stress conditions under which these seeds were produced (Rose et al., Reference Rose, Pariasca-Tanaka, Rose, Mori and Wissuwa2012 and references therein). When comparing the degree of P starvation with the study by Rose et al. (Reference Rose, Pariasca-Tanaka, Rose, Mori and Wissuwa2012) and Ros et al. (Reference Ros, Bell and White1997) where the lowest seed P concentration was about 47% of the high seed P concentration, the P levels in our study were still relatively high (>60%). Both studies also reported poorer performance of seedlings from P-starved seeds when grown in soil of low available P and a decline in germination (Rose et al., Reference Rose, Pariasca-Tanaka, Rose, Mori and Wissuwa2012). Nevertheless, for those seedlings derived from low-P seeds that did germinate we cannot rule out P-limitations as the shoot biomass of DJ 123 and Sadri Tor Misri (water-primed, low seed-P) was reduced by about 10% and 30%, respectively, when compared with plant grown from high-P seeds under the same conditions.
The difference between high and low seed-P (+/−Pup1) concentration in seeds of the IR74 NILs was less pronounced than in the other two genotypes. The –Pup1 seedlings appeared less than +Pup1 seedlings able to use the available soil P in the low-P soil as −Pup1 plants produced consistently less shoot biomass whether seeds were primed or not. Development of greater root length (Figure 4) may be the reason for the better performance of +Pup1 plants because it enables the plants to explore a larger soil volume (Gamuyao et al., Reference Gamuyao, Chin, Pariasca-Tanaka, Pesaresi, Catausan, Dalid, Slamet-Loedin, Tecson-Mendoza, Wissuwa and Heuer2012). Priming enhanced root length and increased shoot-P concentrations in IR74 +Pup1 above the critical deficiency threshold of 0.1% P for the youngest fully developed leaf (Dobermann and Fairhurst, Reference Dobermann and Fairhurst2000).
Effect of priming
P-priming did not generally have an additional benefit over water priming. The reasons for this remain speculative but could be associated with the relatively short priming time of 24 h when the osmotic pressure of the priming solution might have slowed down and partially impaired water imbibition of the seed and thus the priming effect. On the other hand, an interaction between seed P content and priming was evident as water-priming outperformed P-priming only when the seed P content was high. This aspect may warrant further attention when the development of low-P seed genotypes is targeted (Rose et al., Reference Rose, Pariasca-Tanaka, Rose, Mori and Wissuwa2012).
Water priming of rice seeds is a reportedly successful strategy to enhance seedling vigor (Farooq et al., Reference Farooq, Basra, Tabassum and Afzal2006; Harris et al., Reference Harris, Tripathi, Joshi, Pandey, Mortimer, Wade, Tuong, Lopez and Hardy2002). In other cereals like maize (Miraj et al., Reference Miraj, Shah and Arif2013), wheat (Sekiya and Yano, Reference Sekiya and Yano2010) or barley (Ajouri et al., Reference Ajouri, Asgedom and Becker2004), additional benefits of P-priming have been reported. Results for P-priming in rice appear ambiguous. Ros et al. (Reference Ros, Bell and White2000) reported reduced seedling emergence and no significant effect on seedling growth in 20- and 40-day-old-plants when rice seeds had been soaked in P solutions. Farooq et al. (Reference Farooq, Basra, Hafeez, Asad and Ahmad2005) tested, among other fertilizers, di-ammonium-phosphate as osmoticum for rice seed priming, but also here, seedling dry weights of unprimed controls remained greatest. A more promising strategy than P-priming might be seed coating with rock phosphate (Ros et al., Reference Ros, Bell and White2000). However, their study did not test water-priming as additional control treatment.
Priming had a larger effect on root than shoot growth. A larger root system of primed plants may support greater shoot P and biomass production through enhanced P uptake from the soil as discussed for IR74 +Pup1. Nevertheless, shoot P concentrations tended to remain low, indicating that DJ 123 and Sadri Tor Misri are not efficient in foraging P from the soil. Yet again, P-priming did not enhance shoot P contents compared to water-priming. A greater biomass of plants grown from high-P seeds indicates that seed-borne P may be more efficiently translated into increasing shoot P concentrations and biomass than P supplied by priming.
Conclusions
We observed a generally positive effect of priming, irrespective of genotype and seed attributes. Beneficial effects of P-priming, however, could not be generally confirmed and were restricted to specific genotypes and seeds with low inherent P concentrations. An improved seedling performance was rather associated with a high inherent seed P content and/or the presence of the Pup1 QTL with the OsPSTOL1 gene. Combining genetic and seed management approaches may contribute to enhance rice establishment under P-deficient conditions, but need to be genotype-specific.
Acknowledgements
We thank the German Academic Exchange Service (DAAD) for funding the scholarship of the first author, the Global Rice Science Partnership (GRISP) and the Generation Challenge Program (GCP) for funding the research work, and the Centre for International Migration and Development (CIM) on behalf of the German Federal Ministry for Economic Cooperation and Development (BMZ) for funding the open access publication of this article.


 Open access

