Introduction
The interpopulational genetic structure of most lichen species is poorly known, which is due at least in part to their large distributional ranges and broad habitat diversities. Genetic structure of individual populations has been found to be related to the interaction of climatic and geographical factors, with locally adapted algal and fungal partners (Galloway & Aptroot Reference Galloway and Aptroot1995; Fernández-Mendoza et al. Reference Fernández-Mendoza, Domaschke, García, Jordan, Martín and Printzen2011; Sork & Werth Reference Sork and Werth2014; Werth & Sork Reference Werth and Sork2014; Núñez-Zapata et al. Reference Núñez-Zapata, Cubas, Hawksworth and Crespo2015).
Species in the genus Physconia (Physciaceae, Lecanorales) are foliose macrolichens with heteromeric thalli characterized by a greyish brown upper surface covered by white pruina. The genus consists of c. 30 species, all of them thought to associate with the unicellular green alga Trebouxia as a photobiont (Cubero et al. Reference Cubero, Crespo, Esslinger and Lumbsch2004).
Physconia species are distributed worldwide, except in the tropics (Otte et al. Reference Otte, Esslinger and Litterski2002). Species of the genus occur in a wide range of habitats, some being epiphytic or corticolous growing on various deciduous trees with nutrient-rich bark (e.g. P. perisidiosa (Erichsen) Moberg, P. enteroxantha (Nyl.) Poelt) and others preferring open sunny habitats on rocks, bare soil or bryophytes (e.g. P. muscigena (Ach.) Poelt, P. rossica Urbanav., P. isidiomuscigena Essl.). Physconia species are relatively poor in secondary metabolites. Many species do not contain substances that can be detected by thin-layer chromatography (TLC), a commonly used technique in lichenology (Brodo et al. Reference Brodo, Sharnoff and Sharnoff2001; Moberg Reference Moberg, Ahti, Jørgensen, Kristinsson, Moberg, Søchting and Thor2002; Smith et al. Reference Smith, Aptroot, Coppins, Fletcher, Gilbert and Wolseley2009). However, P. enteroxantha, P. isidiomuscigena and P. kurokawae Kashiw. occasionally contain secalonic acid A, variolaric acid and gyrophoric acid (Esslinger Reference Esslinger2000; Otte et al. Reference Otte, Esslinger and Litterski2002; Chen & Hu Reference Chen and Hu2003).
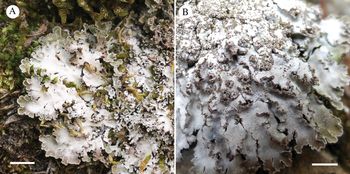
Physconia muscigena grows on substrata having neutral to high pH among mosses or directly on mossy rocks (Fig. 1), in two different ecological habitats; in the xerothermic and temperate lowlands, and in open alpine or arctic environments (Moberg Reference Moberg, Ahti, Jørgensen, Kristinsson, Moberg, Søchting and Thor2002; Türk & Obermayer Reference Türk, Obermayer, Lackovičová, Guttová, Lisická and Lizoň2006). The centre of its distribution is probably in the Northern Hemisphere, with other records reported from South America and South Africa (Thomson Reference Thomson1963; Moberg Reference Moberg1987; Otte et al. Reference Otte, Esslinger and Litterski2002; Chen & Hu Reference Chen and Hu2003; Cubero et al. Reference Cubero, Crespo, Esslinger and Lumbsch2004; Flakus et al. Reference Flakus, Etayo, Schiefelbein, Ahti, Jabłońska, Oset, Bach, Flakus and Kukwa2012).
A, Physconia muscigena. B, P. isidiomuscigena with sorediate-isidiate propagules on the upper surface. Scales = 0.5 mm.

Physconia muscigena is distinguishable from similar species by the lack of vegetative propagules (isidia, soredia). Fragmentation of the thallus represents its only type of vegetative reproduction, which is rather unusual among foliose lichens. Apothecia occur rarely: Esslinger (Reference Esslinger, Nash, Ryan, Gries and Bungartz2002) noted apothecia are ‘common but not rarely missing’. Moberg (Reference Moberg1987) did not observe apothecia in P. muscigena collections from Africa and suggested that apothecia are ‘fairly rare’ among specimens from Finland (Moberg Reference Moberg, Ahti, Jørgensen, Kristinsson, Moberg, Søchting and Thor2002). Nádvorník (Reference Nádvorník1947) did not find fertile specimens from the Czech Republic.
The taxonomy of the genus Physconia is rather outdated. Most comprehensive treatments were written decades ago (Nádvorník Reference Nádvorník1947; Poelt Reference Poelt1957, Reference Poelt1965; Moberg Reference Moberg1977). DNA-based studies have focused only on small sections of the genus. For instance, Physconia muscigena appears to be a polyphyletic taxon (Cubero et al. Reference Cubero, Crespo, Esslinger and Lumbsch2004) and two morphologically similar species pairs (P. venusta/P. perisidiosa and P. detersa/P. distorta) cannot be distinguished by the ITS rDNA marker (Cubero et al. Reference Cubero, Crespo, Esslinger and Lumbsch2004; Lohtander et al. Reference Lohtander, Urbanavichus and Ahti2007).
In the 1940s, Physcia bayeri Nádv. was newly described from the vicinity of Prague (Nádvorník Reference Nádvorník1947). This species, growing on calcareous bedrocks in sunny and warm temperate lowlands, was suggested to differ from Physcia muscigena in having a thinner thallus and a yellow reaction of the medulla in KOH (Nádvorník Reference Nádvorník1947). The reaction was later attributed to the presence of secalonic acid A (Otte et al. Reference Otte, Esslinger and Litterski2002). This species was recombined as Physconia muscigena var. bayeri (Poelt Reference Poelt1957, Reference Poelt1965) and the variety has been generally recognized, although some authors have rejected the taxon without explanation.
Two species were described recently both morphologically and ecologically very similar to Physconia muscigena and P. muscigena var. bayeri: P. rossica from Russia (Lohtander et al. Reference Lohtander, Urbanavichus and Ahti2007) and P. isidiomuscigena reported from the south-western United States (Arizona, California, Colorado, Idaho) and Canada (British Columbia) (Esslinger Reference Esslinger2000; J. Hollinger & C. Björk, personal communication). The phylogenetic position of P. rossica was confirmed by ITS and mtSSU (Lohtander et al. Reference Lohtander, Urbanavichus and Ahti2007); P. isidiomuscigena does not appear in recent phylogenetic studies focused on Physconia. Physconia isidiomuscigena may be distinguished by sorediate-isidiate propagules on the upper surface ridges and laminae (Fig. 1). Ecologically it is similar to P. muscigena, growing on mosses in open sunny habitats (Esslinger Reference Esslinger2000), though it appears to be limited to warmer/drier climates and may be more restricted to calcareous substrata.
Due to the lack of any recent taxonomic treatment of P. muscigena and related species, our study aimed to: 1) determine the phylogenetic relationships of Physconia muscigena var. bayeri, P. muscigena and P. isidiomuscigena and to assess whether P. muscigena var. bayeri forms a phylogenetically separate lineage; 2) elucidate the intraspecific variability of P. muscigena.
Material and Methods
Selected material and chemical analyses
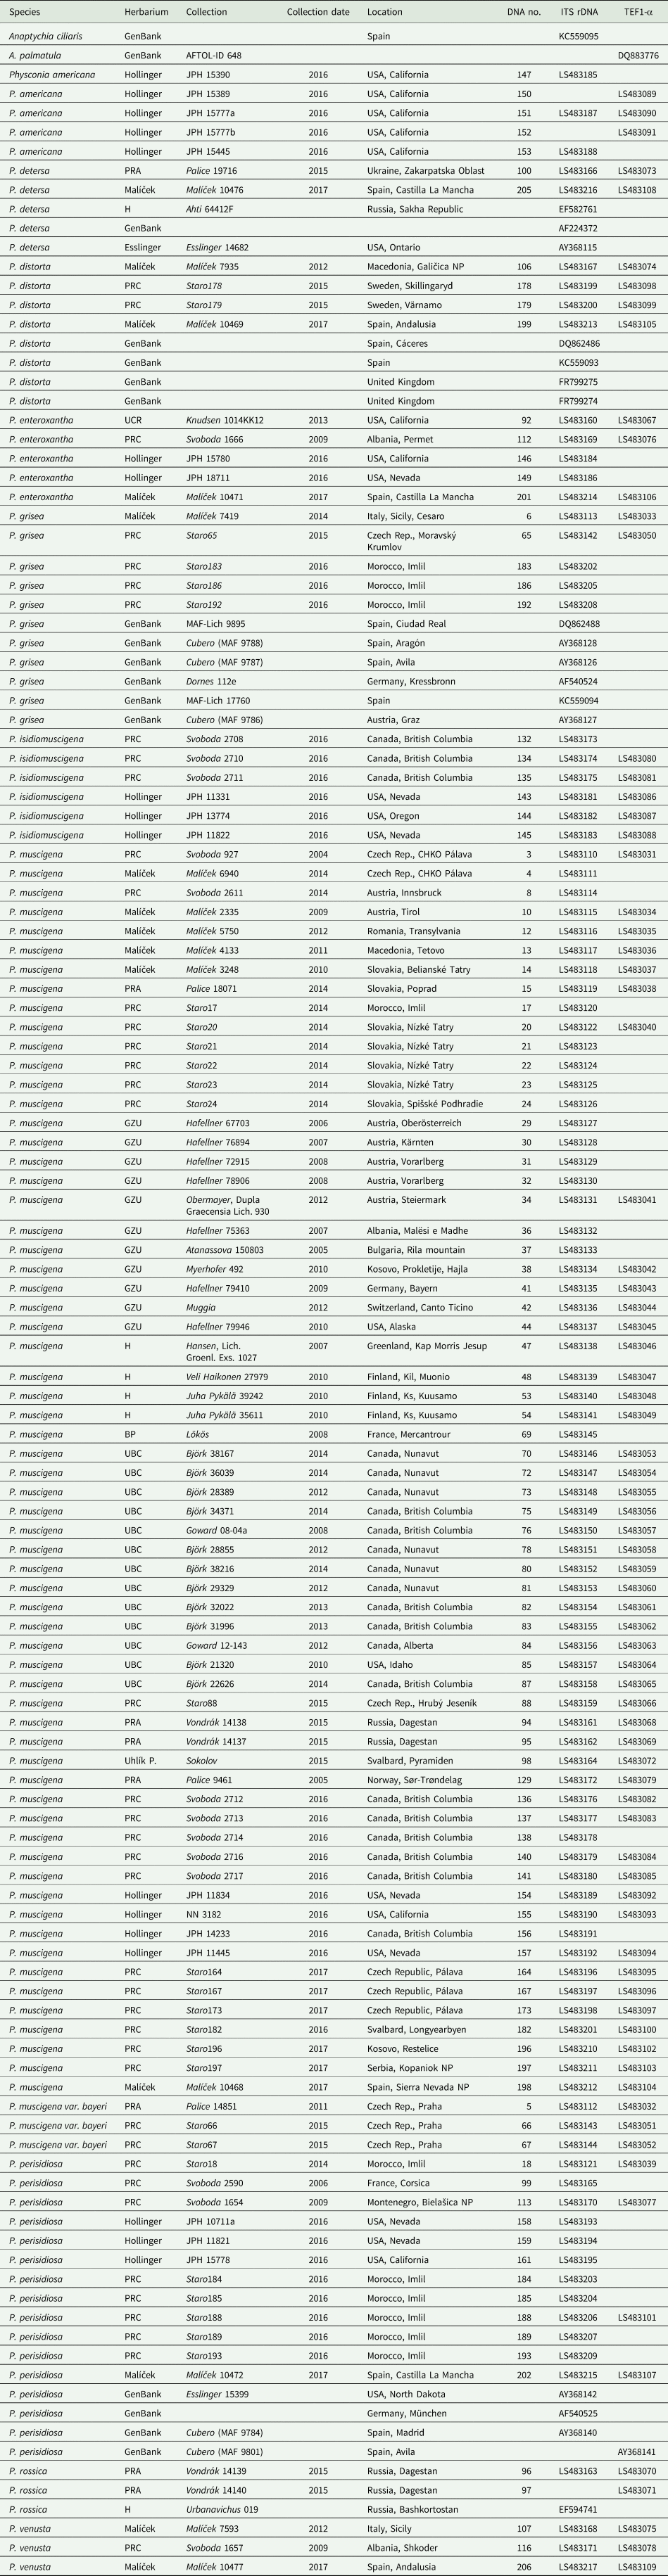
We focused primarily on the European species, in addition to several from North America. We collected fresh material of P. muscigena from European localities in the Czech Republic, Kosovo, Italy, Serbia, Slovakia and Slovenia. Fresh material from North American populations of P. muscigena and P. isidiomuscigena was collected in British Columbia (see Table 1 and Supplementary Material Table S1, available online). Further material of P. muscigena and other species studied was kindly provided by curators from the following herbaria: B, BP, BRA, BRNM, BRNU, GZU, H, OLM, PRA, PRC, PRM, UBC, UCR, UPS and several personal herbaria (Table 1). In the case of Physconia muscigena var. bayeri, specimens collected by Nádvorník were used as comparative material (topotypes PRC2557 and PRM756193) and we examined additional specimens from the type locality (Praha, Butovice; Supplementary Material Table S1, available online).
Specimens of Physconia used for this study. Voucher specimens, location information, herbarium codes and GenBank Accession numbers are also listed. The DNA numbers are unique to this study and function as labels in the phylogenetic trees.
Freshly collected specimens were cleaned to remove other lichen thalli, air-dried and examined under a stereomicroscope. Secondary metabolites of Physconia muscigena, P. muscigena var. bayeri and P. isidiomuscigena were analyzed using thin-layer chromatography (TLC) following the protocol of Orange et al. (Reference Orange, James and White2010). Extracted lichen compounds were transferred onto a set of two glass plates (Merck TLC Silicagel 60 F254) and placed into solvents A and B.
DNA isolation, PCR-amplification and sequencing
Total DNA was extracted from freshly collected as well as herbarium specimens using the Spin Plant Mini Kit (Invitek) according to the manufacturer's protocol. Altogether 113 samples were used for the analyses. We amplified one nuclear ribosomal region (ITS rDNA), one mitochondrial region (mtSSU rDNA), and the nuclear gene coding for translation elongation factor-1α (TEF1-α). Four PCR primer pairs were tested and used for amplification, one of which was newly designed (Table 2). Preliminary testing of TEF1-α primers has shown low success with older specimens; amplification of samples older than 5 years were mostly unsuccessful. This was partially solved by using newly designed TEF1-α primers (Table 2). DNA amplification followed the instructions described in the polymerase manufacturer's protocols (MyTaq Bioline). PCR products were cleaned with AMPure XP (Agencourt®), then sequenced with the BigDye Terminator v3.1 Cycle Sequencing Kit (Applied Biosystems), followed by analysis with an Applied Biosystems 3500 Genetic Analyzer.
Loci used for molecular analyses, with corresponding primer sequences and literature references.

Sequence alignments
The final dataset consisted of 271 newly generated sequences from this study and 20 sequences obtained from GenBank (Table 1). Sequences were subjected to BLAST searches to confirm their identities. Only high quality sequences were used for phylogenetic analyses. Sequences were manually edited using BioEdit 7.2.5 (Hall Reference Hall1999) and FinchTV 1.4.0 (Geospiza Inc., Seattle, WA, USA). Sequences were automatically aligned with MEGA7 using the MUSCLE algorithm (Kumar et al. Reference Kumar, Stecher and Tamura2016). All new sequences were deposited in GenBank (Table 1).
Phylogenetic analyses
We analyzed three datasets: ITS rDNA, mtSSU rDNA and TEF1-α. The number of variable and parsimony-informative sites is summarized in Table 3. We did not use a combined dataset because ITS rDNA and TEF1-α regions showed different evolutionary histories based on the ILD test (P = 0.002) performed using PAUP v. 4.0b10 (Swofford Reference Swofford2002). Tree graphics were created using the program FigTree v1.3. (http://tree.bio.ed.ac.uk/software/figtree/). Phylogenetic analyses were performed by Bayesian inference (BI) using MrBayes 3.1.2 (Ronquist et al. Reference Ronquist, Teslenko, van der Mark, Ayres and Darling2012) and maximum likelihood analysis (ML) was performed using the software MEGA7 (Kumar et al. Reference Kumar, Stecher and Tamura2016). The best-fit substitution model for each gene was determined using the Bayesian information criterion (BIC) in jModelTest v. 2.1.5 (Darriba et al. Reference Darriba, Taboada, Doallo and Posada2012) for BI analyses. BIC was TrNef + G for all datasets. Substitution models for ML analyses were K2 + I, T92 and K2 + G, respectively and the analyses ran 1000 replicates for branch support. For the BI analyses, we performed two independent runs of 5 000 000 generations, each with four incrementally heated simultaneous Markov chains and the first 25% of samples discarded as burn-in; the remaining trees were used to compute a 50% majority-rule consensus tree with posterior probabilities as Bayesian branch support. The average standard deviation of split frequencies estimating convergence reached the level of 0.004, 0.07 and 0.006 at the end of the analysis of ITS rDNA, mtSSU rDNA and TEF1-α, respectively.
Characterization of sequence datasets used in the molecular analyses.

We used the closely related genus Anaptychia as outgroup for all analyses.
Haplotype network analysis
Haplotype networks for ITS and TEF1-α were inferred with the program PopART (Leigh & Bryant Reference Leigh and Bryant2015). We used TCS network analysis for haplotype relationship assessment and visualized geographical range and the presence of any secondary substances in these networks (PopART; Leigh & Bryant Reference Leigh and Bryant2015).
Results
TLC analysis
We analyzed 253 herbarium specimens of Physconia and detected a new secondary metabolite that is present in the majority of specimens (in 138 of 234 P. muscigena specimens, 8 of 9 P. muscigena var. bayeri and in 5 of 9 P. isidiomuscigena specimens). The exact chemical structure is unknown and it is neither a fatty acid nor a terpenoid. The substance does not match any of the commonly used TLC standards in lichenology (Orange et al. Reference Orange, James and White2010). We did not detect secalonic acid A.
Molecular analyses
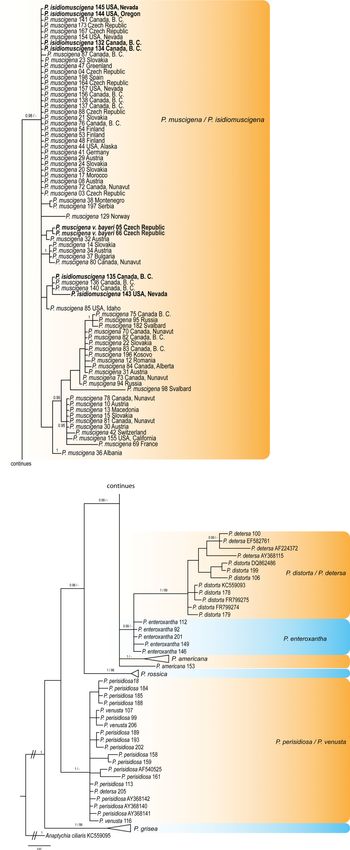
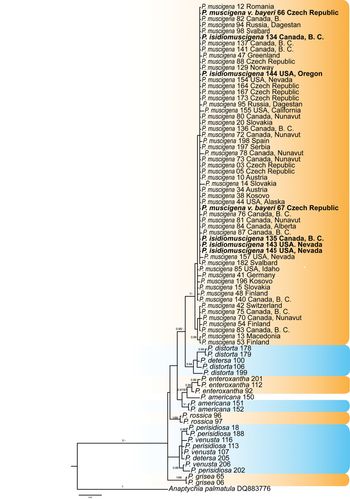
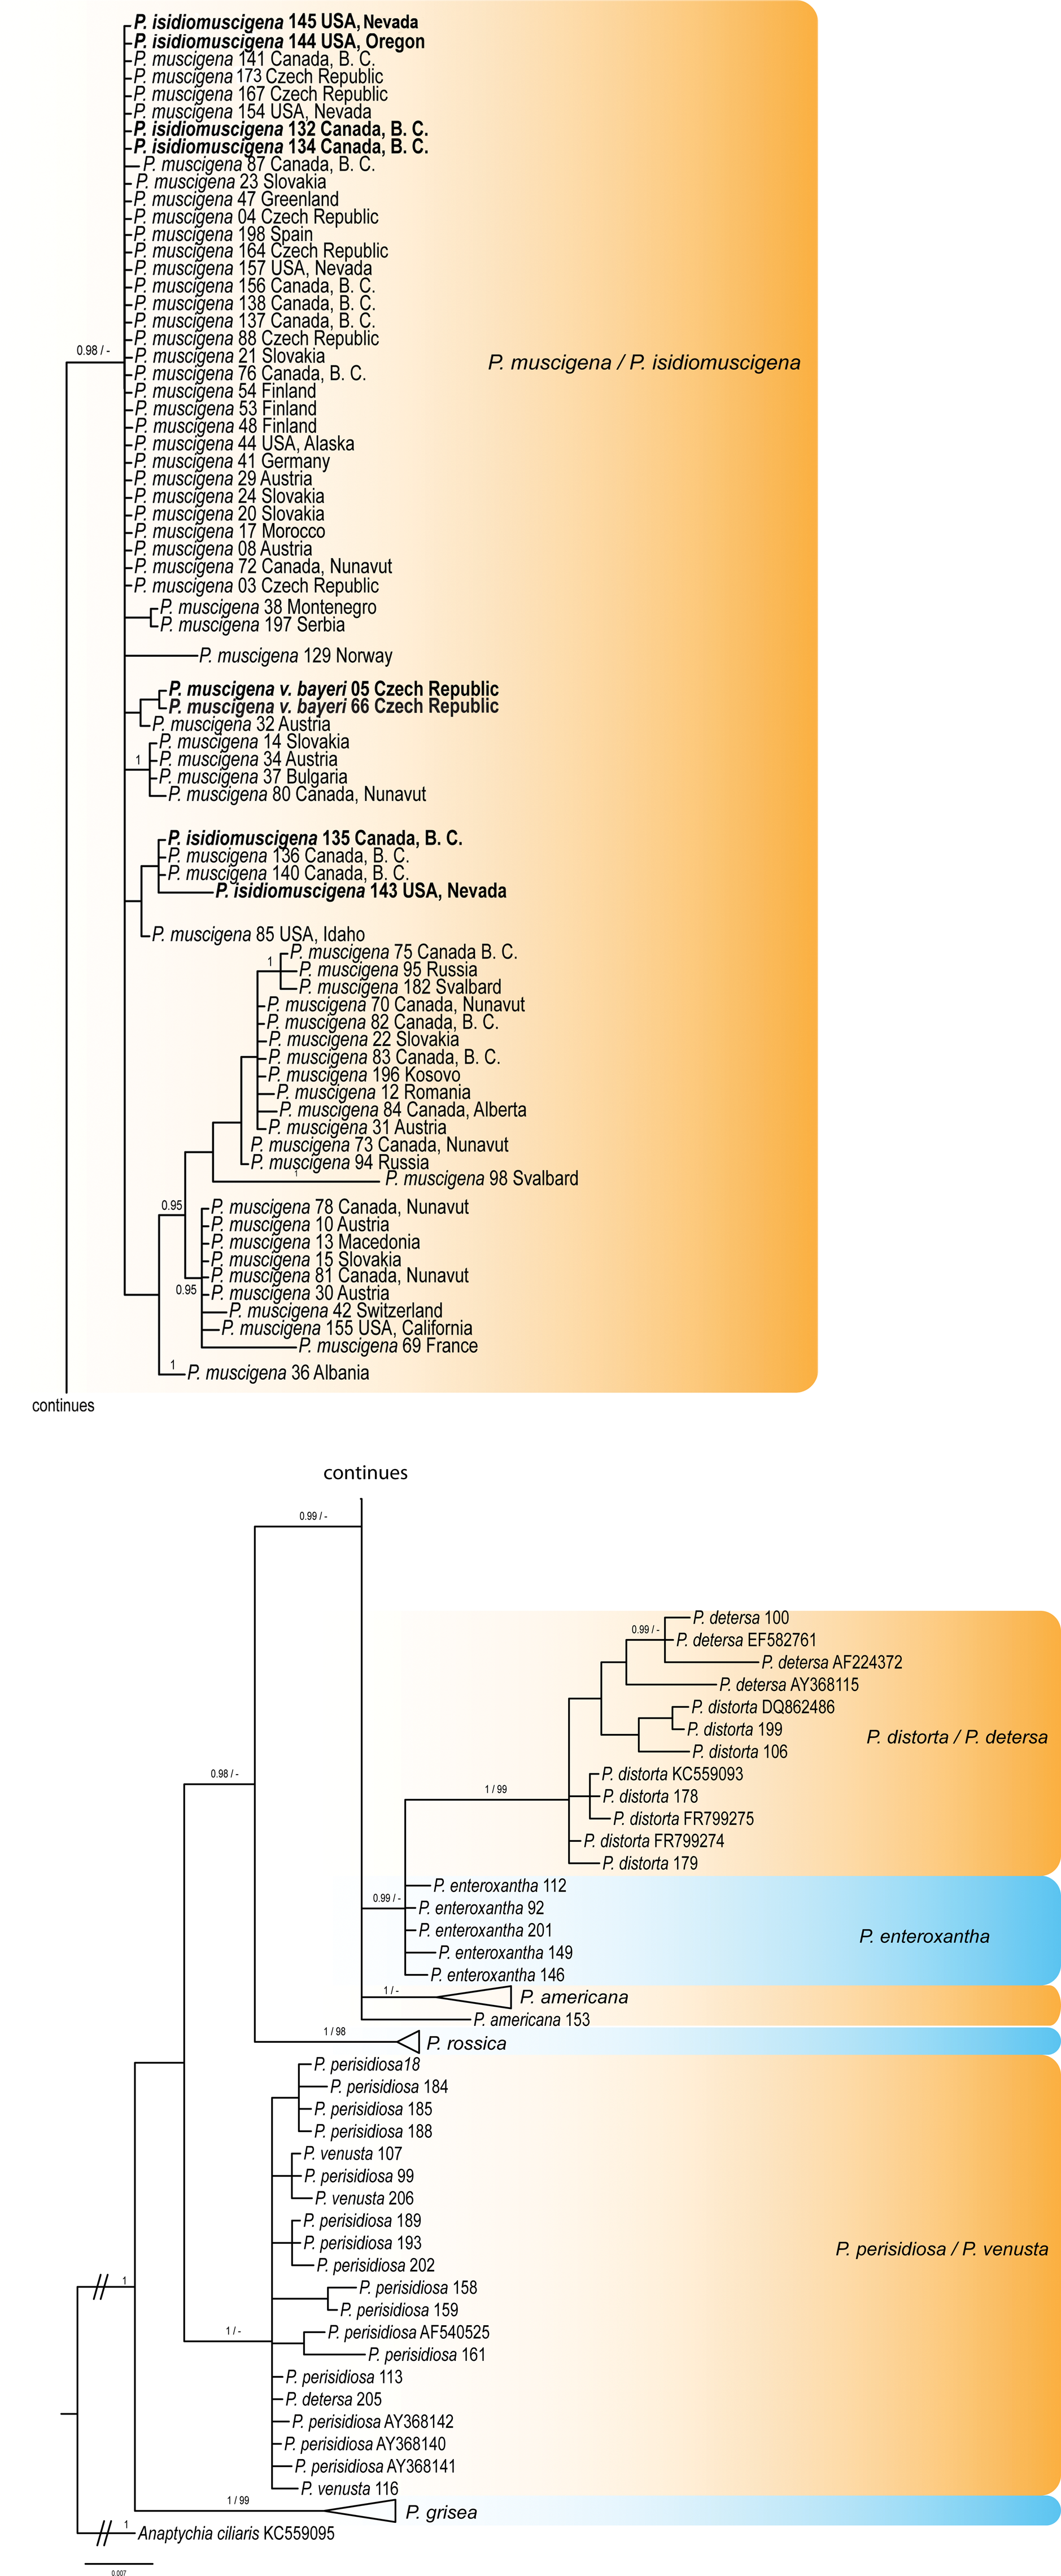
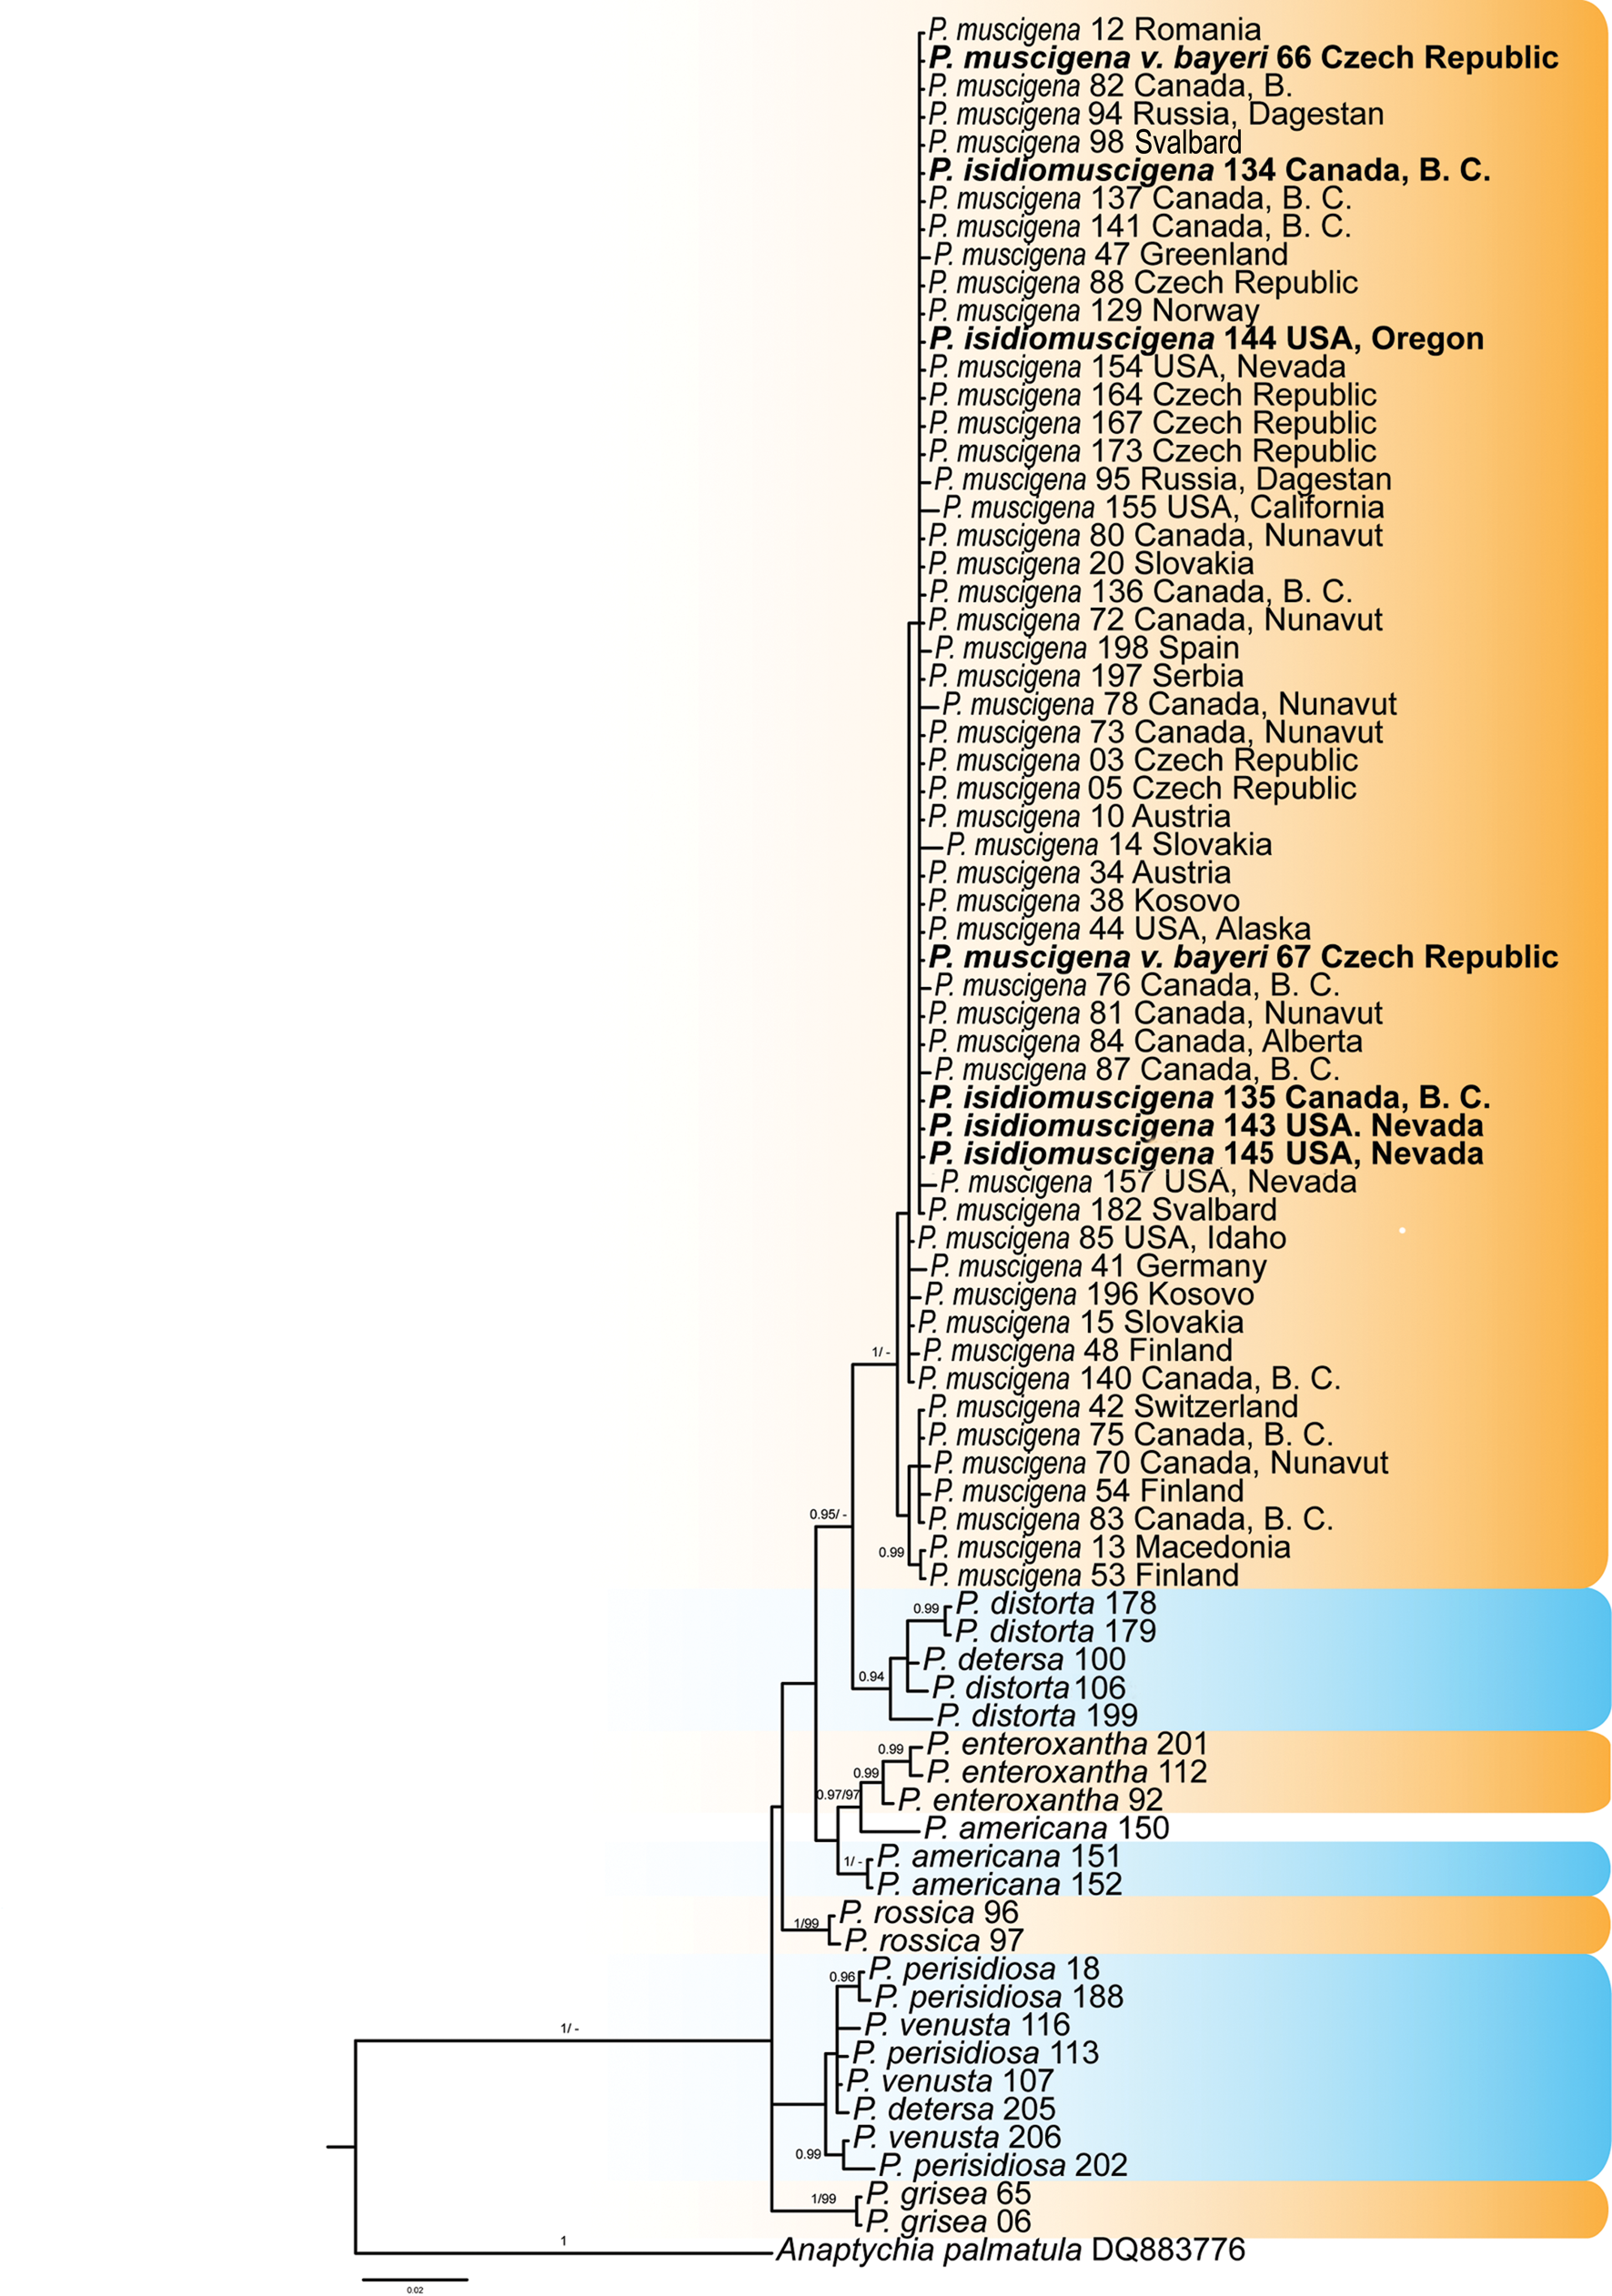
Phylogenetic reconstruction shows large genetic variation in the Physconia muscigena group in the ITS rDNA and TEF1-α datasets. The P. muscigena group is well supported as a monophyletic clade. Physconia muscigena var. bayeri and P. isidiomuscigena appear together with P. muscigena (Figs 2 & 3). These three taxa cannot be distinguished on the basis of ITS rDNA, mtSSU rDNA and TEF1-α sequences.
Majority-rule consensus tree produced by the Bayesian (BI) and maximum likelihood (ML) analyses of the ITS rDNA sequences of Physconia species. Support values (BI/ML) are given above the branches. Physconia muscigena var. bayeri and P. isidiomuscigena sequences are in bold. Information for the sequences used are given in Table 1 and Supplementary Table S1 (available online). The tree is rooted with Anaptychia ciliaris. In colour online.
Majority-rule consensus trees produced by the Bayesian (BI) and maximum likelihood (ML) analyses of the TEF1-α sequences of Physconia species. Support values (BI/ML) are given above the branches. Physconia muscigena var. bayeri and P. isidiomuscigena sequences are in bold. Information for the sequences used are given in Table 1 and Supplementary Table S1 (available online). The tree is rooted with Anaptychia palmatula. In colour online.
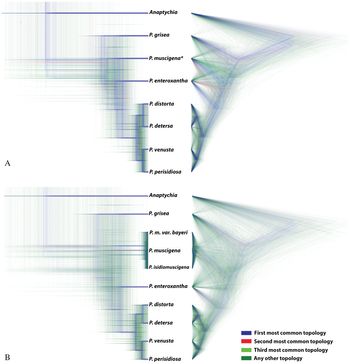
We observed some differences in the topology of the gene trees. There were also differences in statistical support of some nodes when comparing the results of the ML and BI analysis of each dataset. These differences were visualized in the DensiTree - ITS rDNA + TEF1-α dataset (Bouckaert Reference Bouckaert2010) (Fig. 4). The combination where P. muscigena, P. muscigena var. bayeri and P. isidiomuscigena were put together showed more relevant topology (Fig. 4A).
Species tree inferred with *BEAST visualized using DensiTree (Bouckaert Reference Bouckaert2010): ITS rDNA + TEF1-α dataset. All trees created in the analysis are displayed (burn-in 25%). There are five clearly distinguishable clades, with large uncertainty of the topologies within the one 4-leaf clade of closely related species (distorta-detersa-venusta-perisidiosa). Analysis showed a different topology when P. muscigena* (including var. bayeri and P. isidiomuscigena) was used as one species (A), and when P. muscigena, P. muscigena var. bayeri and P. isidiomuscigena were included as different species (B).

These three taxa have been delimited based on morphology, chemistry and distribution. However, neither the presence of specific secondary metabolites nor geographical patterns correlate with the topology of the phylogenetic tree. Physconia muscigena var. bayeri has no distinct differences in morphology to the nominal variety and does not contain different chemical substances. The only other distinction reported is its distribution in lowlands. However, it is now clear that P. muscigena also commonly grows in temperate lowlands (see Supplementary Material Table S1, available online). Physconia isidiomuscigena can be distinguished from P. muscigena by the presence of sorediate-isidiate propagules on its upper surface but, in our gene trees, this morphological trait appears ungrouped in various termini, not in a monophyletic clade. Likewise, geography and ecological characteristics do not segregate in our gene trees.
In this study, the TEF1-α region was used for the first time in the genus Physconia. Our results show rather low variability of nucleotide sequences compared to the ITS region, but they do successfully separate individual species. On the other hand, the mtSSU marker showed low interspecies variability (Table 3) and was not suitable to resolve species boundaries. Therefore, we did not use the mtSSU marker in the subsequent molecular analyses. Further results show that P. perisidiosa/P. venusta were not supported as separate species based on ITS rDNA and TEF1-α sequences. The same has been shown in the P. detersa/P. distorta clade (Figs 2, 3 & 4).
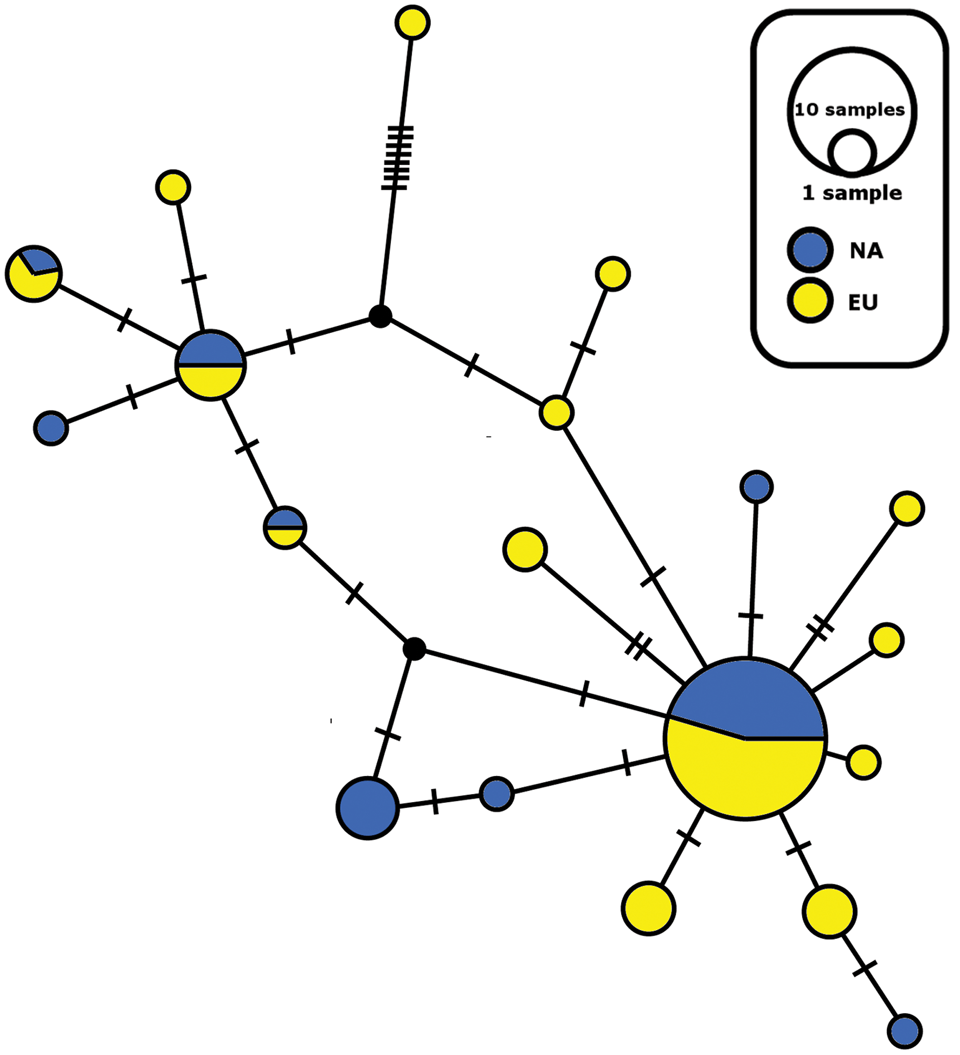
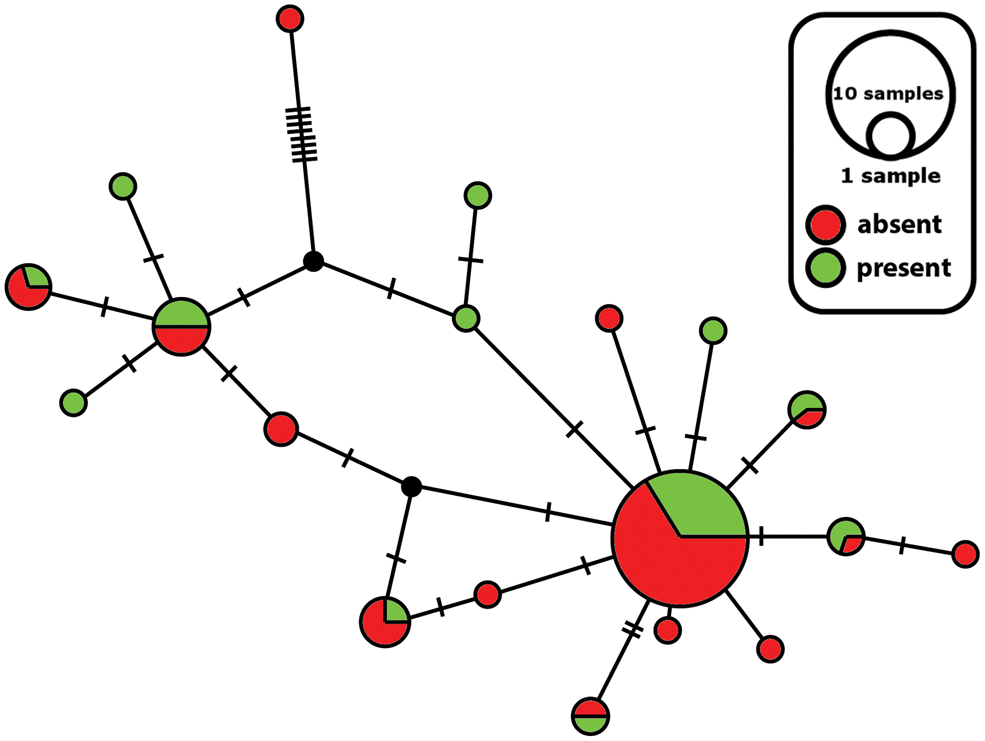
The sampled material of Physconia muscigena includes 19 different ITS haplotypes in 71 samples (Figs 5 & 6). The network consists of one main clade containing 37 haplotypes, and 18 minor clades that contain 1–6 sequences. The TEF1-α network showed 15 different haplotypes in 62 samples, with the main clade containing 40 haplotypes (Supplementary Material Figs S1 & S2). In the main clade, there are haplotypes with mixed geographical distributions and a presence or absence of secondary metabolites (see above). In both cases, haplotype structures could not be explained on the basis of secondary metabolites or geography (Figs 5 & 6, Supplementary Material Figs S1 & S2). Some haplotypes of P. isidiomuscigena are nested within the ancestral clade P. muscigena.
Haplotype ITS network for Physconia muscigena; distribution of North American (NA) and European (EU) haplotypes. The size of the circles is approximately proportional to the number of sampled sequences of that haplotype, with the largest circle representing the ancestral clade. Perpendicular lines show mutation steps. In colour online.
Haplotype ITS network for Physconia muscigena; presence of secondary metabolites in thallus. The size of the circles is approximately proportional to the number of sampled sequences of that haplotype, with the largest circle representing the ancestral clade. Perpendicular lines show mutation steps. In colour online.
Discussion
Genetic variation of Physconia muscigena
Our results show large genetic variation variability in the P. muscigena complex (Figs 2 & 3). This variability does not match the geographical distribution of analyzed samples, in contrast to, for example, Biatora helvola (Printzen et al. Reference Printzen, Lumbsch, Schmitt and Feige1999), Bryoria fremontii (Velmala et al. Reference Velmala, Myllys, Halonen, Goward and Ahti2009), Ramalina menziesii (Sork & Werth Reference Sork and Werth2014) or Parmelina tiliacea (Núñez-Zapata et al. Reference Núñez-Zapata, Cubas, Hawksworth and Crespo2015). Authors of these studies found separated molecular lineages that correlated to portions of the geographical distribution of the species. Furthermore, in these studies ecology and secondary metabolite characters also did not segregate into clades on the gene trees. The factors that regulate the mode of reproduction and production of secondary metabolites in lichen individuals remain unknown.
Some studies have shown that geographical patterns and molecular markers cannot be used for delimiting species complexes/pairs which differ only in reproduction modes (Myllys et al. Reference Myllys, Lohtander and Tehler2001; Articus et al. Reference Articus, Mattsson, Tibell, Grube and Wedin2002; Messuti et al. Reference Messuti, Passo, Scervino and Vidal-Russell2016).
The Physconia muscigena group contains 19 distinct ITS haplotypes of 71 samples (Figs 5 & 6). We found members of identical haplotypes from different geographical regions (Europe and Canada) together in the ancestral clade (Fig. 5). Some minor clades contain only a single sequence. We observed the same situation in the case of the TEF1-α network (Supplementary Material Figs S1 & S2, available online). Printzen et al. (Reference Printzen, Ekman and Tønsberg2003) found similar results for Cavernularia hultenii (Parmeliaceae), where ancestral clades contained haplotypes from different geographical regions. Their dataset contained 49 different haplotypes across 62 populations with two main clades. The authors explained the extant disjunction of C. hultenii by fragmentation of a formerly coherent distribution with long-distance dispersal and recurrent diaspore exchange. This fragmentation caused incomplete removal of ancestral haplotypes from the post-fragmentation and post-expansion areas by slow genetic drift (Printzen et al. Reference Printzen, Ekman and Tønsberg2003). In the case of P. muscigena, after the last glacial period the species’ geographical range could have expanded into newly ice-free treeless areas with calcium-rich bare soils. With subsequent progressive climate warming during the continuing post-glacial period, suitable habitats diminished in area and P. muscigena now survives only in fragmented refugia. This could result in the reduction of sexual reproduction and formation of fragmented isolated populations not connected by long-distance dispersal (Zoller et al. Reference Zoller, Lutzoni and Scheidegger1999). Hence we think it is possible that previously widely distributed haplotypes of P. muscigena occurring in the Northern Hemisphere could be found in small isolated populations persisting across the species’ geographical range. Simultaneously, some haplotypes could perish while others expand geographically. Genetic drift and/or shifting climatic conditions could cause the changes in the frequency of sexual and vegetative reproduction, which is, in the case of P. muscigena, towards vegetative reproduction. Further analyses of haplotypes from the Southern Hemisphere could help elucidate global patterns in genetic structure that are not clear in the current, more limited dataset.
Phylogenetic position of Physconia isidiomuscigena
Physconia isidiomuscigena differs from P. muscigena by the production of sorediate-isidiate propagules (Esslinger Reference Esslinger2000). There are no other morphological or anatomical differences present, and we also did not find any molecular difference. Our samples of P. isidiomuscigena did not form a separate monophyletic clade (Figs 2 & 3). The existence of two forms of one species differing by their reproductive strategy is not unknown in lichens; for example, Peltigera didactyla may have sorediate and apotheciate thalli, and non-sorediate apotheciate thalli are commonly intermixed among sorediate sterile thalli within populations (Goffinet et al. Reference Goffinet, Miadlikowska and Goward2003). Another example is Pseudocyphellaria pilosella (Messuti et al. Reference Messuti, Passo, Scervino and Vidal-Russell2016) which has sorediate as well as apotheciate forms that usually lack soredia. Tehler (Reference Tehler1982) asserted that the sterile forms in these species pairs should not be regarded as species in the strict sense but rather as asexual clones developed from a mother species with the potential for both sexual and asexual propagation. On the other hand, some authors consider different types of reproduction to be taxonomically important; we therefore recombine P. isidiomuscigena as a variety of P. muscigena (see below).
Physconia muscigena var. isidiomuscigena (Essl.) Starosta & D. Svoboda comb. et stat. nov.
MycoBank No.: MB 830984
Physconia isidiomuscigena Essl., Bull. Calif. Lichen Soc. 7, 5 (2000); type: USA, Arizona, Coconino Co., Grand Canyon National Park, Nash 30843 (ASU—holotype; TLE—isotype).
Phylogenetic position of P. muscigena var. bayeri
In our analysis, the ITS rDNA and TEF1-α sequences of Physconia muscigena var. bayeri grouped together with other P. muscigena sequences, but did not form a well-supported isolated clade (see Figs 2 & 3).
In the original description of P. muscigena var. bayeri, Nádvorník (Reference Nádvorník1947) noted the yellow reaction of the medulla in KOH without identifying the substance responsible for the reaction. Otte et al. (Reference Otte, Esslinger and Litterski2002) attributed the yellow reaction to the presence of secalonic acid A. This substance is also known to be present in several other Physconia species. Otte et al. (Reference Otte, Esslinger and Litterski2002) did not describe in detail the method used to identify the substance. In this study we examined 262 Physconia muscigena/isidiomuscigena specimens from 25 countries using TLC and we did not detect secalonic acid A in any of the specimens studied. Other treatments also do not mention its presence (Moberg Reference Moberg1987, Reference Moberg, Ahti, Jørgensen, Kristinsson, Moberg, Søchting and Thor2002; Andreev et al. Reference Andreev, Dobrysh, Golubkova, Himebrant, Kataeva, Kotlov, Makarova, Titov, Tolpysheva and Urbanavichene2008). Therefore, we assume that previous records of this acid in the thalli of P. muscigena were based on occasional observations only and that the substance is of rare and sporadic occurrence.
We did not find any morphological or chemical differences between P. muscigena and P. muscigena var. bayeri, and because in our gene trees specimens of the two taxa do not form distinct groups, we synonymize P. muscigena var. bayeri with P. muscigena. Nádvorník (Reference Nádvorník1947) used the yellow reaction of the medulla in KOH to distinguish var. bayeri from P. muscigena, although P. muscigena can have a positive reaction in some populations (Esslinger Reference Esslinger, Nash, Ryan, Gries and Bungartz2002). As we could not verify this yellow reaction of var. bayeri (including in the Nádvorník reference collections) using TLC, we do not consider this difference taxonomically relevant.
Physconia muscigena (Ach.) Poelt
Nova Hedwigia 9(1–4), 30 (1965).—Physconia muscigena var. muscigena (Ach.) Poelt, Nova Hedwigia 9(1–4), 30 (1965).—Parmelia muscigena Ach., Lich. Univ., 472 (1810); type: H-ACH 1406A (lectotype, designated by Moberg Reference Moberg1977).
Physconia muscigena var. bayeri (Nádv.) Poelt, Nova Hedwigia 9(1–4), 30 (1965).—Physcia muscigena var. bayeri (Nádv.) Poelt, Mitteleuropäische Flechten IV, 279 (1957).—Physcia bayeri Nádv., Studia Botanica Čechoslovaca VIII, 124 (1947); type: PRC 4596 (MBT 389440, neotype designated here; MB354287), leg. by Z. Černohorský 1931, det. by J. Nádvorník.
Note
The type specimens mentioned by Nádvorník (Praha-Nová Ves et Motol (Bayer, Servít!)) were not found in any herbarium (PRC, PRM or BRA) where Nádvorník's collections are deposited. Therefore, we chose the well-developed specimen from the same locality in Prague, which was determined by J. Nádvorník himself, as a neotype. The collections from Nádvorník's Physciaceae exsiccati (Dec. 2, No. 18) could be considered as topotypes.
Our investigations of P. muscigena and related species did not contain samples from the Southern Hemisphere. Including additional populations throughout the distributional range of these taxa would probably provide further biogeographical insights and could help to disentangle phylogenetic relationships among the species studied. In addition, employing next generation sequencing methods could shed light on population structure (RAD-Seq, SNP, SSR).
Acknowledgements
We express our gratitude to Curtis Björk, Trevor Goward, Jason Hollinger, Jiří Malíček, Zdeněk Palice, Ondřej Peksa, Petr Uhlík, Jan Vondrák, and the curators of the indicated herbaria for generously providing specimens for this study. We also thank František Bouda for invaluable help during the fieldwork. Adéla Čmoková is acknowledged for her kind help during the laboratory work and Ondřej Koukol, Jana Steinová and Mats Wedin for useful comments on the manuscript. We thank Curtis Björk for linguistic corrections and valuable comments. The senior author thanks Tereza Hromádková for personal support. This study was supported by Charles University research project No. 958217.
Author ORCIDs
Jakub Starosta, 0000-0001-5431-9795; David Svoboda, 0000-0002-5619-636X.
Supplementary Material
To view supplementary material for this article, please visit https://doi.org/10.1017/S0024282920000134