INTRODUCTION
Heincke (Reference Heincke1913) was among the first to report that body size of fish can increase with depth. Heincke's research on the European plaice, Pleuronectes platessa Linnaeus 1758, a demersal flatfish in the North Sea, was elevated to the status of a law by Wimpenny (Reference Wimpenny1953) (Gibson et al., Reference Gibson, Robb, Burrows and Ansell1996) and this positive size–depth relation has since been reported for many other fish (e.g. Macpherson & Duarte, Reference Macpherson and Duarte1991; Merrett & Haedrich, Reference Merrett and Haedrich1997; Moranta et al., Reference Moranta, Massutı, Palmer and Gordon2007).
Macpherson & Duarte (Reference Macpherson and Duarte1991) examined data on numerous demersal fish from the south-eastern Atlantic and north-western Mediterranean and reported significant size–depth relationships for most species examined. They proposed that the positive size–depth pattern reflects an active or passive movement towards deeper water during ontogeny where fish benefit from extended lives and lower metabolism. Other studies have demonstrated that this pattern is not universal (Stefanescu et al., Reference Stefanescu, Rucabado and Lloris1992; Moranta et al., Reference Moranta, Palmer, Massutı, Stefanescu and Morales-Nin2004; Collins et al., Reference Collins, Bailey, Ruxton and Priede2005).
A positive size–depth relationship appears to be more common in some taxonomic groups such as the Gadiformes and weaker in other groups such as the genus Raja and Anguilliformes (Haedrich & Polloni, Reference Haedrich and Polloni1976; Macpherson & Duarte, Reference Macpherson and Duarte1991; Stephanescu et al., 1992; Moranta et al., Reference Moranta, Massutı, Palmer and Gordon2007). Within the Gadiformes, several species exhibit bathymetric separation with larger adults occurring in deeper, offshore waters and with smaller juveniles occurring in shallow nearshore nursery habitats. These include Urophycis tenuis (Mitchill, 1814), Gadus morhua Linnaeus, 1758, Merlangius merlangus, (Linnaeus, 1758), Trisopterus minutus, (Linnaeus, 1758), Melanogrammus aeglefinus (Linnaeus, 1758) and Pollachius virens (Linnaeus, 1758) (Markle et al., Reference Markle, Methven and Coates-Markle1982; Rangeley & Kramer, Reference Rangeley and Kramer1995; Gibson et al., Reference Gibson, Robb, Burrows and Ansell1996; Methven & Schneider, Reference Methven and Schneider1998; Methven et al., Reference Methven, Haedrich and Rose2001). Within the Gadidae, bathymetric separation is probably best shown for juvenile Gadus morhua Atlantic cod, off eastern Canada. Age 0 G. morhua occur almost exclusively in shallow coastal water off Newfoundland with age 1 cod extending further offshore onto the continental shelf (Dalley & Anderson, Reference Dalley and Anderson1997; Methven & Schneider, Reference Methven and Schneider1998; Laurel et al., Reference Laurel, Gregory and Brown2003). Larger juveniles (age > 2) are widely distributed on the shelf (Riley & Parnell, Reference Riley, Parnell, Dahl, Danielssen, Mokness and Solemdal1984; Dalley & Anderson, Reference Dalley and Anderson1997). Swain (Reference Swain1993) observed that the mean age of the largest Atlantic cod continued to increase with depth based on 20 years of data from annual bottom-trawl surveys in the southern Gulf of St Lawrence.
The main objective of this study is to determine whether the positive size–depth relationship that has been observed for many demersal continental shelf fish species also applies to the fourbeard rockling Enchelyopus cimbrius, (Linnaeus, 1766) in the southern Gulf of St Lawrence and Cabot Strait off eastern Canada. Enchelyopus cimbrius is a small, benthic, cod-like fish inhabiting the continental shelves and slopes of the western and eastern North Atlantic at depths from 20–650 m (Cohen & Russo, Reference Cohen and Russo1979; Scott & Scott, Reference Scott and Scott1988). It occurs off Newfoundland and southern Labrador, in the Gulf of St Lawrence, Scotian Shelf and Bay of Fundy (Scott & Scott, Reference Scott and Scott1988). The southern limit in the western Atlantic is Florida and the northern Gulf of Mexico (Cohen & Russo, Reference Cohen and Russo1979; Collette & Klein-McPhee, Reference Collette and Klein-McPhee2002). Enchelyopus cimbrius is strongly orientated towards the bottom where it inhabits burrows of mud (Keats & Steele, Reference Keats and Steele1990; Collette & Klein-McPhee, Reference Collette and Klein-McPhee2002). Observations based on shallow SCUBA dives indicate E. cimbrius hides in burrows during the day and emerges at night to forage (Keats & Steele, Reference Keats and Steele1990). The ecology and biology of E. cimbrius is not well known because of its small size, cryptic behaviour and its lack of economic importance (Cohen & Russo, Reference Cohen and Russo1979; Scott & Scott, Reference Scott and Scott1988; Collette & Klein-McPhee, Reference Collette and Klein-McPhee2002).
The relatively small body size (30–40 cm) and long dorsal and anal fins that extend almost to its rounded caudal fin suggest that this eel-like fish is a slow and weak swimmer (e.g. Barton, Reference Barton2007). Consequently, E. cimbrius is not reported to make extensive migrations, only limited inshore and offshore movements (Svetovidov, Reference Svetovidov1948). This sedentary lifestyle, further supported by SCUBA observations of E. cimbrius inhabiting tubes burrowed in mud (Keats & Steele, Reference Keats and Steele1990), leads to the prediction that this cryptic and solitary species may not exhibit a positive body size–depth relationship in the southern Gulf of St Lawrence where the distance–depth gradient is relatively uniform. The body size–depth relationship is predicted to be stronger in the deeper waters of the continental slope (Cabot Strait) because of the steeper depth gradient and shorter distances to a greater depth.
A second objective is to examine depth, temperature and salinity to determine if E. cimbrius is broadly or narrowly distributed with respect to these abiotic factors. The time of day when E. cimbrius were caught will also be examined given that it is reported to be nocturnal in shallow coastal waters off Newfoundland (Keats & Steele, Reference Keats and Steele1990).
MATERIALS AND METHODS
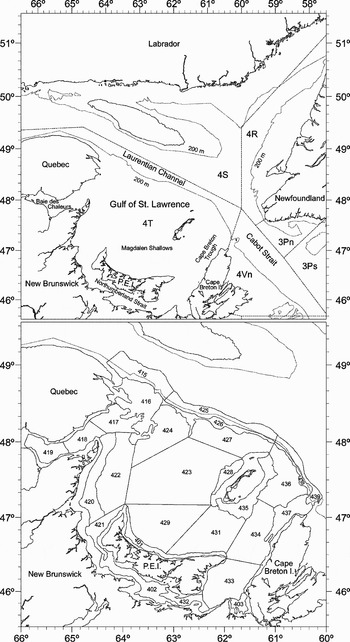
This study is based on research vessel survey data collected by Fisheries and Oceans Canada (DFO). Data for the southern Gulf of St Lawrence covered 32 years of bottom-trawl surveys from 1971–2002 (Northwest Atlantic Fisheries Organization (NAFO) Division 4T). Data for the Cabot Strait were limited to four years of bottom-trawl surveys conducted from 1994–1997 (NAFO Divisions 3P, 4R, 4S, 4T and 4V) (Table 1). Data were collected during September in the southern Gulf of St Lawrence and during January in the Cabot Strait. The southern Gulf of St Lawrence survey data were collected using a stratified random sampling design with the location of sampling sites within 27 strata determined randomly (Figure 1). Large strata received proportionally more sampling sites. Each stratum represented a relatively homogeneous area with a similar depth-range and substrate type (Hurlbut & Clay, Reference Hurlbut and Clay1990). In the surveys of the Cabot Strait (Figure 1), a stratified random design was used in 1994 only, and a fixed station (grid) design was used from 1995–1997 (Campana et al., Reference Campana, Chouinard, Hanson and Frechet1999).
Survey areas for the annual bottom-trawl survey of the southern Gulf of St Lawrence (September 1971–2002) and Cabot Strait (January 1994–1997) with place names, NAFO divisions and subdivisions (upper) and stratification scheme (lower).

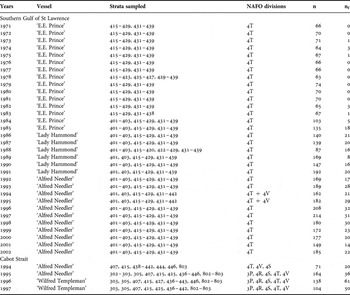
Summary of Fisheries and Oceans Canada data analysed in this study from the southern Gulf of St Lawrence and Cabot Strait.

n, number of sites sampled; nf, number of sites with Enchelyopus cimbrius.
Three vessels were used over the 32 years of sampling in the southern Gulf of St Lawrence. The ‘E.E. Prince’ sampled the southern Gulf of St Lawrence from 1971–1985 (63–135 sites sampled each year). The ‘E.E. Prince’ used a Yankee-36 bottom trawl with a 6.4 mm mesh liner in the codend and sampled only during daylight hours. The ‘Lady Hammond’ was the survey vessel (87–192 sites sampled each year) from 1986 until 1991 and the ‘Alfred Needler’ (149–214 sites sampled each year) surveyed the southern Gulf of St Lawrence from 1992–2002 (Table 1). The ‘Lady Hammond’ and ‘Alfred Needler’ used a Western IIA bottom-trawl with a 19 mm mesh liner in the codend and both vessels sampled 24 hours per day. Each haul of the bottom-trawl was made at a ship's speed of 3.5 knots for a duration of 30 minutes (mean = 29.26 minutes, ±2.44 SD). The mean depth was calculated from the minimum and maximum depths sampled during each haul from 1971–1985. From 1986–2002, the mean depth was calculated as the average of the start and end depths of each haul of the bottom-trawl. Further details of the southern Gulf of St Lawrence surveys were reported by Hurlbut & Clay (Reference Hurlbut and Clay1990) and Benoît & Swain (Reference Benoît and Swain2003b).
As mentioned above, there were changes in the sampling gear and research vessels, as well as changes in the time of day at which sampling took place over the 32-year time series of the annual survey of the southern Gulf of St Lawrence. Benoît & Swain (Reference Benoît and Swain2003a, Reference Benoît and Swainb) analysed data from this survey and made recommendations for adjusting the data to correct for changes in research vessel, gear or sampling time. Benoît & Swain (Reference Benoît and Swain2003a, Reference Benoît and Swainb) found that fourbeard rockling were more catchable at night, with the effect being more pronounced in shallow depths, and documented depth-dependent correction factors (vessel-dependent in some cases) to account for the diel variability in catchability. These correction factors were not used in this study because we wanted to examine diel differences in catches and it was not our intention to make inter-annual comparisons or inferences (i.e. our data were pooled).
Data from four years of surveys in the Cabot Strait, located between Cape Breton Island and Newfoundland were included in this study because this slope water region is deeper than the continental shelf of the southern Gulf of St Lawrence. Two vessels were used: the ‘Alfred Needler’ in 1994 and 1995 and the ‘Wilfred Templeman’ in 1996 and 1997 (Table 1). The ‘Alfred Needler’ used a Western IIA trawl that was towed at a ship's speed of 3.5 knots for 30 minutes. The ‘Wilfred Templeman’ deployed a Campelen 1800 bottom-trawl that was towed for 15 minutes at three knots. Both vessels sampled 24 hours per day. Bottom temperature (°C) and salinity (ppt) were determined at most sampling sites, usually with a conductivity, temperature and depth profiler (CTD). Further details of sampling in the Cabot Strait surveys were given by Campana et al. (Reference Campana, Chouinard, Hanson and Frechet1999).
After each haul of the bottom-trawl, all fish caught including E. cimbrius were identified using standard identification texts for the area (Scott & Scott, Reference Scott and Scott1988), measured (cm, total length, TL) and counted. A total of 355 E. cimbrius were caught in the Cabot Strait with 341 being measured for total length. In the southern Gulf of St Lawrence, 1347 E. cimbrius were caught and 1344 were measured.
To test the hypothesis that bigger fish generally occurred in deeper water, lengths of individual E. cimbrius were plotted against depth and examined using linear regression for both regions. Regressions were calculated using Microsoft Excel. Regression residuals were examined for normality and homogeneity by plotting residuals against predicted values. Residuals were examined visually and were judged to be normal with homogeneous variance and without pattern. The Kolmogorov–Smirnov two-sample test (K-S test) was used to determine if E. cimbrius was found at significantly different depths, temperatures and salinities by comparing the relative cumulative frequencies of all the sites sampled to those sites where E. cimbrius was captured. This test is based on the maximum difference (dmax) between these two cumulative frequencies. The K-S test was also used to determine if E. cimbrius was caught at specific times of the day.
RESULTS
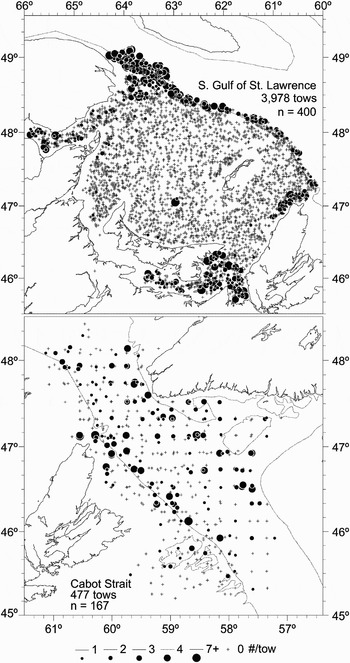
The 27 strata in the southern Gulf of St Lawrence were well surveyed by DFO with almost 4000 sites sampled from 1971–2002 (Table 1; Figure 2). The only areas not thoroughly sampled were the central Northumberland Strait and the shallow depths along the coast where the draft of the vessel limited sampling to a depth greater than 13 m (Hurlbut & Clay, Reference Hurlbut and Clay1990; Benoît & Swain, Reference Benoît and Swain2003b). With the exception of two sites, E. cimbrius were not collected in the central portion of the southern Gulf of St Lawrence (Figure 2). Enchelyopus cimbrius were primarily caught in the shallow coastal waters of the Baie des Chaleurs and eastern Northumberland Strait (including St George's Bay) in addition to the much deeper waters of the Laurentian Channel, Cabot Strait and Cape Breton Trough (Figure 2). The deep-water Laurentian Channel distribution evident in the southern Gulf of St Lawrence continued into the deep waters of the Cabot Strait with E. cimbrius being taken throughout the Cabot Strait during the four years of sampling from 1994–1997 (Figure 2).
Distribution of survey tows and catches (numbers) of Enchelyopus cimbrius during bottom-trawl surveys of the southern Gulf of St Lawrence (September 1971–2002) (upper) and Cabot Strait (January 1994–1997) (lower). n refers to the number of sites where E. cimbrius was caught.

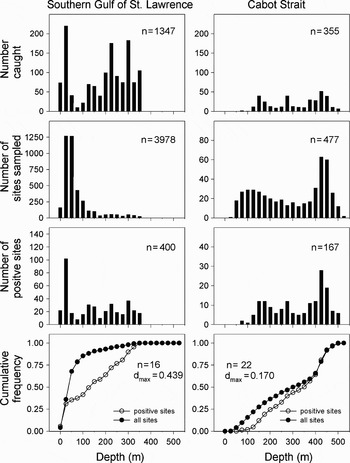
In the southern Gulf of St Lawrence, 1347 E. cimbrius were taken at depths of 13–386 m. The K-S two-sample test showed a significant difference (N = 16 depth-classes, dmax = 0.439, P < 0.05) between the relative cumulative frequencies of depth for all sites sampled and depth for those sites where E. cimbrius were caught (positive sites) indicating E. cimbrius was not randomly distributed in the southern Gulf of St Lawrence (Figure 3). A high frequency of sampling at 50–74 m (Figure 3) did not lead to a high frequency of positive sites at these depths. The maximum difference (dmax = 0.439) between these relative cumulative frequencies occurred at 100–124 m depth (Figure 3). Results indicate E. cimbrius was caught throughout the depth-range sampled but with highest catches occurring in both shallow (25–50 m) and deeper waters (>200 m; Figure 3). In the Cabot Strait, 355 E. cimbrius were caught at depths of 80–523 m. The comparison between the depth of all sites sampled and the depth of positive sites was not significant (K-S two-sample test, N = 22 depth-classes, dmax = 0.170, P > 0.05, Figure 3).
Number (n) of Enchelyopus cimbrius caught, number of sites sampled and number of sites with E. cimbrius (positive sites) at depth intervals indicated in the southern Gulf of St Lawrence (left) and Cabot Strait (right). The cumulative frequencies as a function of depth (bins of 25 m) for the number of sites sampled and the number of sites with E. cimbrius are shown in the bottom panels along with critical values for the Kolmogorov–Smirnov (K-S) two-sample test. Dmax is the maximum difference between the two cumulative frequencies. In the bottom panel, n refers to the number of (25 m) depth bins used in statistical comparisons of the K-S two-sample test.

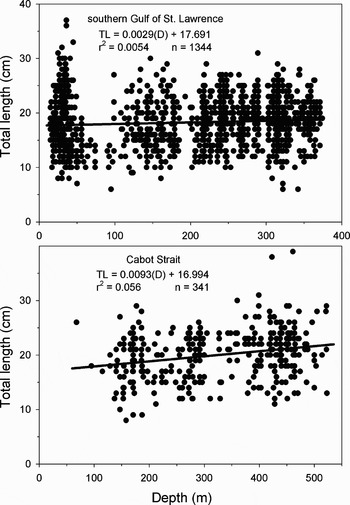
Enchelyopus cimbrius in the southern Gulf of St Lawrence varied in length from six to 37 cm TL. In the Cabot Strait length ranged from eight to 39 cm TL. The overall length–depth relationships as determined by linear regression were significant for the southern Gulf of St Lawrence (F1,1343 = 7.33, P = 0.0068) and the deeper Cabot Strait (F1,340 = 20.0, P < 0.0001) (Figure 4).
Linear regressions of total length (cm) for Enchelyopus cimbrius caught at the depths (m) indicated in the southern Gulf of St Lawrence (top) and Cabot Strait (bottom). Regression equations, coefficients of determination and sample sizes are indicated.

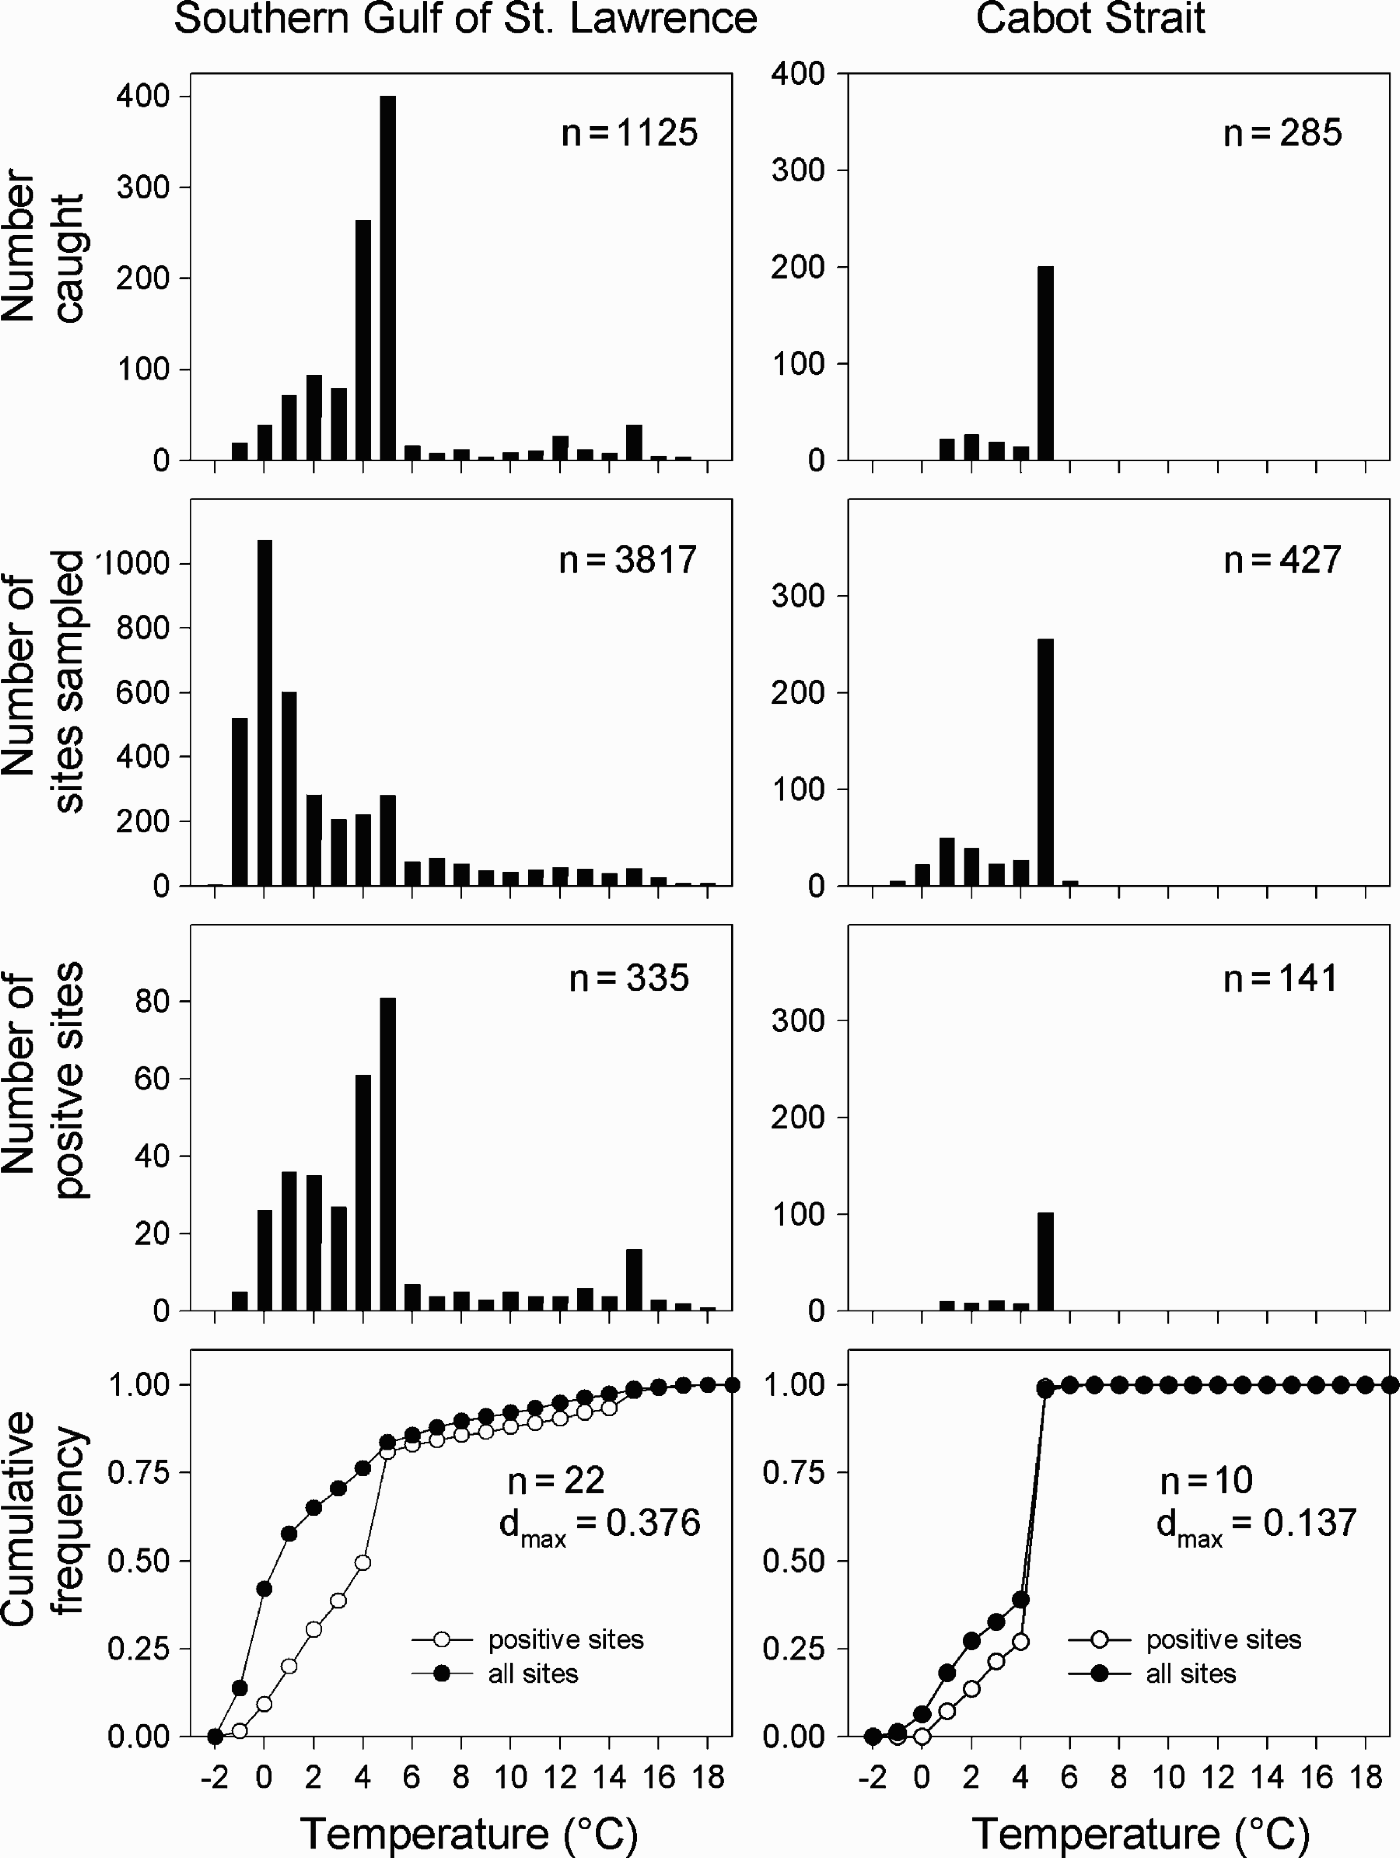
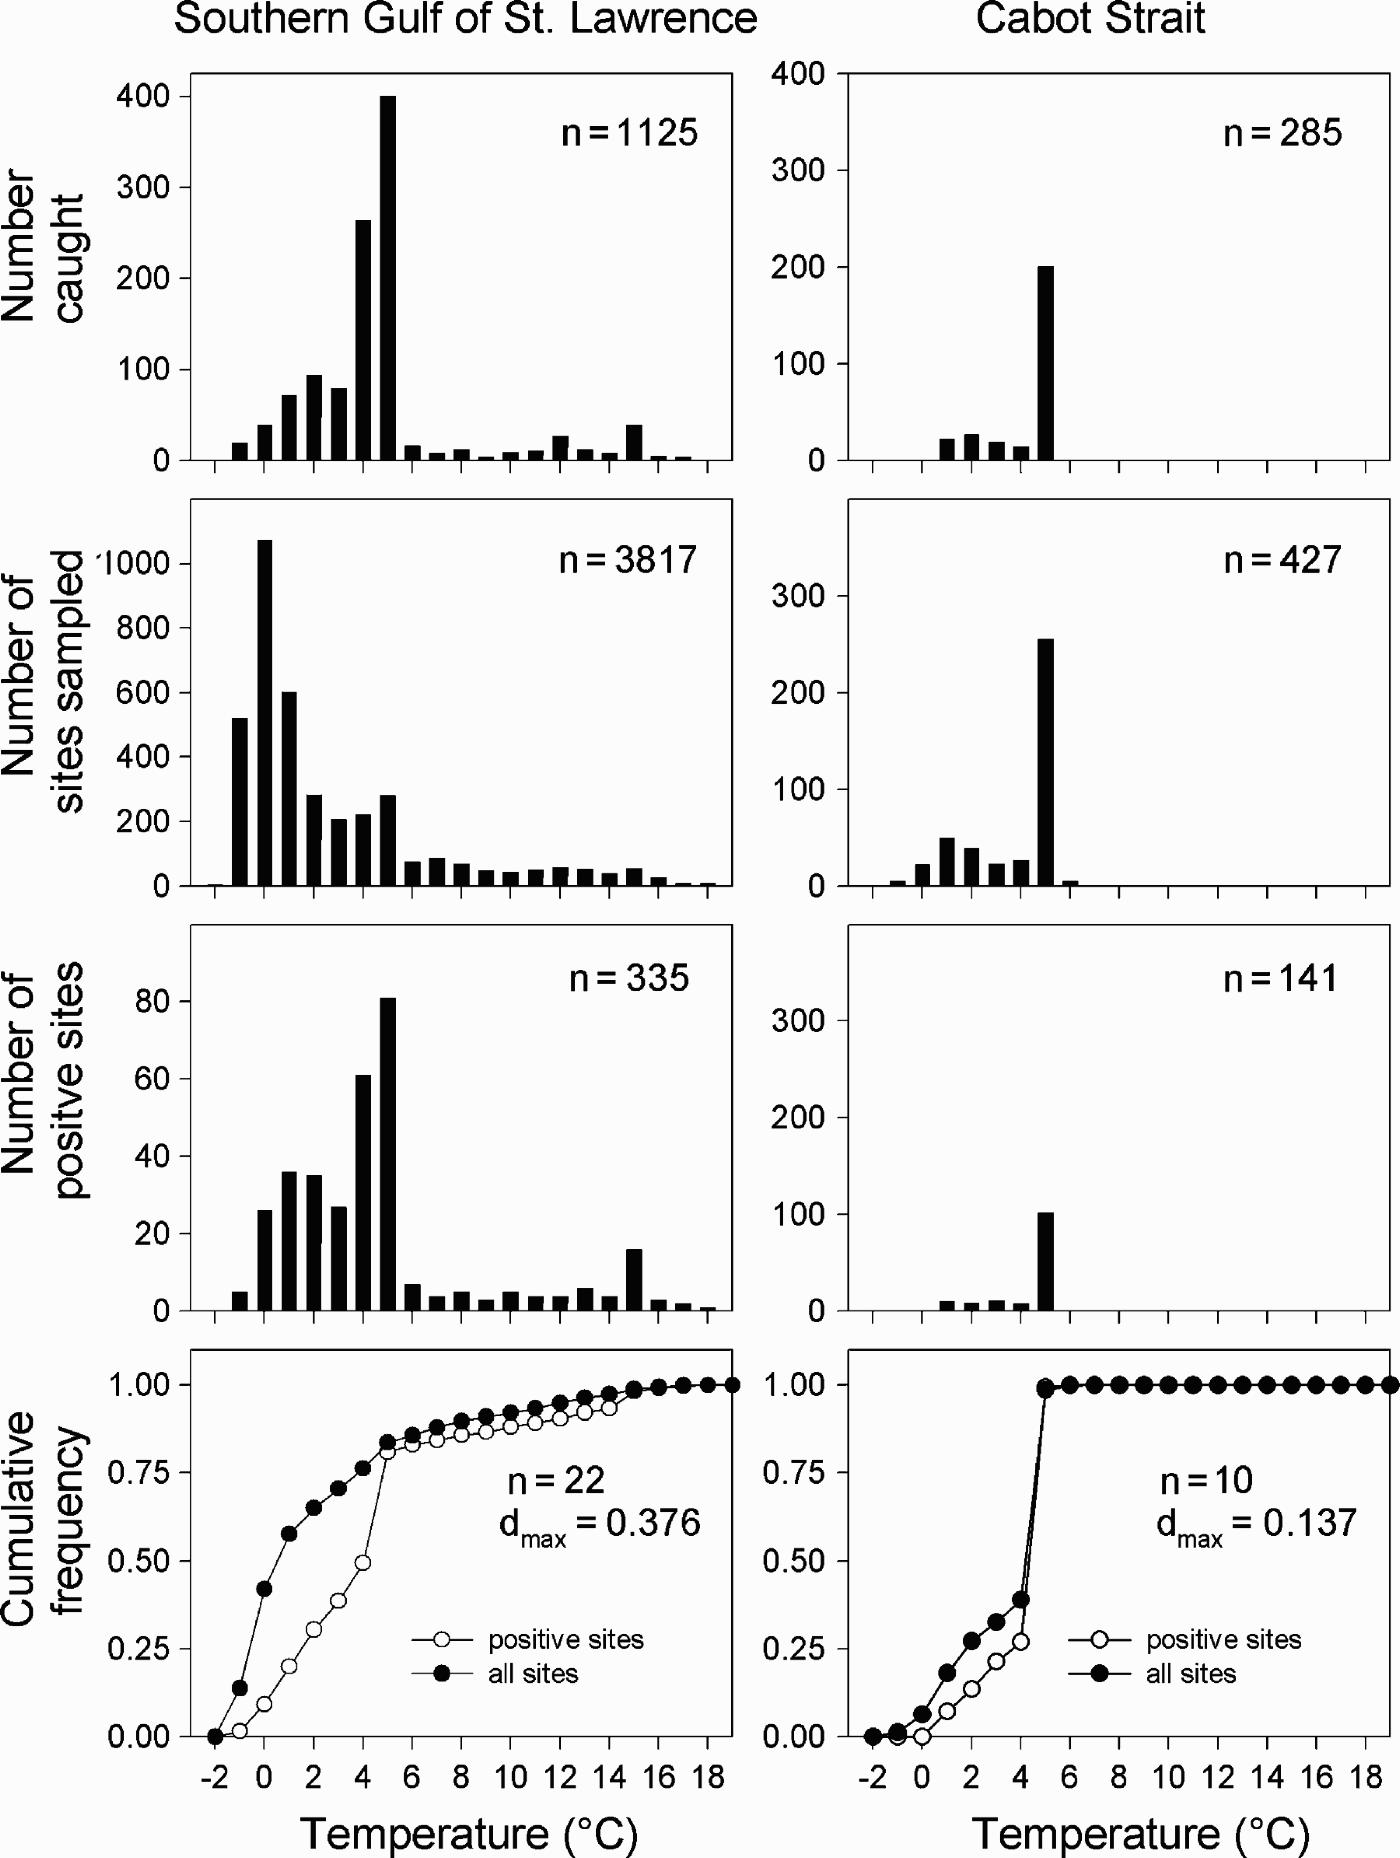
From 1971–2002, bottom water temperatures in the southern Gulf of St Lawrence ranged from –1.2 to 19.3°C in September, with E. cimbrius being taken at a slightly narrower range from –0.9 to 18.3°C (Figure 5). Highest catches occurred at 4–6°C. The K-S two-sample test performed to compare the relative cumulative frequency of temperature at all sites sampled with the relative cumulative frequency of temperature at sites with E. cimbrius was significant (N = 22 temperature-classes, dmax = 0.376, P < 0.05) (Figure 5) with the maximum difference between these relative cumulative frequencies occurring at 1–2°C. The K-S two-sample test for the Cabot Strait was not significant (N = 10, dmax = 0.137, P > 0.05). Bottom temperatures sampled in the Cabot Strait ranged from –0.8 to 7.5°C with E. cimbrius being taken at a slightly narrower temperature range of 1.2–6.2°C (Figure 5).
Number (n) of Enchelyopus cimbrius caught, number of sites sampled and number of sites with E. cimbrius (positive sites) at the temperature intervals indicated in the southern Gulf of St Lawrence (left) and Cabot Strait (right). The cumulative frequencies as a function of temperature (bins of 1.0°C) for the number of sites sampled and the number of sites with E. cimbrius are shown in the bottom panels along with critical values for the Kolmogorov–Smirnov (K-S) two-sample test. Dmax is the maximum difference between the two cumulative frequencies. In the bottom panel, n refers to the number of (1.0°C) temperature bins used in statistical comparisons of the K-S two-sample test.
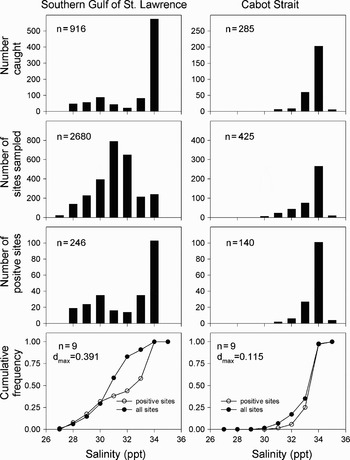
Bottom salinity in the southern Gulf of St Lawrence ranged from 27.2 to 34.9 ppt with E. cimbrius being taken at sites ranging from 28.3 to 34.9 ppt (Figure 6). The K-S test did not demonstrate a significant difference between the relative cumulative frequencies of sites sampled and positive sites (N = 9 salinity-classes, dmax = 0.391, P > 0.05). Enchelyopus cimbrius was mostly caught at salinities of 34 to 34.9 ppt (Figure 6). Salinity in the Cabot Strait ranged from 30.5 to 35.2 ppt with E. cimbrius being taken at 31.3–35.2 ppt; there being no difference between the relative cumulative frequencies of sites sampled and positive sites (N = 9 salinity-classes, dmax = 0.115, P > 0.05) (Figure 6).
Number (n) of Enchelyopus cimbrius caught, number of sites sampled and number of sites with E. cimbrius (positive sites) at salinity intervals indicated in the southern Gulf of St Lawrence (left) and Cabot Strait (right). The cumulative frequencies as a function of salinity ranges (bins of 1 ppt) for the number of sites sampled and the number of sites with E. cimbrius are shown in the bottom panels along with critical values for the Kolmogorov–Smirnov (K-S) two-sample test. Dmax is the maximum difference between the two cumulative frequencies. In the bottom panel, n refers to the number of (1.0 ppt) salinity bins used in statistical comparisons of the K-S two-sample test.

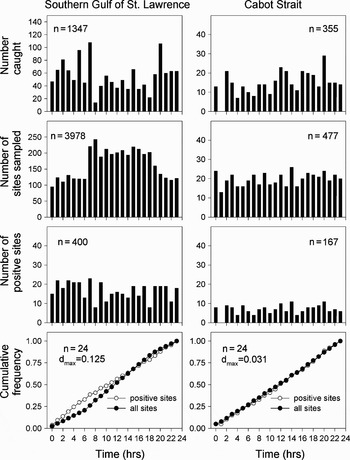
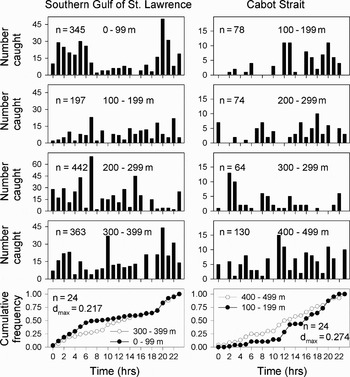
Enchelyopus cimbrius was caught throughout the day and night in the southern Gulf of St Lawrence and Cabot Strait. There was no significant difference in the relative cumulative frequencies of all sites sampled and those sites where E. cimbrius was captured as indicated by the K-S two-sample test for fish from the southern Gulf of St Lawrence (N = 24 hour-classes, dmax = 0.125, P > 0.05) and Cabot Strait (N = 24 hour-classes, dmax = 0.031, P > 0.05) (Figure 7). Given the observations of Keats & Steele (Reference Keats and Steele1990), the time of capture was compared for E. cimbrius taken in shallow (0–99 m) and deeper (300–399 m) water and was found to be not significant in the southern Gulf of St Lawrence (K-S two-sample test, N = 24 hour-classes, dmax = 0.217, P > 0.05) and Cabot Strait (N = 24 hour-classes, dmax = 0.274, P > 0.05) (Figure 8). In the southern Gulf of St Lawrence at depths less than 100 m, 84.9% of E. cimbrius were caught between 19:00 and 8:00 hours, approximating hours of darkness for September (Figure 8). For the Cabot Strait, the K-S test comparison was made for fish taken between 100 and 199 m and 400 and 499 m due to the small sample size of fish caught at depths less than 100 m (N = 2) and greater than 500 m (N = 7). Results, although not significant, were close to the critical reference value (dmax of 0.274) and hence bordered on being significant.
Number (n) of Enchelyopus cimbrius caught, number of sites sampled and number of sites with E. cimbrius (positive sites) at intervals of 1 hour in the southern Gulf of St Lawrence (left) and Cabot Strait (right). The cumulative frequencies as a function of time of day for the number of sites sampled and the number of sites with E. cimbrius are shown in the bottom panels along with critical values for the Kolmogorov–Smirnov (K-S) two-sample test. Dmax is the maximum difference between the two cumulative frequencies. In the bottom panel, n refers to the number of hour bins used in statistical comparisons of the K-S two-sample test.

Number (n) of Enchelyopus cimbrius caught as a function of time of day (1 hour intervals) by 100 m depth intervals in the southern Gulf of St Lawrence (0–399 m; left) and Cabot Strait (100–499 m; right). Bottom panels show the cumulative frequencies for the depth-ranges indicated. n refers to the number of hour bins examined in the Kolmogorov–Smirnov two-sample test. Dmax is the maximum difference between the two cumulative frequencies.

DISCUSSION
Although the findings of this study do support a statistically significant positive size–depth relationship for E. cimbrius in the southern Gulf of St Lawrence and Cabot Strait, the biological significance is very weak as indicated by slopes less than 0.1. Hence, E. cimbrius did not follow the positive body size–depth patterns exhibited by other Gadiformes (Macpherson & Duarte, Reference Macpherson and Duarte1991; Moranta et al., Reference Moranta, Massutı, Palmer and Gordon2007). Even though the length–depth relation in the Cabot Strait was stronger than that observed in the southern Gulf of St Lawrence, only 5.6% of the variation was explained by the very slight positive regression slope observed. The application of Heinke's law to E. cimbrius from the southern Gulf of St Lawrence and Cabot Strait is therefore rejected. Furthermore, evidence for a ‘smaller-shallower’ distribution proposed by Middleton & Musick (Reference Middleton and Musick1986) for other demersal fish species was not supported for E. cimbrius in the southern Gulf of St Lawrence and Cabot Strait given that age 0 newly settled E. cimbrius are seldom collected in any abundance in shallow water coastal nursery habitats off eastern Canada (Macdonald et al., Reference Macdonald, Dadswell, Appy, Melvin and Methven1984; Black & Miller, Reference Black and Miller1991; Methven et al., Reference Methven, Haedrich and Rose2001; Wroblewski et al., Reference Wroblewski, Kryger-Hann, Methven and Haedrich2007).
Several explanations can be proposed for species that do not exhibit a positive body size–depth distribution. These include, but are not confined to: limited size distribution of fish sampled, limited depth-range sampled, fishing pressure and seasonal movements. The size of E. cimbrius caught in the southern Gulf of St Lawrence and Cabot Strait (6–39 cm TL) was consistent with previous studies indicating the body size–depth relationship was examined for almost the entire demersal body size-range. Enchelyopus cimbrius has a prolonged pelagic juvenile stage and settles to the bottom at approximately 35–50 mm (Hermes, Reference Hermes1985) suggesting that fish less than 5 cm are unlikely to be taken on the bottom in deep water. The smallest fish examined in our study were 6 cm long and were presumably recently settled to the bottom. Deree (Reference Deree1999) reported lengths from 95–328 mm TL for E. cimbrius in the Gulf of Maine with a maximum size of 41–42 cm (9 years) being reported in Scandinavian waters (Cohen & Russo, Reference Cohen and Russo1979; Scott & Scott, Reference Scott and Scott1988; Collette & Klein-McPhee, Reference Collette and Klein-McPhee2002). The size of fish examined in our study corresponds closely with the known demersal size-range and includes fish close to the maximum size reported (~42 cm), hence we conclude that limited body size of fish sampled in our study was unlikely a factor contributing to the absence of a bathymetric size trend observed in the southern Gulf of St Lawrence and Cabot Strait.
Macpherson & Duarte (Reference Macpherson and Duarte1991) suggested that the general trend of body size increasing with depth is due to an ontogenetic movement into deeper water that results in a lower metabolic cost. These authors sampled a greater depth range (50–1000 m) which may explain the pronounced patterns reported for many species, particularly Gadiformes, although they did not examine E. cimbrius. The more limited depth-range sampled in the southern Gulf of St Lawrence (13–386 m) and Cabot Strait (37–534 m) may therefore contribute to the absence of a positive size–depth relationship for this species given that 650 m is considered the maximum depth for E. cimbrius (Cohen & Russo, Reference Cohen and Russo1979; Collette & Klein-McPhee, Reference Collette and Klein-McPhee2002).
Herder et al. (Reference Herder, Methven and Hurlbut2005) proposed fishing pressure as an explanation for the positive body size–depth relationship that became increasingly evident over time for Urophycis tenuis as large fish were removed from shallow water spawning sites in the eastern Northumberland Strait of the southern Gulf of St Lawrence. Fishing pressure as an explanation for the lack of a positive body size–depth relationship would not appear to apply to E. cimbrius unless considerable numbers were taken as bycatch, an unlikely event given that it lives in burrows (Keats & Steele, Reference Keats and Steele1990) and that its small size (<40 cm) and cylindrical body shape should allow it to pass through the mesh of most commercial fishing gears (Scott & Scott, Reference Scott and Scott1988).
A biologically significant positive body size–depth relationship for E. cimbrius does not occur in the southern Gulf of St Lawrence and Cabot Strait. We suggest that this is due to factors that act singly or in combination to limit movement. Svetovidov (Reference Svetovidov1948) reported generally limited seasonal movements and migrations for E. cimbrius. This and the evolution of morphological characteristics that help conceal E. cimbrius in muddy burrows and make it a relatively slow and weak swimmer contribute to its sedentary life style. These include a small body size, cylindrical eel-like body shape, reduced pelvic fins and long dorsal and anal fins that almost reach its small rounded caudal fin (Scott & Scott, Reference Scott and Scott1988; Barton, Reference Barton2007). These characteristics are indicative of fish with slower movement that are more likely to swim by wriggling on the bottom or in close association with the bottom (Keats & Steele, Reference Keats and Steele1990; Barton, Reference Barton2007). The relatively weak swimming performance of E. cimbrius can also be characterized by the aspect ratio of its caudal fin. This dimensionless ratio is a measure of the height of the caudal fin squared divided by its surface area (Videler, Reference Videler1993). Scombrid fish such as mackerel and tuna are high-speed swimmers typically with long migrations and have caudal fins with high aspect ratios ranging from 4.5 to 7.2 (Videler, Reference Videler1993; Sfakiotakis et al., Reference Sfakiotakis, Lane and Davies1999). Slower swimmers often have small rounded caudal fins that are associated with low aspect ratios because the wide surface of the caudal fin increases drag (Videler, Reference Videler1993). The aspect ratio of E. cimbrius was determined by measuring six specimens of E. cimbrius (20–24 cm TL) at the New Brunswick Museum (Catalogue Number 001966, all collected off eastern Wolf Island in the Bay of Fundy) and ranged from 0.55 to 0.81 with a mean of 0.66, thus indicating that this species is a relatively slow swimmer.
The tube dwelling habit of E. cimbrius suggests that this species resides and forages within a limited area. A localized distribution and limited movements likely contribute to the absence of a positive body size–depth distribution. Enchelyopus cimbrius lives in tubes burrowed in mud and are seldom observed on other substrates (Keats & Steele, Reference Keats and Steele1990). The SCUBA diving observations of Keats & Steele (Reference Keats and Steele1990) in a small Newfoundland cove correspond to our observations of E. cimbrius on mud bottom in the southern Gulf of St Lawrence and Cabot Strait. Mud was the dominant substrate reported by Loring & Nota (Reference Loring and Nota1973) in the Laurentian Channel, eastern Northumberland Strait and Baie des Chaleurs, the same regions where high catches of E. cimbrius were made in this study (Figure 1). Enchelyopus cimbrius were essentially absent from the Magdalen Shallows and the large central portion of the southern Gulf of St Lawrence which were dominated by sand and gravel substrates. The distribution we report for E. cimbrius is comparable to that of Urophycis tenuis white hake, another gadid typically found on mud substrates (Collette & Klein-McPhee, Reference Collette and Klein-McPhee2002) with a bimodal shallow-water–deep-water distribution in the southern Gulf of St Lawrence (Benoît et al., Reference Benoît, Darbyson and Swain2003; Herder et al., Reference Herder, Methven and Hurlbut2005).
Unlike U. tenuis in the southern Gulf of St Lawrence, the locations of spawning grounds for E. cimbrius are not known. Peak spawning takes place in late May and early June in the St Lawrence Estuary (de Lafontaine et al., Reference de Lafontaine, Sinclair, El-Sabh, Lassus and Fournier1984) and in late June in the southern Gulf of St Lawrence (Hargrave et al., Reference Hargrave, Harding, Drinkwater, Lambert and Harrison1985). A prolonged pelagic juvenile stage would allow for several weeks of dispersal in ocean currents before settlement to the bottom at approximately 35–50 mm (Hermes, Reference Hermes1985). Unlike the early settlement stages of many cod-like fish, E. cimbrius does not occur in any abundance in coastal nursery areas off eastern Canada (Macdonald et al., Reference Macdonald, Dadswell, Appy, Melvin and Methven1984; Black & Miller, Reference Black and Miller1991; Methven et al., Reference Methven, Haedrich and Rose2001; Wroblewski et al., Reference Wroblewski, Kryger-Hann, Methven and Haedrich2007), hence settlement apparently occurs in deeper water, presumably on a mud substratum that contributes to its sedentary existence and limits the body size–depth sorting over its lifetime.
Enchelyopus cimbrius occurred in higher salinity and somewhat warmer waters than those randomly sampled in the southern Gulf of St Lawrence, with most being caught within relatively narrow ranges (34–35 ppt; 4–6°C). Macdonald et al. (Reference Macdonald, Dadswell, Appy, Melvin and Methven1984) attributed higher catches at a deep (80 m) offshore site to the rockling's preference for soft substrates, primarily mud. This preference for mud substrate may be the dominant factor influencing their distribution given that adults were caught over a broad temperature range in the Bay of Fundy (0–12°C; Macdonald et al., Reference Macdonald, Dadswell, Appy, Melvin and Methven1984) and in the southern Gulf of St Lawrence (this study).
The nocturnal movements of E. cimbrius in shallow waters off Newfoundland (Keats & Steele, Reference Keats and Steele1990) contrasts with the results of this study from deeper waters of the southern Gulf of St Lawrence and Cabot Strait where Enchelyopus cimbrius was caught throughout the day and night. However, most E. cimbrius were caught at night (84.9%; 19:00–08:00 hours) in shallow water (<100 m) in the southern Gulf of St Lawrence suggesting that nocturnal movements are more pronounced at shallower depths. Enchelyopus cimbrius were seldom taken in the southern Gulf of St Lawrence prior to the mid-1980s when sampling was done by the ‘E.E. Prince’ (Benoît et al., Reference Benoît, Darbyson and Swain2003). Catches increased gradually after 1985 when the survey vessel changed and when 24 hour around the clock sampling was initiated (Benoît et al., Reference Benoît, Darbyson and Swain2003). Sampling during the night when E. cimbrius have vacated their burrows (Keats & Steele Reference Keats and Steele1990) would make it more vulnerable to bottom trawling.
Enchelyopus cimbrius does not, unlike some other Gadiformes (Macpherson & Duarte, Reference Macpherson and Duarte1991; Moranta et al., Reference Moranta, Massutı, Palmer and Gordon2007), exhibit a size–depth relationship in the southern Gulf of St Lawrence and Cabot Strait. Therefore, the hypothesis that body size increases with depth due to ontogenic movement was not supported. Its depth distribution in the southern Gulf of St Lawrence is bimodal and is largely confined to mud substrates where it likely lives in burrows as observed by Keats & Steele (Reference Keats and Steele1990) in shallow coastal waters off Newfoundland. Future studies are needed to understand the ecology of this cryptic species. Even though E. cimbrius lacks any economic importance due in part to its small size, it is preyed upon by commercially important fish including Atlantic cod and pollock (Scott & Scott, Reference Scott and Scott1988; Collette & Klein-McPhee, Reference Collette and Klein-McPhee2002) and hence may be an important component of mass balance models and in ecosystem management.
ACKNOWLEDGEMENTS
We thank Heather Hunt and two anonymous referees for commenting on the manuscript. Special thanks to Don McAlpine from the New Brunswick Museum for making available its collection of Enchelyopus cimbrius.