

Introduction
The study of budgetary dynamics is a fast-evolving sub-field of policy research. Many scholars – many of whom are associated with the Comparative Agendas Project (CAP) – consider budget authorizations to be one of the most important outputs of a complex process of governmental attention allocation and decision-making (Jones and Baumgartner, Reference Jones and Baumgartner2005; Baumgartner et al., Reference Baumgartner, Foucault and François2009). Accordingly, large-scale data collection and coding projects were started (see, e.g. Breunig et al., Reference Breunig, Koski and Mortensen2009; Jones et al., Reference Jones, Baumgartner, Breunig, Wlezien, Soroka, Foucault, François, Green‐Pedersen, Koski and John2014).
A key concept in this literature is the notion of punctuated equilibrium. This states that while budgets are stable as a general rule, the budget process is also ‘punctuated by periods of abrupt change’ (Jones and Baumgartner, Reference Jones and Baumgartner2005: 151). Punctuated equilibrium theory (PET) situates both stability and change as periods of an overarching budget dynamics. This approach stemmed from an ever-growing empirical literature with most studies focussed on Western advanced industrial democracies (Baumgartner et al., Reference Baumgartner, Breunig, Green‐Pedersen, Jones, Mortensen, Nuytemans and Walgrave2006; Breunig, Reference Breunig2006; Citi, Reference Citi2013; Jones et al., Reference Jones, Sulkin and Larsen2009; Jensen et al., Reference Jensen, Mortensen and Serritzlew2016).
A more recent strand in the literature expanded its scope beyond democratic regimes. These studies evaluate the impact of political regimes on the intensity of punctuations in policy change in both democratic and non-democratic regimes and periods. Baumgartner et al. (Reference Baumgartner, Carammia, Epp, Noble, Rey and Yildirim2017) compare the cases of Brazil, Malta, Russia, and Turkey, while Lam and Chan (Reference Lam and Chan2015) and Chan and Zhao (Reference Chan and Zhao2016) present case studies of Hong Kong and China, respectively. Nevertheless, and despite these developments in the literature, no similar study for Central Eastern Europe in general, and Hungary in particular, is available. The only work relying on the PET framework in analysing Hungarian budgets is a case study by Sebők and Berki (Reference Sebők and Berki2017) of the (democratic) period between 1991 and 2013. Here, the authors demonstrated that year-on-year changes in actual spending (as reflected in cash-flow expenditure data) by policy topics show a distribution function that is generally associated with the notion of punctuated equilibrium.
In this article we extend this latter analysis to an investigation of over one and a half centuries of Hungarian budgetary history. Hungary offers a unique case for studying the budgetary dynamics for multiple reasons. First, the turbulent history of the country was hallmarked by frequent regime changes which allows for the comparison of the effects of different regime types on changes in budget allocations. Second, it offers observations in not just two (democratic/not democratic), but three potential regime types (there were a number of periods which could be classified as ‘partly free’). Third, it offers a long and uninterrupted time series unparalleled in a European context [its length being only surpassed by the Jones et al. (Reference Jones, Baumgartner, Breunig, Wlezien, Soroka, Foucault, François, Green‐Pedersen, Koski and John2014) study on the budgetary history of the United States]. Finally, it tests the external validity of extant research which mostly focussed on the United States and Western/Southern Europe. In light of these considerations, the article contributes to the empirical debate on the distribution of budgetary changes under democratic and autocratic regimes in several ways.
For our core research design, we rely on the article by Baumgartner et al. (Reference Baumgartner, Carammia, Epp, Noble, Rey and Yildirim2017) which examines the role of political regimes in shaping budgetary dynamics in a comparative setting. Baumgartner et al. consider two competing hypotheses when it comes to the role of political regimes in influencing budgetary dynamics. The first is called the informational advantage hypothesis which states that ‘public budgeting data in democracies will show lower levels of kurtosis than other political regimes’. Its alternative is the institutional efficiency hypothesis which states that ‘public budgeting in autocracies will show lower levels of kurtosis than other political regimes’ (Baumgartner et al., Reference Baumgartner, Carammia, Epp, Noble, Rey and Yildirim2017: 6–7).
The article investigates the dynamics of budgeting and its explanatory factors by testing the informational advantage and institutional efficiency hypotheses on a new data set covering over 155 years of Hungarian budgets. The aim of this investigation is to analyse if regimes produce more efficient budget allocations vis-à-vis autocrats. We consider 2580 observations of appropriations (as opposed to actual spending) between 1868 and 2013 (the longest possible time series according to our present knowledge). We followed the calculation method proposed by Baumgartner et al. in constructing a database of identical ‘spending categories’ in order to capture year-on-year changes of comparable items. Based on this data, we calculated year-on-year changes of comparable budget categories and then we evaluated their distribution function. This latter served as the dependent variable in our analysis. On the explanatory variable side we classified political regimes into two categories (‘free’, ‘not free’ – we also ran a more fine-grained analysis focussing on three categories where the not free category was divided into ‘partially free’ and ‘not free’ subsets).
By examining the effect of regime types on these distributional scores we tested the aforementioned hypotheses and found support for the informational advantage proposition (which states that democracies will show lower levels of kurtosis than other political regimes). This finding is also robust for an alternative, functional calculation method of budgetary dynamics. Furthermore, these results are in line with the outcomes of available comparative studies.
In the following, we first discuss the theoretical framework and the hypotheses. We proceed to describe the database, the coding process and the methods applied. In the subsequent section we present the descriptive statistics related to budgetary dynamics in Hungary. Next, we provide an empirical test of our hypotheses. The concluding section discusses our contributions and avenues for future research.
Theory and hypotheses
The baseline theory in most studies on policy and budgetary dynamics is incrementalism. The idea of incremental changes was propagated in policy studies by Lindblom (Reference Lindblom1959), while a notable application to budgeting was put forth by Wildavsky (Reference Wildavsky1964). According to Jones and Baumgartner (Reference Jones and Baumgartner2005: 140) ‘incremental decision-making implies a Normal distribution of policy changes’ based on the idea that public policy changes of the given period follow those of prior periods, and these are only modified as a result of ‘random errors’ (Breunig, Reference Breunig2006: 3). This approach to incrementalism looks at the yearly budget as a single unified unit of analysis and investigates the distributional characteristics of the year-on-year changes of line items or aggregate categories. If the density function of annual changes in the budget is characterized by a normal distribution then the analysis lends support for the theory of budgetary incrementalism.
The theory of incrementalism serves as the null hypothesis (H0) in this study. One of its main challengers in the literature on policy dynamics is the theory of punctuated equilibrium. This suggests that the significant institutional and cognitive costs of budgeting result in budgets that display occasional extreme shifts besides incremental changes. This alternative hypothesis (Hypothesis 1) has the observable implication that – as a rule of thumb – the middle range of the distribution function of budgetary changes will have more values than the normal distribution, the transitory section between the mean and the extremes less, while the density function is ‘fat-tailed’ at either or both tails.
The standard statistical method to account for these fat tails is based on the analysis of the fourth moment of the distribution. Moments characterize various features of a probability distribution. The fourth moment around the mean assesses how flat or peaked a probability distribution is: kurtosis, ‘a standardized measure of the fourth moment, provides a scale-free summary measure of the shape of a distribution’ (DeCarlo, Reference DeCarlo1997; Breunig and Jones, Reference Breunig and Koski2010: 106). A high kurtosis value [called leptokurtosis (LK)] is systematically considered to be a sign of punctuated equilibrium in the literature (we provide more detail on kurtosis measures and how they are calculated in the next section).
A series of empirical studies confirmed punctuated equilibrium, this alternative to classic incrementalism, for a range of US and Western European jurisdictions (Breunig, Reference Breunig2006, Reference Breunig2011; Breunig and Koski, Reference Breunig and Jones2006; Baumgartner et al., Reference Baumgartner, Foucault and François2009; Breunig et al., Reference Breunig, Koski and Mortensen2009; Jones et al., Reference Jones, Baumgartner, Breunig, Wlezien, Soroka, Foucault, François, Green‐Pedersen, Koski and John2014). These confirmatory results prompted the formulation of a ‘general empirical law of public budgets’ (Jones et al., Reference Jones, Sulkin and Larsen2009).
A more recent strand in the literature expanded its scope towards the variation in policy dynamics in different political regimes. This line of inquiry offers invaluable insights for a study of long-term policy dynamics for countries such as Hungary where regime changes were relatively frequent. From a theoretical perspective, this literature is underpinned by the ‘politics of information’ (Jones and Baumgartner, Reference Jones and Baumgartner2005). According to Jones and Baumgartner (Reference Jones and Baumgartner2005: 25) one would observe ‘a greater likelihood of punctuations in some institutions of government rather than others; this is related to the efficiency of the institutional design’. Nevertheless, the authors remark that the strength of punctuations is a matter of degree: cognitive limits are relevant in all institutional settings.
Jones et al. (Reference Jones, Sulkin and Larsen2009) pursue this idea in the field of budgeting, our present focus. They present results that show that there is a significant variation among democracies when it comes to budgetary punctuation. Similarly, Fagan et al. (Reference Fagan, Jones and Wlezien2017) examine if differences in representational systems can affect budget punctuations. They focus on responsivity to public opinion and investigate whether less major punctuation occurs in political systems that are more responsive to public opinion. They analyse budget data from 24 countries and find that more federalized systems produce more budget punctuations. However, their results are inconclusive in relation to the effect of proportional systems and those with dominant executives on the strength of punctuations.
More recently, efforts have also been made to extend the PET framework not just to a comparative analysis of democratic regimes but also to non-democratic polities. These studies evaluate the impact of political regimes on the intensity of punctuations in policy change and venture beyond democratic regimes and periods. Two examples of this approach are offered by Lam and Chan (Reference Lam and Chan2015) and Chan and Zhao (Reference Chan and Zhao2016) who present case studies of Hong Kong and China, respectively.
Lam and Chan (Reference Lam and Chan2015) consider how authoritarianism ‘intensifies punctuated equilibrium’. They follow Jones et al. (Reference Jones, Zalányi and Érdi2003: 167) in asserting that ‘liberal democratic social processes apparently display less extreme behavior than natural phenomena’, which is due to ‘tuning a system toward regular disruption, suffering dislocations but avoiding the catastrophe’. In their analysis they include budget ‘estimates’, which are drafted by various Hong Kong government departments after the legislative approval of the general budget. The authors find that ‘the kurtosis estimates (…) show just how the transition toward greater democracy heralded a system-wide decrease in institutional friction’ (Lam and Chan, Reference Lam and Chan2015: 562). Their unit of analysis is the standard CAP gauge of yearly policy change distributions pooled for different modules (legislative and executive speeches, budgetary allocations). However, they do not conduct a separate analysis for budgetary dynamics.
Chan and Zhao (Reference Chan and Zhao2016) analyse a hypothesis in the Chinese context that could be considered a reformulation of the aforementioned proposition for the context of an authoritarian political system. They attribute ‘the intensification of punctuated dynamics to an information disadvantage arising from the lack of diverse, independent sources of information under authoritarianism’ (Chan and Zhao, Reference Chan and Zhao2016: 134). The authors present a research design for this hypothesis that is based on a comparison of Chinese regions. They posit that regional administrations that are more exposed to signals (from independent sources) should experience more frequent, but less intense change. In this framework, opposition groups are viewed as challengers to policy priorities. If regional governments disregard the inputs from these challengers, they confine attention to known problems which, according to Chan and Zhao lead to delays in the adjustment to emerging issues.
This study is also important for our present purposes since it relies on budget data besides other data sources. Additionally for spending data proper, they consider a relatively short time series (1995–2002). According to their analysis, ‘authoritarian institutions allow decision makers to undertake radical changes unopposed when they become alerted to signals indicating threats to regime survival’. Hence they conclude that these conditions ‘jointly contribute to extremely high levels of punctuation in authoritarian systems, and furthermore links the intensity of punctuation to the signals of social instability in the provinces’ (Chan and Zhao, Reference Chan and Zhao2016: 148).
A rare comparative analysis of the effect of political regimes on budgetary dynamics is provided by Baumgartner et al. (Reference Baumgartner, Carammia, Epp, Noble, Rey and Yildirim2017). This offers both a theoretical starting point and a benchmark against which results from our analysis of Hungarian policy dynamics could be measured. The theoretical framework of the paper contrasts decision-making in democracies and autocracies. The authors claim that ‘autocrats face fewer public and formal checks and balances, possibly allowing them to respond quickly in reaction to shifting contexts’ (Baumgartner et al., Reference Baumgartner, Carammia, Epp, Noble, Rey and Yildirim2017: 2). Nevertheless, ‘democracies may have higher capacity to gather information about social and other issues because of mechanisms associated with electoral accountability, as well as stronger and more independent civil society organizations including the press’ (Baumgartner et al., Reference Baumgartner, Carammia, Epp, Noble, Rey and Yildirim2017: 2).
Based on these theoretical considerations Baumgartner and his co-authors analyse two, conflicting, hypotheses which we also use in our research design. The informational advantage hypothesis (Hypothesis 2) states that ‘public budgeting in democracies will show lower levels of kurtosis than other political regimes’. Alternatively, the institutional efficiency hypothesis (Hypothesis 3) posits that ‘public budgeting in autocracies will show lower levels of kurtosis than other political regimes’ (Baumgartner et al., Reference Baumgartner, Carammia, Epp, Noble, Rey and Yildirim2017: 6–7). These two hypotheses will also serve as the cornerstones for our research design.
In their empirical analysis, the authors compare the cases of Brazil, Malta, Russia, and Turkey in a research design that classifies political regimes according to their degree of freedom. They use a variable with three values (free, partly free, and not free). On the dependent variable side they utilize the LK approach that is a hallmark of PET studies in policy research (we present this in more detail in the next section).
Despite these developments in the PET literature on budgetary dynamics, no similar studies for Central Eastern Europe in general and Hungary in particular are available. The only analysis of Hungarian budgeting in the PET framework to date is an article by Sebők and Berki (Reference Sebők and Berki2017). The authors used consolidated budget cash-flow (i.e. actual spending) data for an analysis of budgetary dynamics between 1991 and 2013. Their time frame covered almost the entire period of democratic government in Hungary for which they confirmed the validity of the punctuated equilibrium approach. We combine this research design with that of Baumgartner et al. in order to use them as a stepping stone for our current analysis.
Data and methods
In this section we first provide information on the research design, followed by a detailed description of the data set construction process as well as the calculation of the values of the dependent and explanatory variables.
Our case selection was informed by the geographically unbalanced nature of extant studies, which mostly focus on the United States and Western Europe. Since these polities have been characterized by a relatively stable political regime (democracy) for most of their history, for which data are currently available, they are not particularly well fit for a research design that is based on regime comparison. No similar study investigated budgetary dynamics in Central and Eastern Europe, a region where frequent regime change was a staple for many countries. In this sense, Hungary with its multiple regime and political system changes during a period of 155 years may prove to be a typical case for the causal relationship between regime types and budgetary dynamics.
We test two pairs of hypotheses (H0–Hypothesis 1 and Hypothesis 2–Hypothesis 3, respectively). First, we conduct a brief analysis with regards to the incremental (H0) or punctuated (Hypothesis 1) nature of Hungarian budgeting in the period. Second, we evaluate the relative relevance of the informational advantage (Hypothesis 2) hypothesis vis-á-vis the institutional efficiency (Hypothesis 3) hypothesis. Our research design is set up in a way that allows for the comparison of our results with those of similar studies. Values for the dependent variable are taken from a frequency distribution of the real year-on-year changes of budget appropriations between 1868 and 2013. Our explanatory variable is a composite index of regime characteristics that draws on several well-established regime categorizations. In the remainder of this section we first present in more detail our dependent variable, followed by a similar discussion of the explanatory variable.
As for our dependent variable, the units of analysis are quasi-identical ‘budget categories’ as proposed by Baumgartner et al. (Reference Baumgartner, Carammia, Epp, Noble, Rey and Yildirim2017: 8). We used budget appropriations, as opposed to final accounts, as our data source since appropriations are generally considered to be a better gauge of decision-making priorities than actual spending (Baumgartner et al., Reference Baumgartner, Carammia, Epp, Noble, Rey and Yildirim2017: 8). We created a new data set for the period 1868–2013 by scanning and converting paper-based documents which had previously been unavailable for scholarly research in any electronic format.Footnote 1
The documents in question showed a great variety in terms of their internal structure, the level of detail of information or even their general legibility. Data reliability for the several autocratic periods in Hungary is generally considered to be adequate, at least for the standards of the period in question. Five-year plans in the post-World War II era and other periods of multi-year planning were a particular focus for validating the data set.Footnote 2 Despite any remaining concerns our data set is, in all probability, the best available presentation of publicly available budgetary information with regards to the 155-year period in question.
We developed the dependent variable in a three-step process. First, we created an initial table of year-on-year changes of comparable spending categories. Next, we controlled for the effect of inflation. Finally, we described the frequency distribution of the real year-on-year changes for each value of our explanatory variable (regime type, see below).
In keeping with the approach of Baumgartner et al. we only included ‘budget categories which are consistently defined between two years; that is, we exclude to the best of our ability from the analyses any budget changes which might reflect a shift in the definition of the stated budget category rather than a substantive reallocation’ (Reference Baumgartner, Carammia, Epp, Noble, Rey and Yildirim2017: 9). This approach is different from that of the CAP (see our literature review): the focus is on not on general policy topics (such as education or defense) but on smaller units of budget line items (nevertheless, in the Appendix we present our data based on this alternative coding scheme as well).
Our starting data set for the period 1868–2013 included 2892 total observations. We excluded line items with no matches in the preceding year (those, which did not have a ‘comparable spending category’ that year). This resulted in a working data set of 2580 observations. Table 1 shows an excerpt from the data set.
Data set structure

The first two columns show the year and the topical description of the budget appropriation in question. Here, it is notable that budget structure was stable from 1959 through to 1961 as defence spending was identified by the same string: ‘Defence sector‘ (for extended periods before and after these three years this spending category was generally called: Ministry of Defence). ‘Appropriation‘ refers to the limit on proposed spending in current nominal terms, while the last two columns identify the comparable category (defence) in question and whether this category existed during the previous year (binary variable: 0 for no, 1 for yes). Further comparable categories include the various strings related to justice (‘Ministry of Justice‘, ‘Legal and Law-enforcement Sector‘) or pensions (‘Pensions‘, ‘Social Security’, ‘State Pension Fund’).Footnote 3
In the next step we controlled for inflation. We calculated ‘real’ values for yearly budgetary changes by dividing the share of the comparable category in the total budget in period t with the similar share in period t−1. This creates a category-specific ‘budget deflator’ that uses the formula put forth by Baumgartner et al. (Reference Baumgartner, Carammia, Epp, Noble, Rey and Yildirim2017: 9–10). As a robustness check, for the majority of our time frame we also used the traditional approach of cost of living [consumer price index (CPI)] where such data were available (for details, see Appendix A1).
We constructed the dependent variable based on this data set. We defined ‘spending categories’ in order to capture year-on-year changes only for comparable items. Based on this data we calculated year-on-year changes of these comparable spending categories. Then we used this database to define a LK score for the two values of the explanatory variable (free, not free) as well as for individual regimes (see below). This is a kurtosis indicator, which is ‘usually defined as the fourth moment around the mean’ (Breunig, Reference Breunig2006: 24). LK proper is a ‘summary statistics that measures the peakedness of a distribution’ (Baumgartner et al., Reference Baumgartner, Carammia, Epp, Noble, Rey and Yildirim2017: 4). As a measure of the shape of distribution functions, it provides a compact assessment of budget stability and change with increasing values characterizing ‘increasing degrees of punctuation’ (Breunig, Reference Breunig2006: 20). In the context of the institutional friction literature it means that higher kurtosis values are evidence of greater ‘friction’ in the policy process and a higher degree of punctuation (meaning more extreme values in the distribution).
As for our explanatory variables, we made use of multiple regime classifications in both the international political science and Hungarian history literature. The default system utilized by Baumgartner et al. (Reference Baumgartner, Carammia, Epp, Noble, Rey and Yildirim2017) was the list compiled by Freedom House, a non-governmental organization. It has three values for political regimes: free, partly free, and not free. While we calculated dependent variable statistics for these values (which we present in the Discussion section), we opted for the simpler scheme of free vs. not free as our baseline method. This choice was informed by a couple of reasons. First, the time series of Freedom House scores for Hungary only starts in 1972. Second, other schemes [such as Polity IV, Varieties of Democracy (V-Dem), and historical accounts] provide different characterizations of the same regime based on their idiosyncratic methodology. Third, the immediate theoretical precursor of our study (Baumgartner et al., Reference Baumgartner, Carammia, Epp, Noble, Rey and Yildirim2017: 3) only states that ‘public budgeting in democracies will show lower levels of kurtosis than other political regimes’ (emphasis added).
In light of these considerations, we used a composite binary variable (free, not free) based on all aforementioned schemes as our baseline categorization (see Appendix A2). This choice is also supported by our analysis of the distributional features of the not free and partly free periods of our data set (see Appendix A1). Nevertheless, we also provide results for a composite three-value version of the explanatory variable (free, partly free, and not free). While this approach to the three-value variable mitigates some shortcomings of individual periodizations, it still provides results that are rooted in the peculiarities of overly generalistic measures developed for comparative purposes. One such example is putting the Horthy era, which was characterized by non-secret, ‘open ballots’ in two-thirds of the electoral districts,Footnote 4 in the partly free column. In order to account for these potential misclassifications, we provide robustness checks for alternative regime categorizations of controversial periods.
Analysis
Descriptive statistics
The number of ‘comparable spending categories’ in our database was 2580. This is in line with the average of 1798 reported for four countries by Baumgartner et al. (for Turkey, Russia, Brazil, and Malta the data set size ranged from 1046 to 3074). The descriptive statistics of our baseline database are presented in Table 2.
Descriptive statistics of yearly real changes

LK=leptokurtosis.
The average budget inflation-adjusted year-on-year change was 9.0% (for instance, the category of ‘Coal mining’ in 1939/1938 and ‘Foreign Ministry’ 2001/2000 showed a real increase of around 14%). The distribution is centred around a median of −1.3% with a std. dev. of 119.3%. Minimum, maximum as well as LK values were extreme and, therefore, corroborate the validity of PET. The least number of comparable categories was associated with the year 1950 (11 categories) while in 2005 the number of comparable categories was 38.
The chart of the distribution of the yearly changes of comparable budgetary categories also shows the ideal-typical form of punctuated equilibrium (see Figure 1).
Histogram of yearly changes of comparable budget categories.
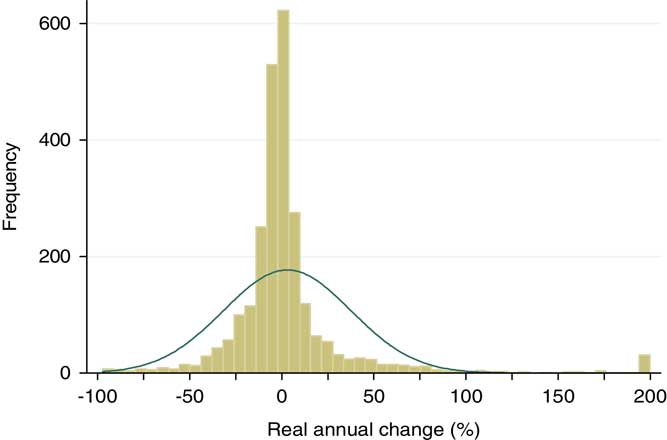
On the one hand, Figure 1 shows that the vast majority of annual changes are minor in scope as they are centred on the division line of 0% change. The central area of the distribution is significantly thicker than the corresponding values of the Gaussian distribution. As for the particular shape of the function, it is also notable that the yearly change in comparable categories cannot break the negative barrier of −100% whereas major increases of more than 200% are less than uncommon.
Results
Our first finding based on the descriptive statistics and Figure 1 is that the overall distributional characteristics of the database lend support for the general empirical law of public budgets. The overall LK score of 0.603 is significantly higher than the standard value for a normal distribution which is 0.12. This large gap between the scores for the Hungarian data and the value for incrementalism (normal distribution) offers new evidence for PET in the field of budgeting.
Our second pair of hypotheses concerned the effects of regime types on budgetary dynamics. The informational advantage hypothesis (Hypothesis 2) states that public budgeting in democracies will show lower levels of kurtosis than other political regimes. Alternatively, the institutional efficiency (Hypothesis 3) hypothesis posits that public budgeting in autocracies will show lower levels of kurtosis than other political regimes. Hypothesis 2 has the observable consequence of a diminishing LK score as we move from not free regimes to free polities. Hypothesis 3 holds if not free regimes are associated with lower LK values than their peers.
In order the compare empirical relevance of these hypotheses the calculation of regime-specific LK scores was also necessary. Therefore, we created a composite regime classification index that relied on multiple regime typologies (see Appendix A2 for complete classification). The only ‘free’ period according to this composite index in Hungary during the period examined is that of the ‘Third Republic’ (1990–2013). While an argument could be made that other eras of Hungarian history were at least ‘partly free’, the independence of the Hungarian state, the degree of political freedoms or the nature of elections were individually or collectively compromised vis-á-vis the post-1989 political order. Therefore, we compared the frequency distribution of budgetary changes of the period between 1868 and 1989 on the one hand, and that of the era from 1990 to 2013 on the other hand. Table 3 shows the descriptive statistics related to this comparison, while Table 4 offers a comparative perspective for the interpretation of the results.
The frequency distribution of yearly changes by regime type

Comparative leptokurtosis (LK) scores

Source for Russia, Turkey, and Brazil: Baumgartner et al. (Reference Baumgartner, Carammia, Epp, Noble, Rey and Yildirim2017: 10).
Periods with at least N=100/quartile for Russia, Turkey, and Brazil.
A number of implications for our research question are readily apparent from the descriptive statistics presented in Table 3. Although the non-free period covers all but 23 years of our time frame, the number of observations related to each period shows a closer gap. This is the direct consequence of the more detailed and stable budgetary reporting practices that are representative of the post-1989 period. The standard deviation and minimum/maximum values are also larger for the non-free period.
They mirror the gap in the LK scores that are associated with the two regime types (see Table 4). The LK score of 0.648 for non-free regimes in Hungarian history are the highest of available comparative results.Footnote 5 The LK score of 0.467 for the free period in Hungary is situated in between the maximum (Turkey) and minimum (Brazil) for free regimes.Footnote 6 Based on the values presented in Table 4, the Hungarian results are also in line with the relevant comparative data where ‘free’ periods are associated with lower levels of LK values than for same-country data for alternative regime types. Taken together, these results lend support for the informational advantage hypothesis (Hypothesis 2) vis-á-vis the institutional efficiency (Hypothesis 3) hypothesis.Footnote 7
In what follows, we provide a number of robustness checks for this baseline analysis. In the Discussion we consider an alternative regime classification scheme, one that introduces a ‘partly free’ category between the free and not free regime types. In Appendix A1 we present robustness checks for four aspects of our research design.
First, we investigate the effect of alternative regime categorizations. Second, we provide an alternative method for calculating real values for budget appropriations (this relies on the standard measure of consumer price inflation). Third, we consider an alternative classification scheme for year-on-year budget changes (which is based on the codebook of the CAP). Finally, we offer statistics with regards to the similarity/dissimilarity of the appropriation time series associated with free, partly free, and not free regime types. These robustness tests invariably confirm our initial analysis and show that the results presented in this section are valid under alternative choices for key research design issues.
Discussion
In our view the safest bet for a research design covering such a heterogeneous period in terms of political regimes is to use the binary classification of free vs. not free regimes. Nevertheless, our data also allow for a more fine-grained analysis, one that has also additional theoretical relevance. While the hypothesis related to the informational advantage of democracies only defines democracies and ‘other regimes’, some empirical studies (notably that of Baumgartner et al., Reference Baumgartner, Carammia, Epp, Noble, Rey and Yildirim2017) rely on a three-value variable which also introduces a ‘partly free’ category.
While the testing of the informational advantage hypothesis is a straightforward task for a binary explanatory variable, it raises both theoretical and practical problems for a three-tier classification. One theoretical issue is related to regime hybridity (Levitsky and Way, Reference Levitsky and Way2010). The institutionalization and policy dynamics of electoral or bureaucratic authoritarianism and other in-between regimes follows different paths than those of democratic and totalitarian regimes.Footnote 8 Nevertheless, in the PET literature the transitivity of the three regime types in terms of policy punctuations is far from properly theorized. Cases of non-transitivity are also rare in the few comparative studies available that cover non-democratic polities.
In order to further explore this issue, we calculated the results presented in the previous section for this three-value classification scheme. The newly established ‘partly free’ eras included the regime of the Austro-Hungarian Compromise (1868–1918), the Horthy era of 1920–43, the Second Republic between 1945 and 1948 and the democratic revolution of 1989. In this scheme, the political regime was ‘not free’ during the ‘Hungarian Soviet Republic’ of 1919, the German (Nazi) occupation of 1944 and the ‘socialist’ period of 1949–88. (In Appendix A1 we also consider an alternative classification for controversial periods such as the years 1920–43, 1948, 1953–55, and 1984–88.) In cases where a regime change happened during the year, classification was based on the longer intra-year regime.
Our analysis of eight Hungarian regimes, spanning 155 years once again lends support to the informational advantage hypothesis (Hypothesis 2). Table 5 presents descriptive statistics of yearly changes of comparable spending categories (in per cent) by regime classes while Figures 2–4 display their distribution.
Changes distribution by regime types: not free.
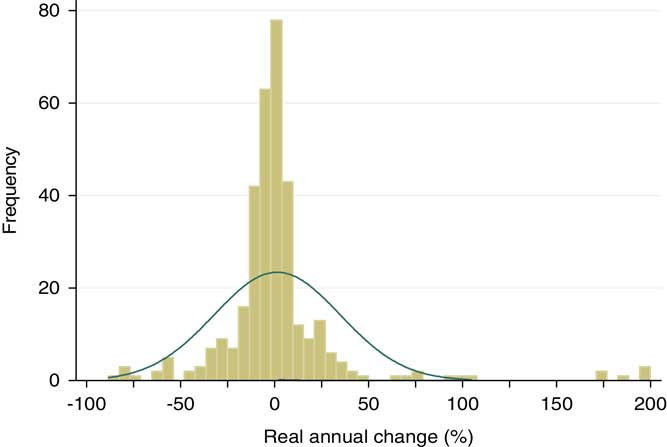
Changes distribution by regime types: partly free.

Changes distribution by regime types: free.
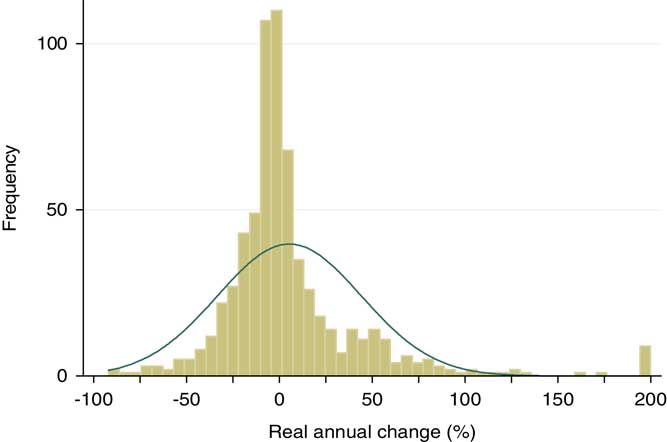
leptokurtosis (LK) scores by regime type

A number of comments are in order with regard to these results. First, it is clear from our regime classification that the partly free category is well-populated – in fact, it is the largest of the three groups in terms of observations. Second, the partly free class was also the most ‘diverse’, with a std. dev. of 139%. Here, examples of extreme values range from a 38-fold increase of comparable categories to a major value-loss of 95%. Third, it is apparent from the charts that the thickening in the middle and on both sides of the density function deviates from the characteristics of the normal distribution. The peculiar shape of regime-specific distribution functions can also be captured by their respective LK values which are significantly higher than the similar value associated with the Gaussian distribution (which is 0.12). This lends support for general empirical law of public budgets and shows that it is not dependent on political regime type.
As for the LK scores, the results highlight the relevance of the puzzle of non-transitivity for the three regime classes in the sense that one can see no gradual decline in LK values from the least free regimes to the fully free one. The highest LK score is associated with the partly free category, which raises several issues.
First, it may not be a coherent or meaningful group in the sense that the regimes assigned to this category show substantial dissimilarity. It covers both 50-year periods (1868–1918) and single years (1989). Furthermore, the same standards of budgeting, or democracy for that matter, may not apply to both 1868 and 1989 in the Hungarian context. (Just to mention one example: Hungary was still part of the Austro-Hungarian monarchy in 1868.)
In any case, a more in-depth analysis of individual periods as well as a theoretical exploration of the defining characteristics of these partly free regimes from the perspective of information processing is warranted. ‘Partly free’ regimes may combine institutional friction with a limited availability of information and may, therefore, produce a more pronounced pattern of punctuated equilibrium. Another interpretation of these results could investigate how the budget format and process changed over time. Here the idea is that some of the extreme values could be errors generated by the difficulties of constructing a long budget series spanning multiple regimes, formats and processes. These questions related to the transitivity between regime types require further developments both in the underlying theoretical framework and the applied research design.Footnote 9
We conclude this discussion by highlighting the fact that the issues raised in this section do not discredit our analysis with regards to the original formulation of the informational advantage hypothesis (which only compares free regimes to non-free regimes and makes no use of the notion of partly free polities).
Conclusion
In this article we used a new database to test two fundamental hypotheses concerning the dynamics of budgeting under authoritarian and democratic government. Our results corroborate those of previous studies regarding punctuated equilibrium and the ‘general empirical law of public budgets’: budgeting in Hungary during a 155-year period was defined by stability interspersed by the occasional landslide change in specific policy areas.
Furthermore, our results are in line with available comparative evidence suggesting that the yearly changes of comparable spending categories show higher levels of punctuation (as captured by LK scores) in autocratic or semi-autocratic regimes vis-á-vis democratic government. These findings are also robust for a number of alternative research designs and methodological choices. Therefore, our investigation of Hungarian budgetary dynamics provides evidence that supports the informational advantage hypothesis (Hypothesis 2).
This analysis offers a threefold contribution to the literature. First, it expands the research programme focussing on regime types in studying the dynamics of policy agendas for the first time to a Central Eastern European country. Second, it presents the second longest uninterrupted budgetary time series in punctuated equilibrium research (after that of the United States, see Jones et al., Reference Jones, Baumgartner, Breunig, Wlezien, Soroka, Foucault, François, Green‐Pedersen, Koski and John2014). Finally, the underlying database offers a unique tool for general purpose budgetary analysis unrelated to PET and policy dynamics. It publishes – for the first time in a digital format – reliable data that covers almost all modern era Hungarian budgets.
We conclude by highlighting avenues for further research. It is notable that Hungary offers a unique case for studying the budgetary dynamics of not just two, but three regime types. The hypotheses related to attention change in budgeting are ‘weakly’ formulated (i.e. they only focus on free and not free regimes vis-á-vis other regimes and do not prescribe transitivity for regime freedom). Nevertheless, it is an interesting finding that partly free regimes are associated with higher LK scores than not free ones. By expanding comparative analysis to countries with a similarly varied history in terms of political regimes a more enhanced analysis would be within reach.
Similarly, the research design in its current form is not equipped to handle direct comparisons of LK values proper (not just their rank order). However, the notable differences between established liberal and transitional/not-quite liberal democracies merit further analysis. The LK scores for the free periods for Turkey and Hungary for most specifications surpass 0.51, while comparable results for Denmark, Germany, the United States, and the United Kingdom all remain below 0.5 (Breunig, Reference Breunig2006: 23). (Brazil is more difficult to fit into this general picture.) A more nuanced classification scheme could look at different levels of punctuated equilibrium within regimes generally considered to be ‘free’.
While we address several methodological issues with extensive robustness checks, further analysis may be required to mitigate all concerns related to validity and reliability. Such extensions could include comparing LK results for various levels of budget aggregation (i.e. budget chapters) and controlling for other potential factors influencing policy dynamics (such as the economic cycle). A more in-depth comparison of the results of the present, line-item-based approach with that of the functional, CAP-based calculation method would also be in order.
Finally, the research agenda could benefit from the extension of the current analysis both in breadth and depth. More comparative work is needed in order to unearth the specificities of the Central Eastern European region when it comes to budgetary dynamics. Similarly, in the vein of the research design of Lam and Chan (Reference Lam and Chan2015), our understanding of the institutional friction mechanisms in Hungary would benefit from combining additional (media, legislative, etc.) longitudinal data sets of policy agendas with those related to budgetary dynamics.
Acknowledgements
The authors gratefully acknowledge financial support from the Hungarian Scientific Research Fund (Grant ÁJP-K-109303) and the National Research, Development and Innovation Fund (Grant FK-123907). The authors thank Csaba Molnár and Nóra Kepe for their research assistance. The authors are indebted to Frank R. Baumgartner and the participants of the CAP Conference in 2017 for helpful comments and suggestions on an earlier draft. The authors also thank the five anonymous reviewers and the editors at EPSR for their helpful suggestions. The views expressed here are those of the authors and do not necessarily reflect the official view of Magyar Nemzeti Bank.
Appendix
A1. Robustness checks
Our analysis offers a clear-cut answer to our core research questions. First, we established that punctuated equilibrium is a good theoretical fit for the empirical frequency distribution functions of budgetary change in post-1868 Hungary. Second, we showed that free regimes have a less punctuated budgetary dynamic. This finding lends support for the informational advantage hypothesis. With these results in hand, we performed a number of robustness checks in order to verify the reliability of our findings. In the Discussion section we already considered an alternative regime classification scheme, one that introduces a ‘partly free’ category between the free and not free regime types. Here we present four further robustness checks of our initial research design.
First, we investigate the effect of historical eras, as opposed to regime categorizations. Second, we offer statistics with regards to the similarity/dissimilarity of the appropriation time series associated with free, partly free, and not free regime types. Third, we provide an alternative method for calculating real values for budget appropriations (this relies on the standard measure of consumer price inflation). Finally, we consider an alternative classification scheme for year-on-year budget changes (which is based on the codebook of the CAP).
a. The effect of historical eras
During our additional tests we checked whether long and continuous historical periods had characteristics that differed from those compiled according to regime type. For this analysis we defined three continuous eras: the Kingdom of Hungary period plus two transition years (1868–1948), the communist era (1949–89) and the Third Republic (1990–2013). The LK results are 0.756, 0.564, and 0.467, respectively. Interestingly, these results show that there is a gradual historical decline when it comes to the degree of punctuation in budgetary dynamics. This finding may be related to a seminal trend and, therefore, would be worthy of further examination.
b. The equality of distributions for not free and partly free periods
Following Breunig and Jones (Reference Breunig and Koski2010) we tested for the cumulative frequency of the distribution functions for the three-value regime classification scheme. We applied two methods: the Kolmogorov–Smirnov (K–S) test and χ2 test. The K–S test gives a probability of rejecting the null hypothesis that two distributions are equal. A χ2 test for independence compares two distributions in a contingency table to see whether distributions differ from each another (ten equally sized bins between −100 and +200%). According to both the K–S and χ2 test statistics there is an evidence for the similarity of not free and partly free period’s distributions. Table A1 presents the results.
Equality of regime-specific frequency distributions

c. Alternative calculation method of real values of appropriations
We calculated LK scores for the real (as opposed to nominal) values of comparable spending categories by using not only our initial approach, but also one that is based on cost of living (CPI). Using the standard CPI method or a GDP-deflator was unfeasible, since no such reliable data exists for the period preceding 1913 (for CPI) and 1926 (for GDP). Therefore, our baseline approach defined real values for yearly budgetary changes by dividing the share of the comparable category in the total budget in period t with the similar share in period t−1. This creates a category-specific ‘budget deflator’ that uses the formula put forth by Baumgartner et al. (Reference Baumgartner, Carammia, Epp, Noble, Rey and Yildirim2017: 9–10) and has the advantage of having a consistent ‘deflator’ over the whole period. Nevertheless, as a robustness check, we also created a time series based on the traditional approach of CPI where such data was available (1913–2013, except for 1922–25 and 1945). For this we relied on official data from the Hungarian Central Office of Statistics (from 1960) and a time series published by Mavridis and Mosberger (Reference Mavridis and Mosberger2017). These CPI-based results are compared to the baseline method in Table A2.
Results for alternative real value calculations

While the LK outcomes are somewhat sensitive to this methodological change, it has no bearing on the validity of the informational advantage hypothesis (Hypothesis 2). The free period shows the lowest LK scores in both cases, even as the total spending deflator diminishes its value by around 0.05. The rank order of the regime classes also remained intact.
d. Alternative unit of analysis
Finally, we calculated LK scores for the baseline regime classification with an alternative unit of analysis. We used the functional categorization of budget line items of the CAP (see www.comparativeagendas.net). This approach assigns one of 21 major policy topic codes (ranging from health care to defence) to each spending category and calculates yearly changes for these policy topic aggregates of underlying items. We used budget sub-chapters to construct these functional categories which resulted in an alternative data set of 2240 items with descriptive statistics largely reminiscent of that of the baseline data set (mean: 14.7; median: 0.0; std. dev.: 214). For the unbalanced panel structure this resulted in 484 line items in the free category (as opposed to 662 in the original data set), 1256 in the partly free (1576) and 500 in the not free class (342). Table A3 presents the results for the LK scores by regimes for both units of analysis.
Results for alternative units of analysis

The only novelty that stands out from these statistics is that the LK values for all two categories are smaller for the CAP method than for the baseline method. Despite these value changes, the decisive relationship from the perspective of the informational advantage hypothesis remained intact: the LK score for the free period is distinctly smaller than for the other two regime types in both cases (the combined not free–partly free LK score is 0.700).
In sum, the results presented in the article, along with their robustness tests in this Appendix, offer clear support for the punctuated equilibrium and the informational advantage hypotheses and disprove the propositions regarding incrementalism and institutional efficiency.
A2. Regime classification
We relied on multiple sources in classifying the various political regimes of Hungarian history between 1868 and 2013: the Freedom House,Footnote 10 the Polity IV,Footnote 11 and the V-DemFootnote 12 scheme and as well as the standard historical periodization prevalent in Hungarian-language historical studies. For the first three of these classification systems we followed the methodological choices of Baumgartner et al. (Reference Baumgartner, Carammia, Epp, Noble, Rey and Yildirim2017).
Freedom House assigns regimes into three categories: free, partly free, and not free based on a score that combines values for ‘political rights’ and ‘civil liberties’ variables. One of the pertinent codes from the Polity IV system is related to political competition. Polity IV uses five categories to describe political competition: repressed (or foreign interruption), suppressed, factional, transitional, and competitive. From the ‘V-Dem’ classification system we use a composite variable called the electoral democracy index. It has five values for regimes: closed autocratic, autocratic, ambivalent, minimally democratic, and democratic regimes.
Our historical categorization allows for the individual treatment of different political regimes as it adds the element of political leadership and form of government to our classification. Here, only the Second and the Third Republics would qualify for being a ‘free’ regime (in the form of a democratic republic) as the era of the Kingdom of Hungary (1868–1946) and that of the People’s Republic (1949–89) did not feature free and fair elections and/or did not protect basic civil liberties. Furthermore, the sovereignty of the Second Republic was compromised by the presence of the Red Army on its territory with all its political consequences.
We considered a regime to be ‘free’ if at least half of the aforementioned schemes assigned their ‘highest’ value to the period in question (namely: free, competitive, democratic, and free for the four schemes, respectively). For the binary classification approach all remaining regimes were classified as ‘not free’. For the three-value classification scheme we divided the previous not free category into two classes: not free and partly free. Here, we followed a similar rule to what we used for defining ‘free’ regimes: if at least half of the coding schemes were assigned the ‘lowest’ value to a regime (not free, repressed, autocratic, and not free) then it was automatically categorized as ‘not free’. All remaining regimes were classified as partly free (Table A4).
Values for alternative regime classification schemes



