The desire to provide a political system with popular legitimacy and to increase political participation among under-represented groups of electors have often been used as arguments justifying the imposition of compulsory voting (Birch Reference Birch2009). In all, 29 countries, comprising almost 30 percent of the world’s democracies, employ some form of mandatory voting. Although compulsory voting has been shown to boost turnout (Hirczy Reference Gray and Caul1994; Lijphart Reference Lijphart1997), compelling individuals to appear at the polls does not mean that they will actually support a candidate. Citizens can cast invalid votes, i.e., blank or null ballots, and thus their right not to vote—or, more precisely, to refrain from choosing any electoral option—remains intact (Lijphart Reference Lijphart1997). In fact, a long-standing feature of compulsory voting systems is higher rate of invalid ballots (Hirczy Reference Gray and Caul1994). In addition, since mandatory voting does not generate universal compliance, illegal abstention constitutes a second form of non-voting.
Extant research on compulsory voting has focused either on the determinants of electoral absenteeism (Panagopoulos Reference Panagopoulos2008; Power Reference Power2009) or on the factors affecting invalid voting (Power and Garand Reference Power and Garand2007). The few studies that explored both sources of abstention (e.g., Power and Roberts Reference Power and Roberts1995) make no theoretical distinction between them or their explanatory variables. In fact, invalid votes are usually lumped with absenteeism (Gray and Caul Reference Goldsmith and Ruthrauff2000), assuming a priori that the two forms of non-voting are “mutually offsetting” (Uggla Reference Uggla2008, 8). Hence, we know relatively little about the specific mechanisms underlying each source of abstention, about the similarities and differences between their main drivers, and about whether and to what extent the two forms of non-voting are substitutes or complementary.
From the methodological perspective, empirical studies in this area typically treat either the proportion of invalid ballots or the fraction of illegal abstainers as the dependent variable, regressing each outcome on a set of predictors. This approach exhibits various weaknesses. First, it does not take into account the connection between the two forms of abstention and the relationship between their determinants. Helpful statistical information is discarded in this way, since changes in standard error estimates obtained from bivariate models may modify the findings from univariate analyses (Thum Reference Thum1997). Moreover, the prevailing modeling strategy neglects the “compositional” nature of electoral data (Aitchison Reference Aitchison1986), i.e., the fact that the proportion of invalid ballots, absenteeism and valid votes for candidates cannot be negative and must add up to 1. Ignoring these non-negativity and unit-sum constraints might lead to infeasible results, such as negative percentages of invalid ballots or sums of fractions >1 (Katz and King Reference Katz and Katz1999).
This paper aims at addressing these methodological and substantive shortcomings, developing a simple analytical framework and an empirical approach to simultaneously examine the determinants of invalid voting and absenteeism in Brazil, a country that contains the world’s largest electorate subject to mandatory voting. While the fraction of invalid ballots in advanced democracies with compulsory voting has remained stable at around 2–3 percent, the equivalent rates in Brazil have been quite volatile and more than 20 times higher on average (Power and Roberts Reference Power and Roberts1995). In addition, although voting has been mandatory in the country since 1934, electoral absenteeism has averaged 19 percent over the last 80 years (Brazilian Electoral Commission 2015). Brazil has also experienced considerable changes in institutional, political and socio-economic conditions across electoral districts and over time, providing an excellent case study for evaluating rival explanations of abstention under compulsory voting while keeping unobserved—e.g. cultural—factors relatively constant, vis-à-vis cross-national designs.
Nevertheless, studying absenteeism and invalid voting in Brazil poses some challenges. On the one hand, political surveys in the country—as in many other developing nations that constitute the majority of compulsory voting systems—only cover a handful of recent elections.Footnote 1 This means that individual-level analyses cannot shed light on longer-term trends in the two sources of abstention. More generally, resorting exclusively to individual data to study the determinants of abstention can be problematic given the sizable turnout over-reporting found in most political surveys (Katz and Katz Reference Katz and King2010), which would presumably be even higher where voting is obligatory. On the other hand, while aggregate results at the district level are available for all elections held in the country since the reinstatement of democracy in 1985, many questions of interest concern individual behaviors or motivations—e.g. are invalid ballots a sign of voters’ disaffection, or do they reflect the informational barriers faced by politically unskilled citizens? Although most studies in this area rely solely on aggregate election returns, it is well known that conclusions about individual behavior drawn from ecological data can be biased and even misleading (Wakefield Reference Wakefield2004).
Our empirical analysis combines individual, state- and election-specific information to simultaneously examine invalid voting and absenteeism in Brazilian lower house elections between 1986 and 2014. We estimate a hierarchical multinomial-choice model for those few contests—2002, 2006, 2010—for which survey data is available, and use these individual estimates as benchmark for comparison with district-level models covering the whole period. By supplementing the aggregate-level information with survey data and “borrowing strength” across elections and districts through a hierarchical Bayesian specification, our approach attenuates concerns raised by ecological inferences (Wakefield Reference Wakefield2004), while accounting for the interrelation between the two sources of abstention and for the compositional nature of electoral returns. Together, the individual and aggregate-level analyses allow us to assess the robustness of our findings and reinforce the validity of our conclusions.
Compulsory Voting and the Voting Calculus
Just like citizens in democracies with voluntary voting, individuals living in countries where voting is mandated by law must decide whether to turn out to vote or not. Additionally, those who show up at the polls must decide whether to vote for one of the candidates running for office or to cast a blank or null ballot. In this section, we extend the cost–benefit analysis framework characterizing rational choice explanations of electoral participation (Downs 1957; Riker and Ordeshook Reference Riker and Ordeshook1968) to accommodate the two sources of abstention prevalent in compulsory voting systems. Prior work (e.g., Panagopoulos Reference Panagopoulos2008) has explored how the sanctions levied on defectors affect the costs of participation, but has generally neglected the fact that mandatory voting may also alter the benefits of voting—and of casting blank or null ballots in particular. We incorporate these considerations in a very simple decision-theoretic model and discuss how micro- and macro-level variables that figure prominently in the literature on electoral participation may affect each form of non-voting through their impact on the key components of the model.
We start from the standard rational choice formulation that conceptualizes the benefits of voting as comprising instrumental rewards citizens obtain by helping their favorite candidate get elected, pB, as well as intrinsic—non-instrumental—returns that are independent of the outcome. These intrinsic benefits of casting a valid vote (D V ) comprise psychological rewards such as the satisfaction of fulfilling the civic duty to vote or affirming a partisan preference.
Unlike casting a valid vote for a candidate, invalid voting does not entail instrumental benefits, although it arguably brings about certain intrinsic rewards. For instance, alienated citizens can decide to purposively annul their vote to express their dissatisfaction with the political establishment or the democratic process (Power and Roberts Reference Power and Roberts1995). Also, when voting is obligatory, indifferent or apathetic individuals may refuse to support any candidate in order to signal their disinterest in the electoral contest that is being imposed on them (Uggla Reference Uggla2008). Hence, we assume that the rewards from casting a blank or null ballot consist of “expressive” benefits derived from manifesting discontent with political elites or the democratic process (E) and other intrinsic returns (D I ) that include the satisfaction of acting in conformity with the legal or ethical requirement to vote (Panagopoulos Reference Panagopoulos2008). While D I might in principle be similar to D V , we allow their magnitude and nature to differ. This accommodates the fact that some of the “positive satisfactions” traditionally assumed to enter the “D term”—e.g. the utility individuals obtain from affirming their allegiance to or beliefs in the efficacy of the political system (Riker and Ordeshook Reference Riker and Ordeshook1968, 28)—may be absent for those who feel the duty or social pressure to vote but decide to spoil their ballot.
Citizens will only cast a—valid or invalid—vote, though, if the benefits of doing so exceed the costs of participating in the election. It is useful to break down the costs of voting into two components: the costs of going to the polling station (C P ), encompassing time, travel expenses and lost wages for voters who miss work, among others; and the informational or cognitive costs (C C ) voters bear in order to be able to choose the “right” alternative among the different electoral options and to mark the ballot correctly. The latter are assumed to affect individuals who intend to cast a valid vote, but not those who deliberately choose to spoil their ballots.
Given this setup, the expected utilities from casting a valid and invalid vote, denoted, respectively, by E(U V ) and E(U I ), are
 $$E\left( {U_{V} } \right)\,{\equals}\,pB{\plus}D_{V} {\minus}C_{C} {\minus}C_{P} ,$$
 $$E\left( {U_{I} } \right)\,{\equals}\,E{\plus}D_{I} {\minus}C_{P} .$$
In addition, in countries where voting is mandatory, failing to show up at the polls often carries monetary and non-monetary penalties. The costs of non-compliance are contingent on the severity of the sanctions (S) imposed on defectors and the probability that these sanctions are actually enforced (e). Hence, the expected utility from illegal abstention can be written as
 $$E\left( {U_{A} } \right)\,{\equals}\,{\minus}eS.$$
Based on (1)–(3), rational actors’ electoral behavior in compulsory voting systems will be determined by the following decision-theoretic calculus:
 $$\left\{ {\matrix{ \!\!\!\!\!\!\!\!\!\!\!\!\!\!\!\!\!\!\!\!\!\!{{\rm Vote }\,{\rm valid }\,{\rm if} } & {pB{\plus}D_{V} {\minus}C_{C} \geq {\rm max}\left\{ {E{\plus}D_{I} ,\,C_{P} {\minus}eS} \right\}} \cr \!\!\!\!\!\!\!\!\!\!\!\!\!\!\!\!\!{{\rm Vote}\,{\rm invalid}\,{\rm if}} & {E{\plus}D_{I} \,\gt\,\max \left\{ {pB{\plus}D_{V} {\minus}C_{C} ,\,C_{P} {\minus}eS} \right\}} \cr {{\rm Otherwise,}\,{\rm don’t}\,{\rm vote}} & {} \cr } } \right..$$
Several implications can be drawn from this basic model. Incentives for electoral absenteeism are higher the less stringent the sanctions on non-voters (S) and lower the odds that such penalties are enforced (e). The likelihood of illegal abstention should also rise as voting costs (C P and C C ) increase, and should decrease as the instrumental (pB) and non-instrumental (D V , D I and E) rewards of voting grow. Compared with illegal abstention, the probability that a rational citizen will cast a blank or null vote increases with the expressive rewards of communicating dissatisfaction with the political status quo (E) and with other psychological benefits of invalid voting (D I ), and diminishes as the costs of showing up at the polls (C P ) become larger and the expected sanctions for non-voting (eS) become lower. Higher cognitive or informational costs (C C ) also raise the likelihood of invalid vis-à-vis valid voting, while higher instrumental benefits (pB) and larger differences between D V and D I have the opposite effect.
Correlates of Electoral Absenteeism and Invalid Voting
The preceding paragraph highlights that whereas some factors are expected to influence the two forms of non-voting in the same direction, others are anticipated to have conflicting effects.
Among the former, characteristics of the electors and of the electoral environment that raise the instrumental benefits of voting or lower the cognitive barriers faced by citizens at the moment of casting a ballot should reduce the prevalence of both sources of abstention relative to valid votes. The closeness of the race is usually seen as a key determinant of pB (Franklin Reference Figueiredo2004). Although the probability of casting the decisive vote is negligible in large electorates, empirical evidence shows that people tend to overestimate their chances of doing so. Models that incorporate uncertainty about the relative popularity of the candidates—which is likely to be greater in tight races—also predict sizable instrumental benefits (Vowles, Katz and Stevens Reference Vowles, Katz and Stevens2016). Moreover, closely fought contests stimulate mobilization efforts and magnify media coverage, all of which ultimately spur citizens’ perception that their vote “matters.” Hence, we expect absenteeism and invalid voting to decline with electoral competitiveness.
The cognitive costs of participation, in turn, should be lower for wealthier, more educated and politically knowledgeable individuals, as higher levels of these variables have been found to boost the ability to access and decode political information (Power and Garand Reference Power and Garand2007). Similarly, the value of C C should be smaller for urban residents, since information is easier to obtain and disseminate in high population density environments (Power and Roberts Reference Power and Roberts1995). We thus expect ballot spoilage and illegal abstention to be less prevalent—relative to valid votes—among urban, politically sophisticated and higher socio-economic status electors. In contrast, aspects of the electoral system such as complicated ballot designs or intricate voting procedures, which can make it difficult for individuals to mark their votes correctly and select their preferred political alternative—especially when they have to choose between a large number of candidates (Katz et al. Reference Katz, Alvarez, Calvo, Escolar and Pomares2011)—should lead to higher rates of absenteeism and invalid voting.
Our theoretical framework does not allow us to anticipate the relative magnitude of the impact of pB and C C on invalid voting versus electoral absenteeism. This remains an empirical question. However, since some of the factors posited to reduce C C should also diminish C P , we can formulate more detailed expectations about these variables. In particular, the turnout literature indicates that wealthier and more educated citizens living in urban areas have better access to the economic means and transport infrastructure required to go to the polls (Power and Roberts Reference Power and Roberts1995). To the extent that our model postulates that C P is positively associated with illegal abstention but negatively linked to invalid voting, we expect the influence of socio-economic status and urbanization to be stronger—i.e., more negative—on the former source of abstention.
Attitudinal and contextual characteristics that promote alienation or indifference toward politics or politicians, as well as those that affect the strictness and applicability of sanctions, should also have divergent effects on the two forms of non-voting. Following Uggla (Reference Uggla2008), it is reasonable to assume that E will be higher among citizens who feel that none of the electoral options represents their interests or who are extremely dissatisfied with the workings of democracy than among other members of the electorate. Poor economic outcomes, which have been shown to undermine public evaluations of political actors and satisfaction with democracy (Norris Reference Norris2011), should also raise E. Although political and economic discontent have been shown to depress turnout in voluntary voting systems (Tillman Reference Tillman2008), our model predicts that, where the possibility of shunning the polls is restricted, they will be primarily expressed through the other form of non-voting available to citizens, increasing the likelihood of ballot spoilage, vis-à-vis other electoral alternatives.
The severity and applicability of penalties for failing to vote will be contingent on individual and contextual factors as well. As pointed out by Panagopoulos (Reference Panagopoulos2008), sanctions in compulsory voting systems range from the largely symbolic to possible prison sentences. Because our empirical analysis focuses exclusively on Brazil, compulsory voting legislation is a national constant, and the strictness of the penalties has remained formally unchanged throughout the period considered. Still, the administrative and economic resources needed to enforce compulsory voting laws are quite daunting (Panagopoulos Reference Panagopoulos2008) and may not be available to all sub-national election authorities. Preliminary evidence provided by Power (Reference Power2009) suggests that the degree of enforcement varies considerably between Brazilian electoral districts. We expect districts in which compulsory voting is implemented more systematically to experience lower rates of absenteeism but higher proportions of blank and void ballots.
Furthermore, in most democracies with mandatory voting, specific segments of the electorate are exempted from the obligation to vote (Birch Reference Birch2009). In Brazil, participation is voluntary for citizens aged 16–17 and 70 and over, as well as for illiterates. Since turnout decisions should be impervious to the threat of penalties for these individuals, we expect them to be more likely to stay at home on Election Day than members of the electorate who are legally obliged to vote. Our theoretical model also suggests that ballot spoilage should be generally lower among these exempted groups. Nonetheless, the case of illiterates deserves specific consideration, since individuals who are unable to read and/or write are likely to face massive cognitive barriers at the booth. Hence, we expect illiterates to be less likely to turn out to vote than citizens for whom participation is mandatory but, conditional on them appearing at the polls, they should also be less successful at completing the ballot.
The other component of our theoretical framework that is expected to have opposing effects on the two sources of abstention is D I . These psychological rewards to invalid voting, however, are not easily measurable—and the same can be said about D V . Several authors operationalize the “D term” based on survey questions on citizen duty. Unfortunately, post-election surveys available in Brazil do not include items tapping into this construct, which is also virtually impossible to capture in aggregate-level analyses. More generally, D V and D I can be seen as residual terms by definition, comprising citizens’ sense of civic duty but also, in the words of Riker and Ordeshook (Reference Riker and Ordeshook1968, 28), various “other satisfactions that do not occur to us at the moment.” Hence, we treat D I and D V as nuisance factors relegated to the error terms in our empirical analysis.
Invalid Voting and Absenteeism in Brazil: Background and Context
Brazil’s 513 federal deputies are elected every four years from 27 multi-member districts (states) using an open-list proportional representation system. Voting is mandatory for all citizens between the ages of 18 and 69, with the exception of illiterates. As mentioned above, participation is voluntary for illiterates—who were enfranchised in 1985 – and, from 1988 on, for individuals aged 16–17 and 70 and over. Unlike citizens subject to compulsory voting, those in the voluntary category are not required to register with the election authorities (Power Reference Power2009).
Electors who are under the obligation to vote but fail to appear at the polls have 60 days to present a valid justification—along with supporting documentation—before the state court responsible for enforcing mandatory voting in each district, known as the Tribunal Regional Eleitoral (TRE). Those whose justification is rejected by an electoral judge are subject to monetary and non-monetary sanctions. The maximum value of the fine that any TRE can impose is 35.14 Brazilian reais (roughly 9 USD), a small amount even for low-income citizens. The non-monetary penalties, by contrast, are quite substantial. Defectors who fail to provide a valid justification in three consecutive elections can have their registration card canceled. And without a voter registration card, Brazilians cannot take civil service examinations, hold any form of government employment, receive paychecks from the state, obtain credit from state-owned banks or obtain an identity card, which is in turn necessary for carrying out a host of everyday activities (Power Reference Power2009).
The level of enforcement of mandatory voting in Brazil is quite strict, especially compared with other compulsory voting systems (UK Electoral Commission 2006). Coupled with this, Power and Roberts (Reference Power and Roberts1995) note that the fact that virtually any interaction with state agencies requires proof of electoral participation determines that citizens take their obligation to vote seriously. In this sense, based on a series of interviews with Brazilian electors, Figueiredo (Reference Downs1990) concluded that citizens are well aware of the sanctions against non-voters, to the point that the risk of having their registration card canceled is the primary reason why many of them participate in elections. More recently, a poll conducted by the survey research firm Datafolha (Reference Congdon2014) before the 2014 election revealed that 57 percent of literate citizens between the ages of 18 and 69 would not vote if participation was voluntary; the actual rate of absenteeism, however, was 19.4 percent. This signals that compulsory voting laws and the corresponding penalties for non-compliance play an important part in Brazilians’ turnout decision calculus.
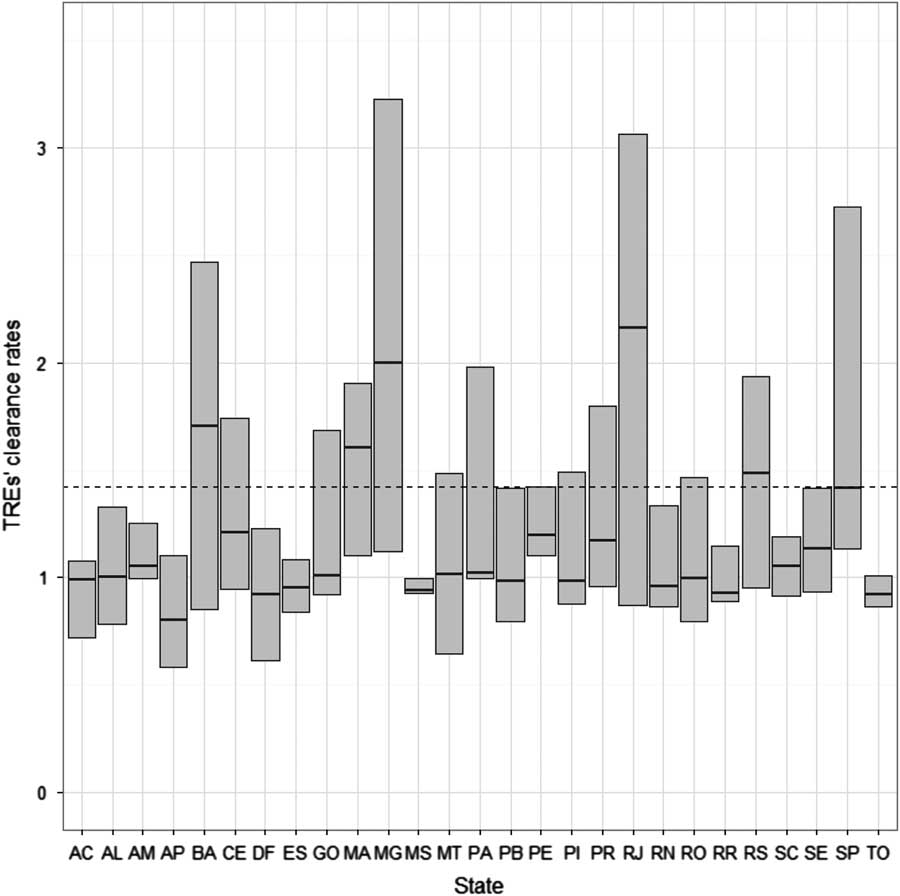
Even though the sanctions for non-compliance are the same throughout the country, Figure 1 shows considerable differences in the extent to which the law has been implemented in practice, both geographically and temporally. Following Power (Reference Power2009), the figure uses a measure of the efficiency of the TREs—the clearance rate, calculated as the number of adjudicated cases as a fraction of all the justification forms for not voting received by each court during a year—as a proxy for enforcement capacity. Higher clearance rates indicate more efficient TREs.
Efficiency of the state electoral courts as a proxy for enforcement of compulsory voting Note: Box plots summarize the distribution—median and interquartile range—of clearance rates across electoral courts between 1986 and 2014. Values above (below) 1 indicate that the court is clearing the docket rapidly (building up a backlog). The dashed horizontal line gives the mean clearance rate across all district-years. TRE=Tribunal Regional Eleitoral.

Median clearance rates range from 0.80 for Amapa to 2.16 for Rio de Janeiro, with courts in the upper decile of the distribution almost twice as efficient as those in the lower decile. There is also ample dispersion within states, pointing to disparities in the efficiency of courts over time. Overall, the mean clearance rate across all district-level tribunals increased by almost 64 percent during the period considered, indicating a notorious improvement in the work of the institutions charged with enforcing mandatory voting.
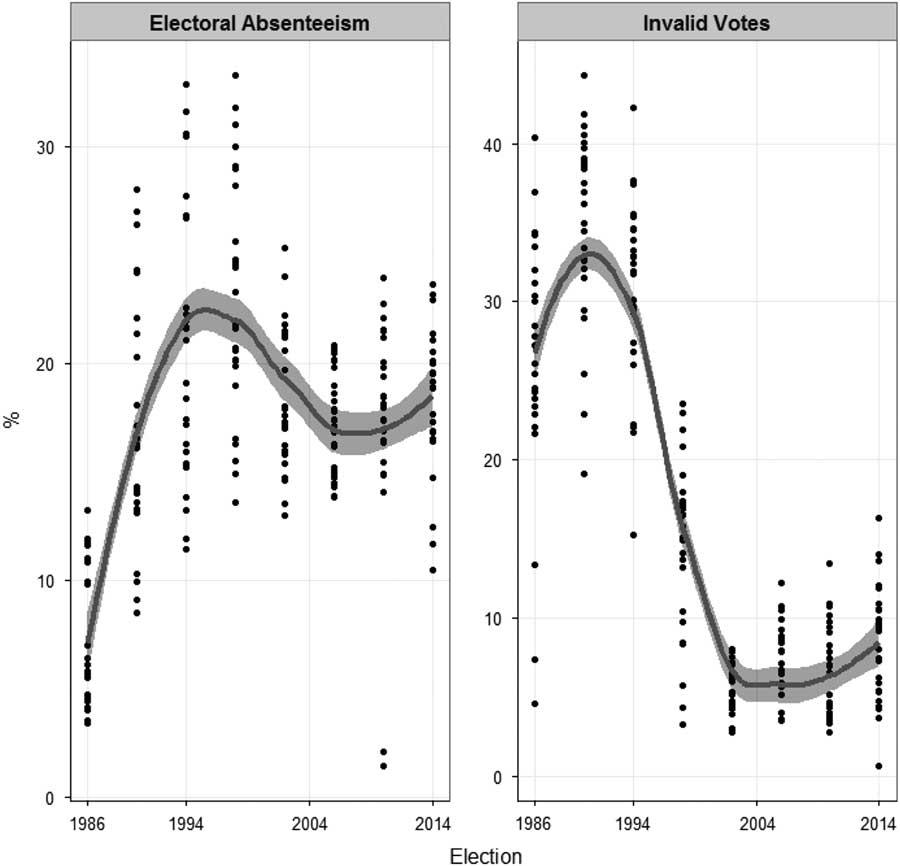
Despite this improvement, Figure 2 shows that absenteeism oscillated over elections held after the re-establishment of democracy, remaining close to 20 percent since the 1990s. There is also considerable fluctuation in illegal abstention between and within states (see also Figure A.1 in the Online Appendix). Swings and cross-sectional differences in invalid voting have been even more marked, providing some preliminary support for the notion that the two forms of non-voting are driven by different forces.
Invalid voting and absenteeism in Brazilian lower house elections Note: Dots represent the percentage of illegal abstainers and invalid votes in each state across elections. Lines correspond to locally weighted regression curves fitted to the data, with 90 percent confidence intervals given by the shaded areas.

Besides variations in enforcement capacity, Brazil has experienced socio-demographic and institutional transformations in the last decades that might also contribute to explain observed patterns in absenteeism and invalid voting. In a context of rapid population growth, increasing education levels and removal of voting restrictions, the size of the electorate went from less than 60 million in the early 1980s to over 140 million in 2014. The extension of the franchise to illiterates expanded the electorate by almost 20 percent, while the 1988 Constitutional reform that lowered the voting age from 18 to 16 years added another two million eligible voters.
Additionally, a major innovation took place in voting procedures during this period. Until 1998, voters who wanted to support a candidate had to write the contestant’s full name or registration number in a paper ballot. This imposed significant informational demands and made it difficult for politically unsophisticated or illiterate citizens to cast a valid vote (Power and Roberts Reference Power and Roberts1995). Seeking to simplify the process and reduce the fraction of spoiled ballots, districts began switching toward automated voting in 1998. The new voting machines provide individuals with supplementary heuristic cues—e.g. candidate pictures—and allow them to register their vote through a numeric keypad that is easy to use even by those with little or no formal education (Goldsmith and Ruthrauff Reference Gelman and Hill2013). This resulted in a sharp drop in voting errors and uncounted ballots and, together with the popularity of the new system among electors, led electronic voting to fully replace paper ballots in 2002.
At the same time, important socio-economic, demographic and political differences among districts have persisted. Per capita income in the wealthiest state (Brasilia) is more than nine times higher than in the poorest one (Piaui), while illiteracy rates are almost six times lower (Brazilian Institute of Geography and Statistics Reference Hirczy2003). The electoral scenarios faced by citizens are also quite dissimilar. The combination of a personalized voting system, district magnitudes that are among the largest in the world and vary markedly between states, and a legislation that allows parties to run more candidates than seats are available (Power Reference Power2009) determines that citizens in Sao Paulo typically have to choose between 865 contenders, whereas the average number of contestants in Tocantins is less than 50.
A comprehensive explanation of invalid voting and absenteeism in Brazil needs to account for these factors, along with the other relevant variables discussed in the Compulsory Voting and the Voting Calculus section. In order to achieve these goals, we resort to survey data from the 2002, 2006 and 2010 ESEB as well as to district- and national-level information covering the whole period under consideration.
Data and Methods
Our outcomes of interest are the two sources of abstention under compulsory voting. Nonetheless, to accommodate the fact that the probabilities/proportions of all the electoral alternatives available to eligible voters must add up to 1, we also include valid votes in our empirical specifications. For the individual-level analysis, we create a trichotomous dependent variable with values Absenteeism, Invalid Voting and Valid Voting, based on ESEB respondents’ self-reported participation in lower house elections. For our aggregate analysis, the three quantities are expressed as a percentage of the electorate.
The independent variables comprise measures of the different factors hypothesized to affect absenteeism and invalid voting. Following the discussion in the Compulsory Voting and the Voting Calculus section, we operationalize the impact of voting costs (C C and C P ) on the two forms of non-voting through the following individual characteristics, taken from the ESEB: Education (indicators for university and secondary education), household Income and Political Knowledge (built from answers to factual political questions included in the surveys), along with Urban residence. Although not all these covariates can be included in our ecological analysis, per capita income and urbanization rates are available at the district level. The impact of politico-institutional features on the two sources of abstention via C C is approximated with the number of Candidates in each district-year and the proportion of citizens casting an Electronic Vote. Since the latter variable is constant from 2002 on, it is only included in the district-level model.
Individuals’ discontent with the political establishment and disappointment with the democratic process, expected to increase the expressive rewards of spoiling the ballot (E), are gauged through three covariates built from items included in the ESEB: a measure of Political Inefficacy based on subjects’ agreement with the statement “It does not make any difference who is in power;” No Political Representation, a dummy for participants who declared that none of the competing candidates represented their political views; and Dissatisfaction with Democracy, coded on a five-point scale ranging from “very satisfied” to “not at all satisfied.” The role of poor national economic conditions is measured through GDP Growth and the Inflation rate—Brazil’s “traditional nemesis” (Power and Roberts Reference Power and Roberts1995, 809). Because the survey-based measures are not available throughout the period considered, we only incorporate the macro-economic indicators as correlates of E in our aggregate-level specification.Footnote 2
Cross-sectional and temporal differences in the degree of enforcement of mandatory voting (e) are measured by the Clearance Rate of each state electoral tribunal. Exemptions to the legal obligation to vote are captured with dummies for Illiterates, Young voters aged 16–17 and Seniors (aged 70 and over) in the individual-level analysis; for the district-level specification, these variables are expressed as percentages of the electorate.
Finally, the Competitiveness of the race is operationalized as the vote-share difference between the first and second-place getters in each district.
Besides these predictors, our individual-level model includes controls for age, gender, marital status, partisanship, religiosity and union membership (Franklin Reference Figueiredo2004). Both our micro- and macro-level specifications also account for unobserved cross-sectional and temporal heterogeneity. A detailed description of the coding and sources for these variables can be found in the Online Appendix, along with descriptive statistics.
Estimation Approach
Let X
i,j,t
, Z
j,t
and W
t
denote individual, district and national-level covariates, respectively. The dependent variable in our individual-level analysis, Y
i,j,t
, equals
 $$Y_{{i,j,t}}^{A} \,\left( {Y_{{i,j,t}}^{I} } \right)$$
if subject i in district j abstained from showing up at the polls (cast an invalid vote) in election t, and
 $$Y_{{i,j,t}} \,{\equals}\,Y_{{i,j,t}}^{V} $$
if she voted for a candidate. The impact of the predictors on absenteeism and invalid voting can be estimated through a hierarchical multinomial logit model:
 $${\rm Pr}\left( {Y_{{i,j,t}} \,{\equals}\,Y_{{i,j,t}}^{s} } \right)\,{\equals}\,{{\exp \left( {\alpha _{{j,t}}^{s} {\plus}X_{{i,j,t}}^{'} \beta ^{s} } \right){\rm }} \over {1{\plus}\mathop{\sum}\limits_{k\in\left\{ {A,I} \right\}} {{\rm exp}\left( {\alpha _{{j,t}}^{k} {\plus}X_{{i,j,t}}^{'} \beta ^{k} } \right)} }},$$
 $$\alpha _{{j,t}}^{s} \,{\equals}\,Z_{{j,t}}^{'} \gamma ^{s} {\plus}W_{t}^{'} \delta ^{s} {\plus}\omega _{j}^{s} {\plus}\eta _{t}^{s} ,$$
where s=A, I; and
 $$\omega _{j} \,{\equals}\,\left( {\omega _{j}^{A} ,\,\omega _{j}^{I} } \right)^{'} \,\sim\,N_{2} \left( {0,\,\sum_{\omega } } \right),\,\eta _{t} \,{\equals}\,\left( {\eta _{t}^{A} ,\,\eta _{t}^{I} } \right)^{'} \,\sim\,N_{2} \left( {0,\,\sum_{\eta } } \right)$$
are district and election bivariate random effects accounting for unobserved heterogeneity and potential correlation between both sources of abstention.Footnote
3
The “aggregate-level variant” of (5) and (6) takes as dependent variables the percentage of electoral absenteeism and invalid votes in state j at election t,
 $$P_{{j,t}}^{A} $$
and
 $$P_{{j,t}}^{I} $$
, modeling them through an additive logistic regression with the fraction of valid votes,
 $$P_{{j,t}}^{V} $$
, as baseline:
 $$P_{{j,t}}^{s} \,{\equals}\,{{{\rm exp}\left( {V_{{j,t}}^{s} } \right)} \over {1{\plus}\mathop{\sum}\limits_{k\in\left\{ {A,I} \right\}} {{\rm exp}\left( {V_{{j,t}}^{k} } \right)} }},$$
 $$V_{{j,t}}^{s} \,{\equals}\,Z_{{j,t}}^{'} \lambda ^{s} {\plus}W_{t}^{'} \theta ^{s} {\plus}\omega _{j}^{s} {\plus}\eta _{t}^{s} {\plus}{{{\itε}_{{j,t}}^{s} } \over {\sqrt {\tau _{{j,t}} } }},$$
where
 $$V_{{j,t}}^{s} \,{\equals}\,{\rm ln}\left( {{{P_{{j,t}}^{s} } \mathord{\left/ {\vphantom {{P_{{j,t}}^{s} } {P_{{j,t}}^{V} }}} \right. \kern-\nulldelimiterspace} {P_{{j,t}}^{V} }}} \right),\,s\,{\equals}\,A,I$$
; ω
t
and η
t
are again district and election random effects; and the observation-specific errors,
 $${\varepsilon}_{{j,t}} \,{\equals}\,\left( {{\varepsilon}_{{j,t}}^{A} ,{\varepsilon}_{{j,t}}^{I} } \right)^_{'} \,\sim\,N_{2} \left( {0,\,\sum_{{\varepsilon}} } \right)$$
, are weighted by a positive variable τ
j,t
~Gamma(υ/2,υ/2) accommodating extreme observations and attenuating the influence of outliers, which can be overwhelming given the small sample size (214) available for this aggregate analysis (Congdon 2005). Since
 $$P_{{j,t}}^{k} \in\left[ {0,1} \right],\,k\,{\equals}\,A,I,V$$
and
 $$\mathop{\sum}\limits_{k\in\left\{ {A,I,V} \right\}} {P_{{j,t}}^{k} \,{\equals}\,1} $$
, models (7) and (8) account for the compositional nature of district-level electoral returns, while the thick-tailed distribution for the observation-specific errors addresses robustness concerns raised by the small samples prevalent in aggregate-level studies in this area (see Figures A.3–A.5 and Tables A.3 and A.4 in the Online Appendix).
Both the individual and district-level models were estimated via Markov chain Monte Carlo simulations. The Bayesian inferential approach is well suited for our analysis, since the number of elections for which ESEB surveys were conducted is too small to satisfy the asymptotic criteria required by maximum likelihood estimation of multi-level models. In contrast, recent work (Gelman Reference Franklin2006; Austin Reference Austin2010) has shown that Bayesian methods yield accurate estimates of the regression parameters and variance components of hierarchical models with very few clusters, provided the number of observations per group is reasonably large—as is the case in our individual analysis. Although the number of elections increases in our aggregate-level analysis, the total sample size is quite small, so large-sample approximations used by frequentist methods are still problematic.
Results
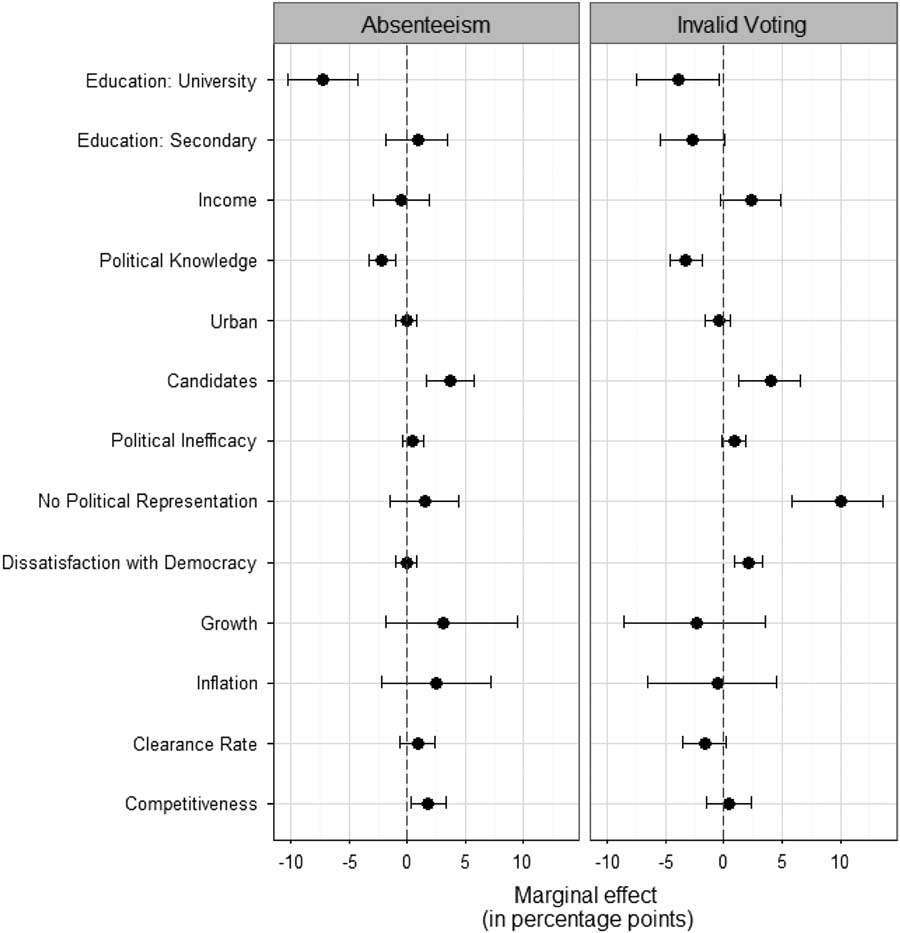
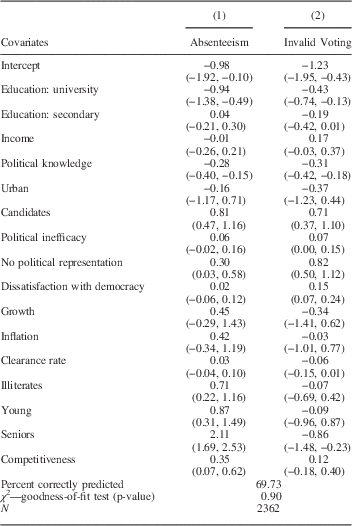
Table 1 reports posterior summaries from the hierarchical multinomial logit model fitted to the 2002–2010 ESEB surveys. Because the parameters of generalized linear regression models can be difficult to interpret, Figures 3 and 4 display average predictive comparisons (Gelman and Hill Reference Gelman2007) or “marginal effects” for the key model predictors.Footnote 4
Expected change in the probabilities of non-voting associated with a change in the correlates of C
C
, C
P
, E, pB and the efficiency of the TREs Note: The figure plots the expected change in
 $${\rm Pr}\left( {Y_{{i,j,t}} \,{\equals}\,Y_{{i,j,t}}^{s} } \right),{\rm }s\,{\equals}\,A,I$$
, associated with a change in each predictor. Solid circles represent point estimates; horizontal lines give the 90 percent highest posterior density intervals. See also Table A.6 in the Online Appendix. TRE=Tribunal Regional Eleitoral.

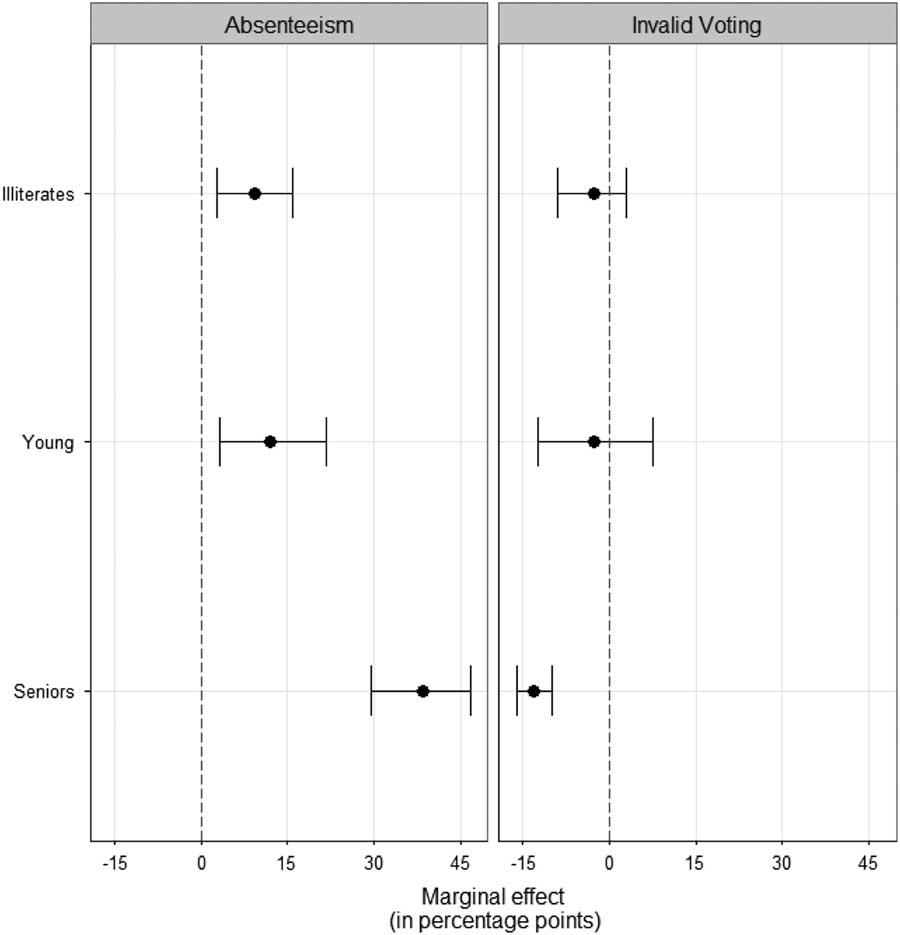
Expected change in the probabilities of non-voting associated with a change in the covariates capturing exemptions to the legal obligation to vote Note: The figure plots the expected change in
 $${\rm Pr}\left( {Y_{{i,j,t}} \,{\equals}\,Y_{{i,j,t}}^{s} } \right),{\rm }s\,{\equals}\,A,I$$
, associated with a change in each predictor. Solid circles represent point estimates; horizontal lines give the 90 percent highest posterior density intervals.

Posterior Summaries for the Individual-Level Model

Note: The table reports posterior means and 90 percent highest posterior density intervals (in parentheses) for the parameters of the individual-level model.
These results provide strong support for our hypothesis that individual and contextual factors that raise the decision-making costs faced by electors are correlated with higher probabilities of illegal abstention and invalid voting. Holding other variables constant, respondents with a college degree are on average 7.3 percentage points more likely to turn out to vote and 3.9 points less likely to spoil their ballot than those with primary school education. The more negative marginal effect of higher education on illegal abstention is also consistent with our expectations about the correlation between high socio-economic status and the costs of physically showing up at the polls.
Also in line with our expectations, political knowledge is systematically and negatively related to both sources of abstention: everything else equal, a participant unable to correctly answer any of the ESEB political knowledge items is almost 7 percentage points less likely to show up at the polls and 11 points more likely to annul her vote than a subject who responded all questions accurately.
In the same direction, a larger number of candidates—taken as a measure of the complexity of the informational environment—is positively correlated with the two forms of non-voting. Everything else equal, the probability that the average elector stays at home on Election Day or spoils her ballot in case she turns out to vote increases by about 0.1 percentage points for every ten additional contestants running in her district. To put these effects into perspective, it is worth noting that the standard deviation in the number of contenders across election-years is 33 for the median district, and that the number of candidates ranges from about 50 to 865 across districts in any given year.
The evidence in Table 1 and Figure 3 is also consistent with our expectations about the role of political protest or disaffection in explaining ballot spoilage. Subjects who do not feel that candidates represent their political views and who are extremely discontented with Brazilian democracy are 17.5 percentage points more likely to annul their vote than respondents satisfied with the political system. Political inefficacy is also positively correlated with invalid voting, with a 0.91 posterior probability that an increase in this variable raises
 $${\rm Pr}\left( {Y^{I} } \right)$$
for the average Brazilian elector. As seen in Figure 3, though, none of these variables systematically increases the probability of illegal abstention, vis-à-vis the other electoral alternatives. Disappointing economic outcomes, on the other hand, are not strongly related to either source of abstention, as attested by the estimates for Growth and Inflation.
We also find mixed support for our hypotheses about the relationship between the application of compulsory voting legislation in practice and the two forms of non-voting. On the one hand, the highest posterior density intervals for the marginal effect of Clearance Rate on both sources of abstention contain zero. At the same time, as seen in Figure 4, illiterates, individuals below the age of 18 and those aged 70 or above are less likely to participate in elections than those legally obliged to vote, as anticipated.
Furthermore, and also in line with our expectations, senior citizens who turn out to vote despite not having to do so are 13 percentage points less likely to cast an invalid ballot than individuals subject to mandatory voting. In contrast, the probability that illiterate or young voters spoil their ballots is not systematically different from that of other respondents. The absence of a strong relationship between Illiterates and invalid voting is particularly surprising given that individuals who are unable to read and/or write should face considerable difficulties completing the ballot. As we show below, the explanation for this finding seems to lie in the replacement of paper-based voting with electronic machines, which lowered the informational barriers faced by this group.
The bottom part of Table 1 also provides partial support for our expectations regarding the relationship between Competitiveness and electoral participation under compulsory voting. In consonance with the vast turnout literature (e.g., Franklin Reference Figueiredo2004), most of which centers on democracies with voluntary voting, we find that closer elections contribute to attract Brazilian citizens to the polls. Each percentage point increase in the vote-share difference between the two most popular candidates in a district is associated with a 0.33 point decrease in the likelihood of voting, after controlling for other individual and contextual factors. The marginal effect of Competitiveness on absenteeism is quite sizable given that the vast majority of Brazilians are compelled to vote regardless of the closeness of the race. The historical nature of the races covered by the ESEB, marked by the rise to power of Lula’s Workers’ Party—which also became the majority in Congress—and a realignment of Brazilian politics (Singer Reference Singer2012) may help explain the magnitude of this effect. While the average probability of invalid voting is also higher in less competitive races, conforming to the predictions of our decision-theoretic model, this effect is very imprecisely estimated.
Although the individual analysis allows for a detailed examination of the mechanisms linking citizens’ characteristics, attitudes and environment to their electoral decisions, we noted before that relying exclusively on self-reported turnout and vote choice may be problematic due to social desirability bias. Moreover, although the ESEB sample is nationally representative, representativeness is not guaranteed at lower levels of aggregation. In this sense, the Online Appendix shows clear discrepancies between the rates of absenteeism and invalid voting emerging from the ESEB and the official election returns.
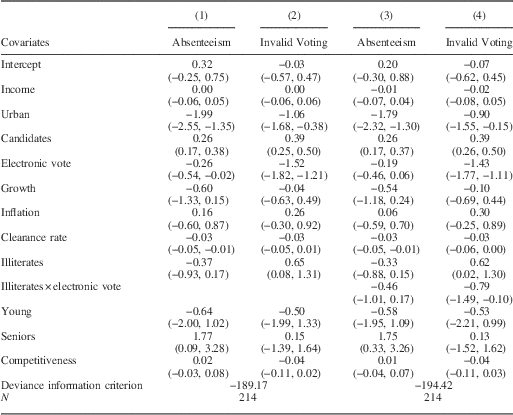
Hence, to gauge the robustness of our findings, Table 2 reports district-level estimates. Columns (1) and (2) present the results of our baseline specification, while columns (3) and (4) add an interaction between Illiterates and Electronic Vote.Footnote 5 This second specification enables us to test whether the introduction of automated voting reduced the informational costs of participation precisely among those electors who faced the highest cognitive burden under the paper-based system.
Posterior Summaries for the District-Level Models

Note: The table reports posterior means and 90 percent highest posterior density intervals (in parentheses) for the parameters of the district-level models.
Like the survey-based estimates, the ecological analysis provides support for the hypothesis that higher cognitive costs increase the prevalence of absenteeism and invalid voting relative to valid votes. Urbanization, a commonly used aggregate-level proxy for the accessibility of political information (Power and Roberts Reference Power and Roberts1995), is negatively and strongly correlated with both forms of non-voting in the two specifications displayed in the table. The credible intervals for Urban in Table 1 covered zero, presumably due to the lack of variation in this covariate among ESEB respondents, the vast majority of whom are city dwellers. However, the baseline estimates in Table 2 imply that, holding other variables fixed, a 1 SD increase—roughly 12 percent—in states’ urban population is accompanied by a 6 percentage point drop in absenteeism and a 3.5 point decline in the fraction of blank and spoilt ballots.
The larger point estimate (in absolute value) for Urban in the equations for absenteeism is also aligned with our expectations. To the extent that urbanization rates may correlate positively with the proximity to voting stations and availability of means of transport (Power and Garand Reference Power and Garand2007), this variable should negatively influence both the C C and C P terms of our theoretical framework, and thus have a more negative effect on illegal abstention than on invalid voting.
Table 2 also corroborates the individual-level result of a positive association between the number of candidates in a district and the rates of illegal abstention and ballot spoilage. Additionally, the aggregate-level model provides evidence that the introduction of electronic voting had a negative impact on both sources of abstention. All else equal, the estimates from our benchmark specification indicate that each percentage point increase in the fraction of electors switching from paper ballots to automated voting machines reduced spoiled ballots by 0.32 points in the average district. The drop in absenteeism following this change was more modest (0.07 points on average), with credible intervals overlapping zero for the specification in column (3).
Altogether, these estimates suggest that the reduction in informational demands brought about by the new technology contributed to enhance political participation by attracting voters to the polls, and, above all, enabling them to effectively support their preferred candidate. It must be borne in mind that this conclusion is drawn from an ecological analysis that only provides insights about the probabilistic association between changes in voting procedures, invalid voting and absenteeism—rather than a rigorous test of the individual-level mechanisms linking these variables. Still, this is a relevant finding that would have been lost if we had only examined the limited survey data available for Brazil.
The importance of supplementing the individual analysis with aggregate data is also illustrated by looking at the estimates for Clearance Rate. Unlike the individual model, the district-level estimates show a consistently negative association between the efficiency of electoral tribunals and absenteeism. Each standard deviation increase in the performance of the sub-national courts charged with sanctioning non-voters—roughly the difference between Minas Gerais and Tocantins in Figure 1—is associated with a 1 percentage point drop in illegal abstention, after accounting for other observed and unobserved sources of heterogeneity. The difference between the micro- and macro-level estimates for Clearance Rate may be due to survey misreporting or to the fact that the aggregate, longer-term analysis is better able to capture the shifts in enforcement capacity experienced by Brazilian states over the last three decades. In fact, Table A.8 in the Online Appendix shows that, when the ecological analysis is re-run on elections from 2002 onwards only, Clearance Rate ceases to have an effect on absenteeism. On the other hand, the district-level estimates show no systematic relationship between enforcement capacity and invalid voting, confirming that the results of the model fitted to the ESEB data.
Among the variables capturing the weight of groups exempted from mandatory voting in the electorate, only Seniors is positively and consistently associated with absenteeism. The 90 percent credible intervals for Illiterates and Young in columns (1) and (3) do not exclude zero, in contrast to the individual-level estimates. A possible reason for this divergence is that, as mentioned in the Invalid Voting and Absenteeism in Brazil: Background and Context section, individuals who are not legally obliged to vote do not have to register as electors either. Therefore, young and illiterate citizens who did not register and stayed at home on Election Day do not affect the rate of absenteeism expressed as a proportion of the electorate, but still count as non-voters in the ESEB. While the same logic applies for Seniors, it is reasonable to assume that a substantial fraction of them remain in the electoral register, as these individuals were still under the obligation to vote until the age of 69 and would only be removed from the register after failing to appear at the polls in three consecutive elections.
The estimates in column (2) also imply that each percentage point increase in the fraction of electors unable to read or write is accompanied by a 0.20 point increase in the proportion of blank and annulled votes. Although this result is aligned with our expectations, it seems to contradict the null finding from Table 1. However, column (4) reveals that this relationship between Illiterates and invalid voting only holds for elections held before the introduction of automated voting. The coefficient for Illiterates in this alternative specification, which is again positive with a (posterior) probability of 0.94, quantifies the relationship between the proportion of illegal abstainers and electors unable to read and/or write when voting was completely paper based. However, the interaction term between Illiterates and Electronic Vote is negative, and the 90 percent highest posterior density interval is (−1.49, −0.10) (see Figure A.8 in the Online Appendix). These results indicate that the implementation of electronic voting was particularly effective in lowering the cognitive barriers faced by less educated citizens, and reconcile the aggregate-level findings with the conclusions drawn from the individual analysis.
Finally, the effect of Competitiveness on absenteeism found in Table 1 vanishes once we consider all elections held since the return of democracy, while the credible intervals for the coefficients of the macro-economic indicators overlap zero, in line with the individual-level results.
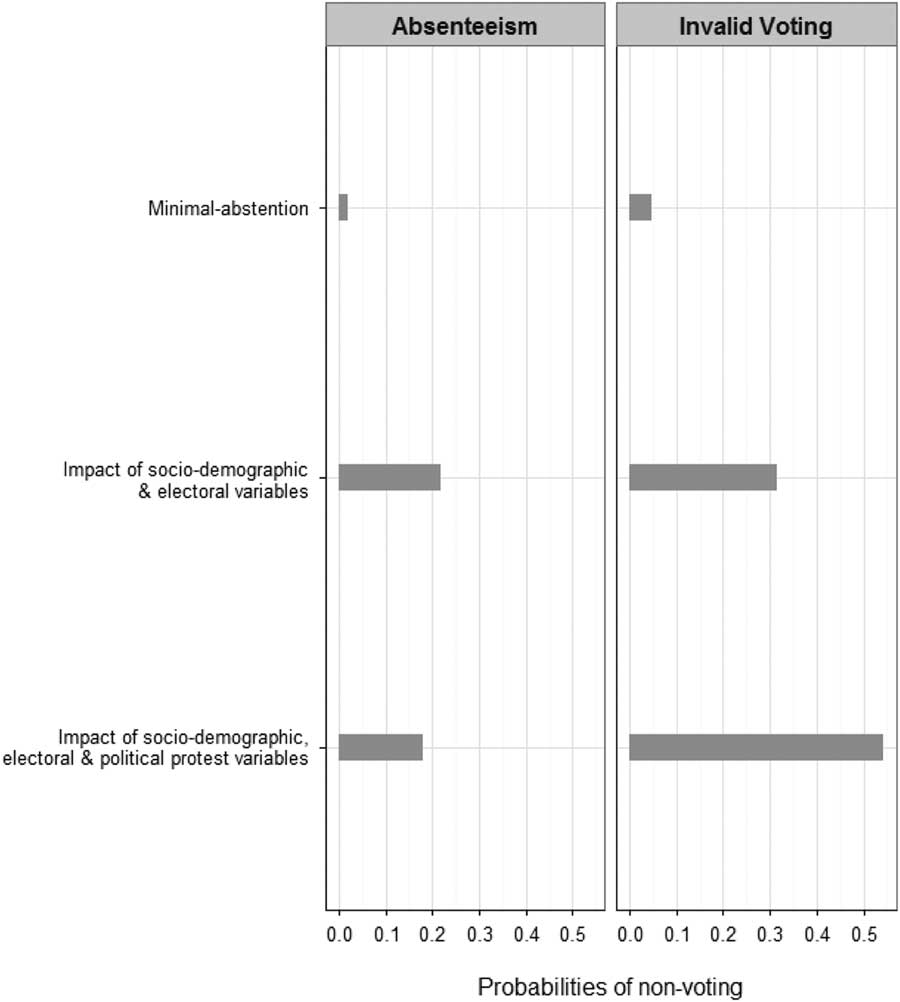
Overall, our individual and aggregate analyses indicate that less politically sophisticated and educated citizens in more rural districts are less likely to show up at the polls than other eligible voters, particularly in highly saturated electoral markets. Moreover, when these citizens do appear at the polls, they are less capable of casting a valid vote, especially if complicated voting procedures render this a cognitively demanding task. The joint impact of these socio-demographic and contextual variables on the two forms of non-voting is quite hefty, as illustrated in Figure 5. The figure also highlights that whereas political alienation or disaffection substantially raise ballot spoilage, these factors play no role in explaining illegal abstention.
Joint impact of socio-demographic, electoral and political protest variables on the average probabilities of non-voting Note: Probabilities computed from Table 1; results based on district-level estimates are displayed in the Online Appendix (Figure A.9).

Our findings also cast doubts on the usual—but typically untested—assumption that forcing people to the polls inevitably leads to higher ballot spoilage (Power and Garand Reference Power and Garand2007). In this direction, we show that the improvement in the performance of state electoral courts over the last 30 years reduced absenteeism without concomitantly increasing invalid voting. Rather than “mutually offsetting phenomena” (Uggla Reference Uggla2008), the two sources of abstention coexist and simultaneously detract from the support for candidates competing in Brazilian legislative races. This conclusion is reinforced by the fact that neither our individual nor our aggregate analysis shows evidence of systematic residual correlations between the two forms of non-voting either at the district or election-specific level (Table A.10 in the Online Appendix).
Concluding Remarks
Building on the rational choice paradigm and drawing from the statistical literature on compositional data and multi-level modeling, this paper jointly studies electoral absenteeism and invalid voting in Brazil, the world’s largest democracy with compulsory voting. Our individual and aggregate-level analyses reveal some differences in the determinants of the two sources of abstention in Brazilian lower house elections. Absenteeism is mainly driven by socio-demographic and contextual variables affecting the costs of participation, as well as by the applicability and long-term changes in the enforcement of mandatory voting provisions. Spoiled ballots, on the other hand, arise from a combination of voter errors and deliberate attempts to signal political discontent. Instead of an inevitable trade-off between the two forms of non-voting, our findings suggest that they occur together, and that their relative prevalence varies with characteristics of the electors and of their politico-institutional environment.
Our work has also policy implications in light of recurrent debates—in Brazil and elsewhere—regarding the justifiability of compulsory voting (Birch Reference Birch2009). These debates typically emphasize the enhanced legitimacy of authorities elected in high turnout races as a rationale for mandatory voting. However, high rates of ballot spoilage may have precisely the opposite effect. Our estimates show that institutional reforms aimed at lowering the cognitive demands faced by electors could contribute to raise turnout while concomitantly reducing invalid voting. In the case of Brazil, such reforms should focus on limiting the proliferation of candidates resulting from the country’s permissive electoral legislation, large district magnitudes and fragmented political landscape.
Although our research focused on Brazil, our theoretical framework and empirical strategy can be adapted to evaluate the generalizability of our conclusions to other compulsory voting systems. In particular, the novel aggregate-level statistical model developed in this paper provides a sound inferential approach that can complement individual analyses based on the limited survey data available in many countries in which participation is obligatory.