Implications
Level of dietary oil supplementation has been shown to reduce ruminal fermentation parameters in dairy cows. However, relatively little data exists pertaining to the effects of unsaturated oils on species of ruminal microorganisms. Lactating cows were fed linseed oil or soybean oil alone (4% of dry matter (DM)) or in combination (2% of DM from each oil) to examine effects on microbial populations, bacterial species and fermentation parameters. Oils reduced cellulolytic bacteria and protozoal counts, along with total ruminal volatile fatty acids compared to controls. Furthermore, linseed oil resulted in the most pronounced decrease in amount of Butyrivibrio fibrisolvens, Fibrobacter succinogenes and Ruminococcus flavefaciens in ruminal fluid assessed by real-time reverse transcriptase-PCR. The negative effect of polyunsaturated fatty acids on ruminal fermentation parameters is explained at least in part by reductions in cellulolytic bacteria.
Introduction
Supplemental oil in the diet of dairy cows changes the composition of milk fat and enhances the concentration of conjugated linoleic acid (CLA), which has been shown to have potential health benefits, including anticarcinogenic properties (Piperova et al., Reference Piperova, Teter, Bruckental, Sampugna, Mills, Yurawecz, Fritsche, Ku and Erdman2000; Roche et al., Reference Roche, Noone and Gibney2001; Loor et al., Reference Loor, Ferlay, Ollier, Ueda, Doreau and Chilliard2005a). Consumption of n-3 fatty acids also has been associated with positive effects on human health. Addition of soybean oil (SBO; high linoleic acid content) to lactating dairy cow diets is expected to increase n-6 and CLA, whereas linseed oil (LSO; high linolenic acid content) would increase n-3 and CLA in milk fat (Demeyer and Doreau, Reference Demeyer and Doreau1999; Dhiman et al., Reference Dhiman, Satter, Pariza, Galli, Albright and Tolosa2000; Chilliard et al., Reference Chilliard, Ferlay and Doreau2001). Further, oils higher in linoleic acid than in linolenic acid were more effective in enhancing CLA in milk fat (Bu et al., Reference Bu, Wang, Dhiman and Liu2007).
In ruminants, feeding large amounts of vegetable oil has the potential to inhibit ruminal fermentation (Jenkins, Reference Jenkins1993; Machmüller et al., Reference Machmüller, Ossowski, Wanner and Kreuzer1998). High dietary oil levels have been shown to decrease the counts of ruminal bacteria and protozoa (Matsumoto et al., Reference Matsumoto, Kobayashi, Takenaka and Itabashi1991; Dohme et al., Reference Dohme, Machmüller, Wasserfallen and Kreuzer2001). It was found that when feeding 2.5% fish oil to lactating dairy cows, ruminal protozoa counts were higher as compared to 5% LSO and 5% sunflower oil (Loor et al., Reference Loor, Ueda, Ferlay, Chilliard and Doreau2005b).
Negative effects on DM intake (DMI) and ruminal fermentation are often reported when unsaturated oils are fed, but some researchers have hypothesized that the negative effect of the unsaturated fatty acids on ruminal digestion would be minimized if the diet contained a higher proportion of forage due to the ability of forage to promote normal ruminal function for maximum biohydrogenation (Palmquist, Reference Palmquist1988). As suggested previously, both increased biohydrogenation of polyunsaturated fatty acids (PUFA) as well as competition between bacteria and feed particles for adsorption of fatty acids can explain the lower toxicity of PUFA with high-forage diets. A recent study with lactating cows observed greater ruminal fiber digestibility but lower duodenal microbial-N flow when a high-forage (F : C = 65 : 35, DM basis) diet was supplemented with LSO at 3% of DM than a control (Ueda et al., Reference Ueda, Ferlay, Chabrot, Loor, Chilliard and Doreau2003).
Linoleic and linolenic acid are the most abundant PUFA in fresh forage or feedstuffs (e.g. cottonseeds, linseeds) typically fed to dairy cows. It is not clear whether the presence of two (linoleic acid) v. three (linolenic acid) double bonds affects the profiles of ruminal microorganisms to different extents. Maia et al. (Reference Maia, Chaudhary, Figueres and Wallace2007) evaluated the effect of different fatty acids on growth of pure strains of ruminal bacteria. Linolenic acid was more toxic than linoleic acid, whereas eicosapentaenoic acid and docosahexaenoic acid were more toxic than linolenic acid. Although a few studies have examined the negative effect of unsaturated fatty acids on some ruminal microbiota (Ferlay et al., Reference Ferlay, Chabrot, Elmeddah and Doreau1993; Oldick and Firkins, Reference Oldick and Firkins2000), none has evaluated relative changes in the profiles of ruminal microbiota in response to dietary PUFA. Thus, the main objective of this study was to determine the effect of SBO and LSO supplementation of a high-forage diet (60% forage) on profiles of ruminal microorganisms.
Material and methods
Animals and diets
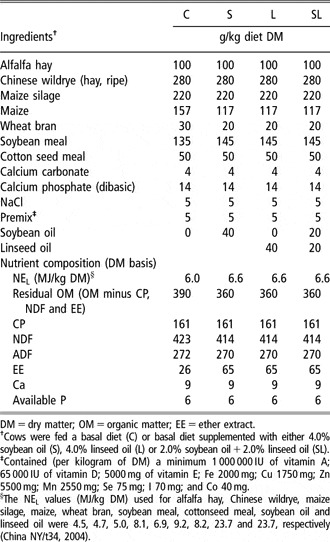
Four primiparous Holstein cows equipped with a rumen cannula ( 1C; Bar Diamond, Inc., Boise, Idaho, USA) were used in a 4 × 4 Latin square design. The average body weight and days in milk at the beginning of the experiment were 521 ± 38 kg and 45 ± 10, respectively. Dietary treatments were: control diet (C), C with 4% supplemental (wt/wt basis) SBO (S), C with 4% LSO (L), and C with 2% SBO and 2% LSO (SL). The C diet contained 60% forage and 40% concentrate (Table 1). Each period was 21 days, including 14 days to allow the cows to adjust to the diet, followed by 7 days for sampling. Cows were housed in a tie-stall barn and fed individually. The total mixed ration (TMR) diets were mixed once a day and fed twice daily in equal portions at 0800 and 2000 h. The oils were stored in a cold room at 4°C and were mixed evenly with the concentrate each morning. Supplements were stored in the shade in a cool environment until fed. Orts were restricted to 5% to 10% of intake on an as-fed basis. Procedures used for animal care and handling were approved and conducted under established standards of the Institute of Animal Science, Chinese Academy of Agricultural Sciences, Beijing, China.
Ingredient and chemical composition of total mixed diets in cows fed a control diet or C supplemented with soybean oil, linseed oil and soybean oil plus linseed oil

DM = dry matter; OM = organic matter; EE = ether extract.
†Cows were fed a basal diet (C) or basal diet supplemented with either 4.0% soybean oil (S), 4.0% linseed oil (L) or 2.0% soybean oil + 2.0% linseed oil (SL).
‡Contained (per kilogram of DM) a minimum 1 000 000 IU of vitamin A; 65 000 IU of vitamin D; 5000 mg of vitamin E; Fe 2000 mg; Cu 1750 mg; Zn 5500 mg; Mn 2550 mg; Se 75 mg; I 70 mg; and Co 40 mg.
§The NEL values (MJ/kg DM) used for alfalfa hay, Chinese wildrye, maize silage, maize, wheat bran, soybean meal, cottonseed meal, soybean oil and linseed oil were 4.5, 4.7, 5.0, 8.1, 6.9, 9.2, 8.2, 23.7 and 23.7, respectively (China NY/t34, 2004).
Sampling and analysis
Samples of TMR were collected daily, frozen and stored at −20°C. Orts were sampled twice a week from each cow, composited for each treatment, frozen and stored at −20°C until analyses were performed. Weekly representative samples of TMR and orts from each treatment were analyzed for DM content. The DM content of feed ingredients was determined by oven-drying at 60°C for 48 h. Dried feed samples from each week during the experimental period were ground in a Cyclotec1093 mill (Tecator, Hoganas, Sweden) and analyzed for concentrations of DM, CP, ether extract, calcium and phosphorus (AOAC, 1990) and of NDF and ADF (Van Soest et al., Reference Van Soest, Robertson and Lewis1991). The NDF content was analyzed by the neutral detergent solution method after pretreatment with alpha-amylase. Samples were further dried at 105°C for 8 h to determine absolute DM and all chemical analyses are expressed on DM basis.
Ruminal fluid samples for volatile fatty acids (VFA), NH3-N and pH were collected through the cannula every 2 h over 12 h on day 19 of each experimental period beginning just before the morning feeding. Whole ruminal contents were hand-collected from the anterior, dorsal and mid-ventral regions of the rumen and were squeezed through four layers of cheesecloth. The first 100 ml of strained ruminal fluid was discarded. Residual rumen fluid was immediately used to measure pH (PB-10 Standardize). Ruminal fluid samples were analyzed for NH3-N (Broderick and Kang, Reference Broderick and Kang1980). The portion of ruminal fluid (20 ml) obtained for measurement of VFA was acidified with 5 ml metaphosphoric acid (25%, w/v). Acidified ruminal fluid was centrifuged at 10 000 × g for 10 min at 4°C. The supernatant was stored at −20°C pending determination of VFA by GLC (Model Agilent6890N; Agilent Co., Wilmington, Delaware, USA). Total and individual bacterial groups (cellulolytic, proteolytic, amylolytic bacteria and total viable bacteria) numbers were assessed using the roll-tube technique (Hungate, Reference Hungate1969). Protozoa counts were assessed by microscope (Olympus DP70; Olympus, Tokyo, Japan) (Boyne et al., Reference Boyne, Eadie and Raitt1957; Dehority, Reference Dehority1984; Lu and Xie, Reference Lu and Xie1991) in ruminal fluid samples collected at 0, 4 and 8 h after the morning feeding. The ruminal samples for DNA extraction were obtained via the cannula before the morning feeding. Whole ruminal contents from the anterior, dorsal and mid-ventral regions of the rumen were squeezed by hand through four layers of cheesecloth. The strained ruminal fluid was centrifuged at 15 000 × g for 15 min at room temperature. The supernatant was discarded. The residue was immediately added to sterile normal saline and stored at −80°C. Samples for bacterial groups and DNA extraction were taken on the same day as the samples that were collected for VFA analysis.
DNA extraction
Total DNA from the ruminal fluid was extracted as described by Tajima et al. (Reference Tajima, Aminov, Nagamine, Matsui, Nakamura and Benno2001), with some modifications, using a Mini Bead-Beater-1 (Biospec Products, Inc., Bartlesville Oklahoma, OK, USA) for cell lysis. Briefly, 0.5 ml ruminal fluid mixed with 900 μl cetyl trimethyl ammonium bromide (CTAB) solution (100 mM Tris-HCl, 100 mM EDTA, 100 mM Na3PO4, 1.5 M NaCl, 1% CTAB, pH 8.0) in a 2 ml tube containing 1 g glass beads (150 μm in diameter) was shaken for 1 min at 4200 r.p.m. in a Mini Bead Beater. Tubes were then centrifuged at 12 000 × g for 10 min. The supernatant was transferred to a fresh tube and extracted with buffered phenol, chloroform and isoamyl alcohol (volume ratio, 25 : 24 : 1). The resultant supernatant was precipitated with two volumes of cold ethanol for 1 to 2 h. After centrifugation at 12 000 × g for 10 min at room temperature, the eluted DNA was washed with 70% ethanol, dried, dissolved in sterile Tris-EDTA (TE) buffer (1 M Tris-HCl, 0.5 M EDTA, pH 8.0), and treated with DNase-free RNase A. Samples were re-extracted with buffered phenol, precipitated with ethanol and dissolved in TE buffer. DNA was purified with the DNA fragment purification kit (TaKaRa Biotechnology Co., Ltd, Dalian, China) according to the manufacturer’s recommendations. Eluted DNA was dissolved in sterile TE buffer, and stored at −20°C. DNA concentrations were measured at 260 nm with a Beckman DU800 spectrophotometer (Beckman Co., Fullerton, CA, USA). On average, the DNA used for these experiments possessed an A260/A280 ratio of 1.8.
Design and synthesis of PCR primers
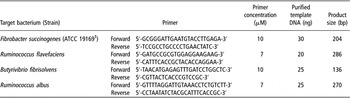
Primers designed to detect the target species are listed in Table 2. Although primers to detect the chosen bacteria are available (Asanuma et al., Reference Asanuma, Kawato and Hino2001; Koike and Kobayashi, Reference Koike and Kobayashi2001), we elected to re-design primers to obtain products of 80 to 300 bp (base pairs) as typically recommended (http://www.takara.com.cn/newproducts/015.htm). The 16S rDNA sequences of interest were downloaded from GenBank. Sequence regions specific for a given species (with 97% similarity) were searched online against the GenBank database using the Basic Local Alignment Search Tool (BLAST) family of programs to ensure the specificity of primers. The primers satisfied requirements of species conservation within a given bacteria, and specificity from other clusters of species in the phylogenetic tree. Primer sequences were then tested against online nucleotide databases to ensure their specificity. These primers also were tested for the requirements imposed by real-time quantitative PCR (see further below). Primers were designed and sequences were edited using DNAStar 5.0 (DNASTAR Inc., Madison, WI, USA). Oligonucleotides were synthesized by Sangon (Sangon Biological Engineering Technology and Service Co., Ltd, Shanghai, China).
PCR primers and template DNA for detection of ruminal bacteria

Conventional PCR
PCR was performed with the Takara Taq™ PCR kit (TaKaRa Biotechnology Co., Ltd) using PE9700 thermal cycler (PerkinElmer, Waltham, MA, USA). Amplification conditions were: one cycle at 95°C for 3 min of denaturation, 35 cycles at 95°C for 30 s, annealing at 60°C for 30 s, and extension at 72°C for 1 min. A total of 25 μl of PCR mixture contained: 2.5 μl 10× PCR buffer (100 mM Tris-HCl (pH 8.3), 500 mM KCl, 15 mM MgCl2), 10 μM each primer and 20 ng of purified template DNA concentration, 2 μl dNTP mixture (each deoxynucleoside triphosphate 2.5 mM), 2.5 U Taq™ DNA polymerase. PCR products were separated by electrophoresis on agarose gels and stained with ethidium bromide.
Sequence of amplicons
The specificity of amplification was confirmed by sequencing (Sangon Biological Engineering Technology and Service Co., Ltd). After detection of species-specific PCR amplifications in total rumen DNA, the PCR products were cloned into the TA cloning kit (TaKaRa Biotechnology Co., Ltd), and the transformants were picked randomly. Recombinant plasmids were extracted using the TaKaRa MiniBEST Plasmid Purification Kit Version 2.0 (TaKaRa Biotechnology Co., Ltd). After PCR amplification with the DNA plasmid (amplification conditions were as described above), the species-specific amplification was confirmed by sequencing (Sangon Biological Engineering Technology and Service Co., Ltd). Dilutions of purified plasmid DNA from each strain were used to construct species-specific calibration curves. These calibration curves were used for calculation of the copy of targeted species in total rumen DNA. The value of the slope of the species-specific calibration curves ranged between −3.2 and −3.6.
Real-time PCR
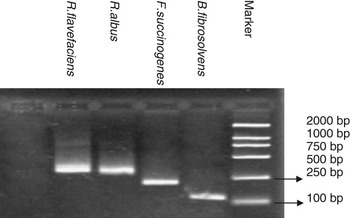
Quantification of each bacterial species was performed with an Applied Biosystems 7500 System Real-Time PCR (Model 7500; Applied Biosystems, Foster city, CA, USA). Optimal amplification conditions for each primer pair were achieved. The reaction mixture in 25 μl of the final volume contained 12.5 μl of SYBR green PCR 2× Mastermix (OBT Instruments Co., Ltd, Beijing, China), primer and template DNA (described in Table 2). Amplification involved one cycle at 95°C for 10 min for initial denaturation, and then 40 cycles at 95°C for 15 s, followed by annealing at 60°C for 30 s, and then 1 min at 72°C. Detection of fluorescent product was set at the last step of each cycle. Specificity of amplification was performed by analysis of melting curves after each amplification. The melting curve was obtained by slow heating at 0.1°C/s increments from 65°C to 95°C, with fluorescence recording at 0.1°C intervals. Additional specificity analyses included product size verification by gel electrophoresis of samples after the PCR run, and melting point determination analysis (Figure 1).
Amplification of the targeted species in total ruminal fluid DNA. DNA size marker (2000 bp) is in the far right lane.

Nucleotide sequence accession number
The 16S rDNA sequences described in this paper have been deposited in the GenBank database under accession no. AY169412 (Butyrivibrio fibrisolvens), X85098 (Ruminococcus albus), X85097 (Ruminococcus flavefaciens) and AJ496032 (Fibrobacter succinogenes).
Data analysis
All data were analyzed as a 4 × 4 Latin square using the MIXED procedure of SAS 8.2 (SAS Institute Inc., Cary, NC, USA). The statistical model included cow as random effect, and period and treatment as fixed effects. For the statistical analysis of ruminal fluid characteristics (pH, VFA, NH3-N) and microorganism counts, sampling time and sampling time × treatment were added to the model and analyzed using repeated measures. Orthogonal contrasts included: C v. oil-supplemented diets to test the effect of oil supplementation; S v. L to test the effect of high S v. high L intake; and SL v. S + L to test the additive effect of S and L. The significance level was declared at P < 0.05 unless otherwise noted. Trends for significance were declared at P = 0.05 to 0.10.
Results
Chemical composition of the experimental diets
Ingredients and chemical composition of the diets are shown in Table 1. Each treatment contained 60% forage and 40% concentrate. Oils used for diets S, L and SL were substituted for corn grain on a weight basis to achieve the desired level of supplementation. Replacing corn grain with oil supplements increased the energy content of diets in the S, L and SL diets compared with the control (6.61 v. 5.98 MJ/kg of feed DM). Because the oil content of corn grain is typically <5% of dry matter (e.g. Dhiman et al., Reference Dhiman, Helmink, McMahon, Ffie and Pariza1999; Loor et al., Reference Loor, Herbein and Polan2002), it is unlikely that it provided a quantitatively significant amount of PUFA for biohydrogenation. Milk yield and DMI during the study averaged 14.1 ± 0.3 (P = 0.75) and 12.6 ± 0.6 (P = 0.28) kg/day and no differences (P > 0.05) were observed between diets.
Ruminal fermentation parameters
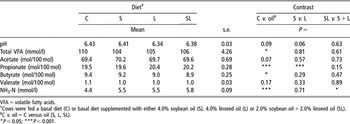
Average ruminal pH and concentrations of total VFA and NH3-N are shown in Table 3. Effect of time and time × treatment was not significant. Ruminal pH did not differ among treatments. Ruminal NH3-N concentration was greater (4.4 v. 5.6 mmol/l), and the concentration of total VFA (110 v. 105 mmol/l) was lower due to oil supplementation. Molar proportion of acetate was not affected significantly, whereas that of propionate was significantly increased and butyrate significantly decreased for oil supplementation. Feeding the blend of S and L (SL) increased (P < 0.05) NH3-N concentration to a greater extent than feeding them separately.
Ruminal pH, VFA and ammonia-N concentration in cows fed a control diet or C supplemented with soybean oil, linseed oil or soybean oil plus linseed oil

VFA = volatile fatty acids.
†Cows were fed a basal diet (C) or basal diet supplemented with either 4.0% soybean oil (S), 4.0% linseed oil (L) or 2.0% soybean oil + 2.0% linseed oil (SL).
‡C v. oil = C versus oil (S, L, SL).
*P < 0.05; ***P < 0.001.
Microorganism counts
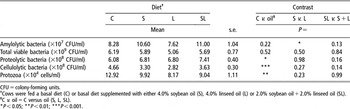
Cows fed diets with supplemental oil had lower (P < 0.05) cellulolytic bacteria (3.25 × 10⁸v. 4.66 × 10⁸ colony-forming units (CFU)/ml) and protozoa counts (9.04 × 10⁴v. 12.92 × 10⁴ cells/ml), but higher proteolytic bacteria (7.01 × 10⁸v. 6.08 × 10⁸ CFU/ml) counts compared with cows fed the control diet (P < 0.05) (Table 4). Cows fed supplemental oil had numerically lower total viable bacteria than cows fed the control diet. Counts of total viable bacteria, proteolytic bacteria, cellulolytic bacteria and protozoa in cows fed S or L were similar.
Colony counts of ruminal microorganisms from cows fed a control diet and C supplemented with soybean oil, linseed oil, and soybean oil plus linseed oil

CFU = colony-forming units.
†Cows were fed a basal diet (C) or basal diet supplemented with either 4.0% soybean oil (S), 4.0% linseed oil (L) or 2.0% soybean oil + 2.0% linseed oil (SL).
‡C v. oil = C versus oil (S, L, SL).
*P < 0.05; **P < 0.01; ***P < 0.001.
Quantification of ruminal bacteria
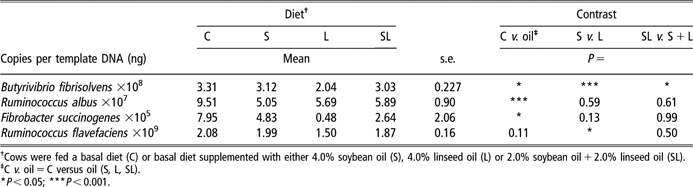
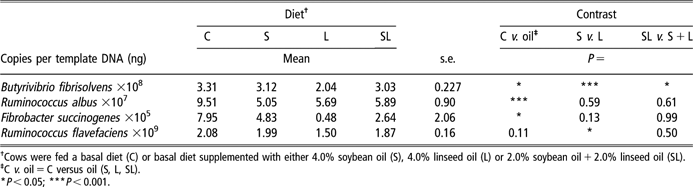
The resulting primer set (Table 2) produced PCR products of the expected size with test strains. All PCR products were of the expected size (Figure 1). The results of quantification are shown in Table 5. Overall, the quantity of B. fibrisolvens, R. albus and F. succinogenes DNA decreased (P < 0.05) by 18%, 42% and 67%, respectively, when cows were fed supplemental oil compared with control. Among oil treatments, DNA quantity of B. fibrisolvens and R. flavefaciens decreased (P < 0.05) by 35% and 25% in cows fed L v. S.
Quantification of ruminal bacteria by real time PCR in cows fed a control diet and C supplemented with soybean oil, linseed oil and soybean oil plus linseed oil
†Cows were fed a basal diet (C) or basal diet supplemented with either 4.0% soybean oil (S), 4.0% linseed oil (L) or 2.0% soybean oil + 2.0% linseed oil (SL).
‡C v. oil = C versus oil (S, L, SL).
*P < 0.05; ***P < 0.001.
Discussion
Ruminal fermentation
Oil supplementation in our study led to lower total VFA concentration. It is suggested that unsaturated FA from oil could have interfered with ruminal fermentation resulting in greater gut fill. This is supported by the observed 3% reduction in ‘residual organic matter’ digestion (which could be mainly starch) (Table 1), which accounted for the reduction in VFA concentration (ca. 4% reduction). Additionally, the shift in carbohydrate sources (i.e. relatively more (hemi) cellulose due to less corn grain) because of the substitution of grain for oil in the diets coupled with the reduction in cell wall fermentation due to reduced bacterial activity, partly explained the reduction in total VFA concentrations.
Dietary oil supplementation effects on ruminal NH3-N concentration have been variable. For example, in studies with sheep fed hay and concentrate, a decrease in ruminal NH3-N was observed with LSO supplementation (Ikwuegbu and Sutton, Reference Ikwuegbu and Sutton1982; Broudiscou et al., Reference Broudiscou, Pochet and Poncet1994). In contrast, an increase in ruminal NH3-N was observed in steers fed grass silage and concentrate (Scollan et al., Reference Scollan, Dhanoa, Choi, Maeng, Enser and Wood2001) or fed supplemental SBO or LSO (Brokaw et al., Reference Brokaw, Hess and Rule2001; Ueda et al., Reference Ueda, Ferlay, Chabrot, Loor, Chilliard and Doreau2003). Our results were consistent with those found previously in bovine. In this study, protozoal counts decreased and proteolytic bacteria counts increased with supplemental oil, which likely accounted for the increase in ruminal NH3-N concentration. Supplemental oil resulted in greater proteolytic bacteria counts, possibly due to a decrease in protozoa counts and predation. The greater content of proteolytic bacteria likely accelerated protein degradation, causing ruminal NH3-N concentration to increase. Furthermore, increased ruminal NH3-N concentration could possibly be associated with a decrease in microbial protein synthesis by ruminal microbes.
Ruminal microorganisms
Over the years, it has been well recognized that supplemental oil affects certain aspects of microbial metabolic activity and/or modifies the microbial population in the rumen that are involved with cellulose digestion (White et al., Reference White, Grainger, Baker and Stroud1958; Ørskov et al., Reference Ørskov, Hine and Grubb1978). Changes in the ruminal microbiota, as well as increased availability of free fatty acids in the rumen, are major factors affecting ruminal digestion. Some researchers have explained these effects based on (i) direct disruption of microbial cell membrane and cellular function by the unsaturated fatty acids, (ii) lipid coating of bacteria and feed particles, (iii) toxicity of cellulolytic bacteria by long-chain fatty acids and (iv) affecting bacterial population distribution due to antimicrobial effects of fatty acids (Jenkins, Reference Jenkins1993). In the study of Ferlay et al. (Reference Ferlay, Chabrot, Elmeddah and Doreau1993), PUFA had a more negative effect on the metabolism of cellulolytic bacteria than saturated fatty acids. Few experiments, however, have evaluated changes in the profiles of ruminal microorganisms in response to dietary PUFA.
In the present study, cows fed supplemental oil had considerably lower numbers of cellulolytic bacteria, which likely accounted for the lower ruminal digestibility of NDF (56% v. 51%) and ADF (53% v. 50%) we observed (Hu et al., Reference Hu, Wang, Bu, Yang, Deng, Wei and Zhou2007). Unsaturated fatty acids have been reported to have direct inhibitory effects on ruminal protozoa (Oldick and Firkins, Reference Oldick and Firkins2000). Linoleic acid is toxic to ruminal protozoa and previous research has shown a consistent decrease in protozoal counts in vivo (Sutton et al., Reference Sutton, Knight, McAllan and Smith1983; Hristov et al., Reference Hristov, Ivan and McAllister2004) and in vitro (Newbold and Chamberlain, Reference Newbold and Chamberlain1988). Hristov et al. (Reference Hristov, Kennington, McGuire and Hunt2005) reported in vitro data showing 48%, 88% and 100% eradication of ruminal protozoa with inclusion of 0.25%, 0.5% and 1% linoleic acid, respectively, in the incubation media. Another study showed that oleic acid at 0.25%, 0.5% and 1% decreased protozoal counts by 26%, 45% and 78%, respectively (Hristov et al., Reference Hristov, Ivan and McAllister2004). Further, Oldick and Firkins (Reference Oldick and Firkins2000) observed a linear decrease in ruminal protozoa with increasing degree of unsaturation of dietary fats. In our study, a marked decrease in protozoa and cellulolytic bacteria numbers were observed when oils were supplemented. These effects were possibly associated with direct inhibition and/or coating action of the unsaturated fatty acids on microorganisms.
There is a paucity of data regarding the effects of supplemental oil on other bacterial (except for cellulolytic bacteria) populations in cattle. In the present study, total viable bacteria and amylolytic bacteria counts were not affected by oil. However, oil resulted in greater proteolytic bacteria counts possibly resulting from a decrease in protozoa as observed in cows fed L or S compared with fish oil (Loor et al., Reference Loor, Ueda, Ferlay, Chilliard and Doreau2005b).
The extreme complexity of the ruminal microbiota has been uncovered in numerous publications that employed isolation of pure cultures. However, culture-based approaches are very time- and labor-consuming, and the results, which are based on phenotypic characteristics, are not precise or conclusive. Modern molecular techniques based on sequence comparison of nucleic acids (DNA and RNA) offer certain advantages. These techniques can be used to provide molecular characterization and a classification scheme that predicts natural evolutionary relationships without cultivating the microorganisms (Mackie et al., Reference Mackie, Aminov, White and McSweeney2000), but also can be suitable for quantifying microorganisms (Reilly and Attwood, Reference Reilly and Attwood1998). Advances in molecular microbial technique allowed us to quantify four ruminal bacteria that play key roles in aspects of ruminal biohydrogenation (e.g. lipid metabolism in ruminants). We specifically set out to design and validate PCR primers for detection of the chosen ruminal bacteria. These primers were designed to satisfy the stringent criteria required in real-time PCR quantification of a target in a microbial community DNA mixture. Butyrivibrio fibrisolvens is the most active bacterial species in the biohydrogenation of PUFA in the rumen (Jenkins, Reference Jenkins1993). Ruminococcus albus also plays a role in the biohydrogenation of PUFA in the rumen. They remove unsaturated double bonds in order to detoxify the PUFA and enable growth of the bacterium (Devillard et al., Reference Devillard, Andant and Wallace2006).
In the present study, we observed that cows fed S or L or SL had lower DNA quantity of ruminal bacteria associated with biohydrogenation (B. fibrisolvens and R. albus) and also fibrolytic bacteria (F. succinogenes and R. flavefaciens). Kepler et al. (Reference Kepler, Hirons, McNeill and Tove1966) reported that PUFA were particularly toxic, and other long-chain fatty acids were toxic to some of the cellulolytic bacteria also found in the rumen (Maczulak et al., Reference Maczulak, Dehority and Palmquist1981). Furthermore, it appeared that L had a more potent inhibitory effect on ruminal microbiota. In the present study, cows fed L had lower DNA quantity of B. fibrisolvens and R. flavefaciens compared with cows fed S. Our results (except for R. albus) were consistent with those from a recent study by Maia et al. (Reference Maia, Chaudhary, Figueres and Wallace2007), who reported that linolenic acid was more toxic than linoleic acid. In fact, the inhibitory effect of unsaturated oils on ruminal bacteria appears to be associated with the degree of unsaturation of the fatty acids, e.g. two unsaturated double bonds (linoleic acid) v. three double bonds (linolenic acid). Oldick and Firkins (Reference Oldick and Firkins2000) observed a linear decrease in ruminal protozoa with an increasing degree of unsaturation of dietary fats when diets (48.5% maize silage and 51.5% concentrate) added 4.85% fat from prills of partially hydrogenated tallow, tallow or animal-vegetable fat.
Conclusions
Similar to previous studies, we observed that oil supplementation (4% of diet DM) to dairy cows decreases ruminal fermentation leading to lower VFA concentrations. Populations of ruminal microorganisms also were affected by LSO and SBO, with total protozoa and cellulolytic bacteria being reduced, and total proteolytic bacteria being increased by oils. Our data are some of the first to use molecular techniques to quantify detrimental effects of dietary PUFA on key ruminal bacteria with major roles in fiber digestion and biohydrogenation. In this context, our results clearly showed that, at the same level of supplementation linolenic acid was more potent than linoleic acid in reducing the amount of B. fibrisolvens, F. succinogenes and R. flavefaciens. Detrimental effects of oils on ruminal microorganisms could partly explain the observed effects on ruminal fermentation parameters.
Acknowledgements
This work was partially funded by the Ministry of Science and Technology and Ministry of Agricultural grants (Nos. 2006BAD12B08, 2006BAD04A08 and 2006DFB32160). The authors sincerely thank the staff of the ruminant nutrition Lab, Institute of Animal Science, Chinese Academy of Agricultural Science for all their full practical assistance and technical support. The authors also appreciate Dr Weidong Deng for providing help with bacterial cultures.