

This issue of return to work following an accident or injury is a topic of both theoretical and practical importance. For the most part, work-related injury has been considered mainly in terms of causation (Driscoll, Harison, Bradley, & Newson, Reference Driscoll, Harrison, Bradley and Newson2008), incidence (Safe Work Australia, 2012), or in relation to specific conditions such as back pain, brain injury, or psychological impairment (Hush, Reference Hush2008; Wall, Morrissey, & Ogloff, Reference Wall, Morrissey and Ogloff2008). What has been lacking and in need of further study has been a valid measure to predict rehabilitation potential across the range of chronic conditions encountered in everyday practice. The aim of this paper was to describe the qualities of an index for use in assessing the vocational rehabilitation potential in the context of compensable injuries.
The literature on return to work following occupational injuries is vast and has pointed to a variety of factors. In fact, Krause, Frank, Dasinger, Sullivan, and Sinclair (Reference Krause, Frank, Dasinger, Sullivan and Sinclair2001) identified over 100 different determinants of return to work. but no single factor has achieved prominence as a predictor. For instance, in the case of mild traumatic brain injury most workers return to work within 3–6 months and the best predictors were educational level, chronic pain and job-related factors (Cancelliere et al., Reference Cancelliere, Kristman, Cassidy, Hincapie, Cote, Boyle, Carroll, Stainacke, de Boussard and Borg2014). Educational level, occupational level, brain injury severity, sex, race and psychological impairment were highlighted by Saltychev, Eskola Tenovuo, and Laimi in a systematic review of the literature from 1990. In the case of back pain, Wynne-Jones et al. (Reference Meehl2013) reviewed 34 studies and reported that 68.2% of people with back pain returned to work. For work-related hand injuries, return to work rates of 78.1% were reported (Hu et al., Reference Hu, Jiang, Youxin, Yu, Leng and He2012). Accordingly, there is a considerable scope to examine empirically, the validity of those factors that have been hypothesised as related to a return to work.
The Vocational Rehabilitation Index (Cornes & Roy, Reference Cornes and Roy1991) is a measure of seven factors that influence return to work following occupational injury: the age of the individual, their sex, their occupational skill level, the length of medical treatment, the local labour market conditions, any history of spinal injury and the extent of any psychological problems following injury. The Association of British Insurers funded an early study of the Vocational Rehabilitation Index (Langman, Reference Langman2012). They found that the Vocational Rehabilitation Index discriminated between those who did return to work and those who did not.
In Australia, the research on the Vocational Rehabilitation Index has found application in quality of life following compensable injury (Athanasou, Reference Athanasou2015) as well as a general employability measure (Athanasou, Reference Athanasou2017). The study sought to address two questions: (a) How employment related demographic factors of age, sex, occupation, length of treatment, local unemployment, spinal injury or psychological problems related to a return to work with compensable injury; and (b) Whether overall Vocational Rehabilitation Index status differs for those who return to work from those who do no return to work.
Method
Participants and Setting
The dataset for this study came from a private practice in vocational assessment. The participants comprised 462 compensable patients (335 males; 127 females) who varied in age from 18 to 67 years (M = 42, SD = 10). All had suffered a work-related injury relevant to the New South Wales Workers Compensation Act 1987. The length of time since the injury occurred varied from less than one year to 15 years with a mean of 3 years (SD = 2).
The types of conditions included musculoskeletal (87% – all percentages rounded); 4% mental disorder; 3% amputee (upper limb); 2% brain injury; 2% burns; 1% nervous system; 1% paraplegia and others (e.g., Q fever, sight loss).
Most patients underwent some surgery (61%), while another 5% were admitted to hospital and 34% were not admitted to hospital. Disc injuries were reported in 44% of cases and a neck or whiplash-type injury occurred in 12% of cases while 44% did not report any back injury. Major or minor psychological difficulties were recorded in 44% of cases and no psychological difficulty occurred in just over 56%. For 44 patients, the average rating of whole person impairment based on the American Medical Association was available and this ranged from 4% to 89% with an average of 21% (SD = 14%).
In terms of educational background, only 28% had completed the highest level of secondary schooling. The majority (42%) had completed Year 10 (in Australia the earliest certificate upon leaving school) and 25% had less than Year 10. Most the participants had no formal post-school qualification (55%). Around 11% had a degree or diploma and 34% had a certificate or trade-level qualification. In terms of occupational background, more than half were labourers (57%). These were followed by trades (14%), professionals and associate professionals (8%), service workers (8%), sales (5%), intermediate production and transport (5%) and clerical (4%).
Patients came from urban (N = 336) as well as regional or rural areas (N = 126). Most patients (60%) came from areas of high (i.e., above average) local unemployment, 27% from areas of medium unemployment, and 13% from areas of low local unemployment. A complete copy of the dataset and the coding details are available from the author upon request.
Data Collection and Procedures
The participants underwent a medico-legal assessment comprising a structured evaluation of educational, vocational, medical and social background as well as a range of rehabilitation assessments. All persons had a whole person impairment greater than 10%, which is mandatory requirement for compensation.
The Vocational Rehabilitation Index is classified into four age categories: 16–30 years (1 point), 31–40 years (2 points), 41–50 years (3 points) and 51 or more years (4 points). Sex is categorised as 1 (males) and 2 (females). Occupation in the Vocational Rehabilitation Index is coded as professional/associate professional (one point), skilled manual (two points), semi-skilled manual (three points), other non-manual (four points) and unskilled manual (five points). Length of treatment in the Vocational Rehabilitation index is categorised as 1 point for less than six months, two points for 6–12 months, three points for 13–18 months and four points for 19 or more months. Time since the accident was used as a de facto but objective standard for the length of treatment, since for the most part participants were still seeing doctors. Length of treatment (i.e., time since the accident) was categorised using the same ratings from one point (less than 12 months), two points (12 months), three points (13–24 months) and four points (longer than 24 months). The labour market prospects were defined in relation to the national unemployment rate as one point for low unemployment (2% less than the national average), two points for medium unemployment and three points for high unemployment (2% higher than the national average). Spinal cord injury is categorised as one point for no injury, two points (whiplash, simple fracture) and three points (lumbar disc lesion, spinal cord injury) based only on medical reports and a formal diagnosis. Psychological problems were classified as one point (no psychological problem), two points for minor psychological problems (post-traumatic neurosis, anxiety state) and three points for major psychological problems (personality change, cognitive deficit, functional overlay, poor motivation).
Analysis
The overall Vocational Rehabilitation Index scores were originally categorised by Cornes (Reference Cornes1990), viz.: 7–11 (lower group), 12–14 (lower middle group), 15–17 (upper middle group) and 18–24 (upper group). Those with the lowest Vocational Rehabilitation Index scores had the lowest need for vocational rehabilitation services.
The analysis reported the descriptive statistics on return to work for each factor in the index. Where necessary comparisons were tested using univariate analysis of variance, chi-square, or t-tests. Further details are provided in the results section.
Results
Employment status since accident
At the time of assessment only 23% had returned to work. Just on 30% of the patients had not worked and some 48% had returned to work but were now not working. Of those who were working, only 14% returned to the same employer in the same job; 37% were in a different job with the same employer; and the majority (49%) were with a different employer in different job.
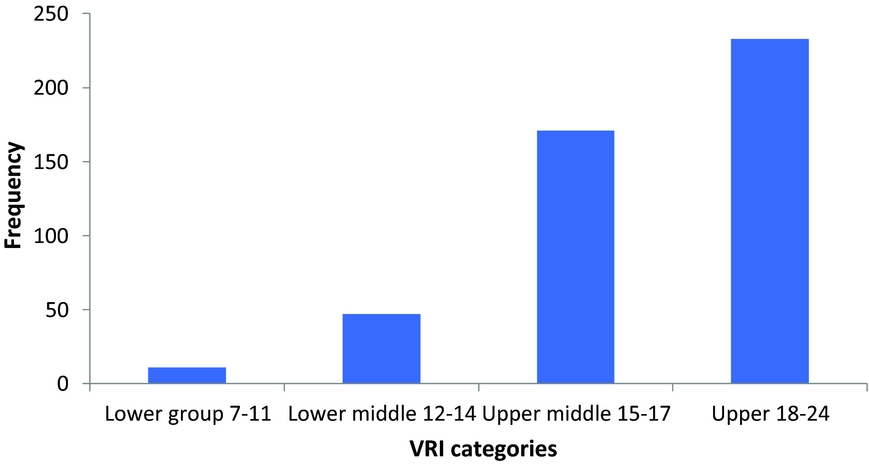
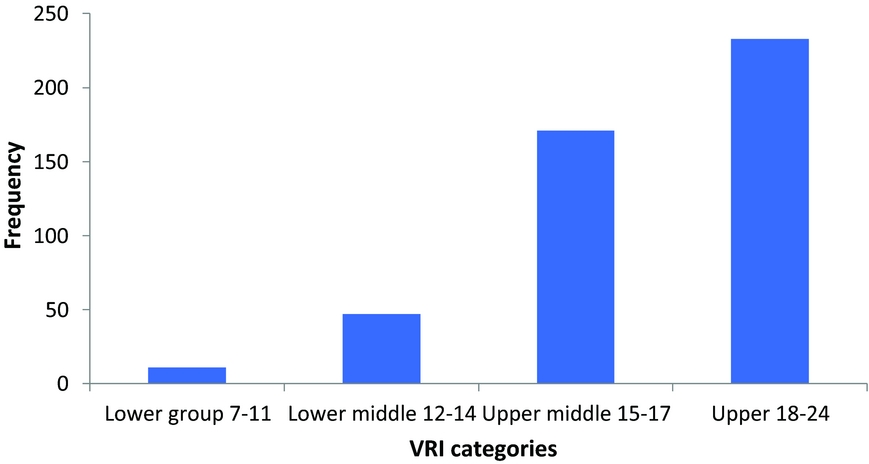
The distribution of scores across the Vocational Rehabilitation Index categories was skewed (Figure 1). The majority of participants fell into the upper middle (15–17) and upper categories (18–24). There was a statistically significant difference (t(275) = 2.305, p = 0.010, d = 0.238) in Vocational Rehabilitation Index scores between those who were working and those who were not working. The Vocational Rehabilitation Index scores of those who returned to work (M = 16.977, SD = 2.367, 95% C.I. = 0.4409) were lower than those who were not working work (M = 17.567, SD = 2.750, 95% C.I. = 0.0351). The overall effect size (d = 0.238); however, is low. The next sections examine the influence on return to work of various factors that comprised the Vocational Rehabilitation Index.
Distribution of Vocational Rehabilitation Index scores (N = 462).
Age
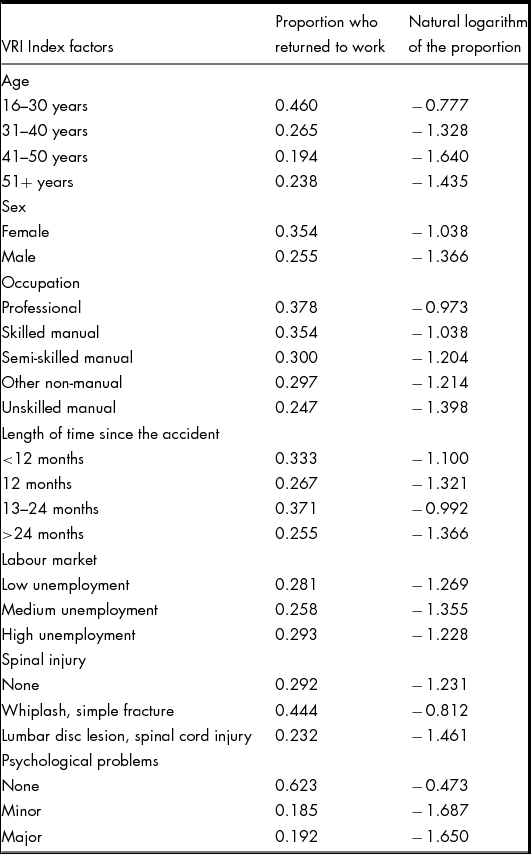
Age was a factor in return to work (χ 2 (3) =21.62, p < 0.0001). The proportions who returned to work in each age group were 0.46 for 16–30 year olds, 0.65 for 31–40 year-olds and 0.194 for 41–50 years but for those over 51 years it rose slightly to 0.238. At each age level, the proportion who returned to work was well below the proportion of those who were not working. The results for the different age groups as well as the other subsequent vocational factors are summarised in Table 1.
Vocational rehabilitation factors and the proportion returning to work (N = 461)

Sex
Although females constituted just over one-quarter of the participants, they had a statistically significant different pattern of return to work (χ 2 (1) = 3.94, p < 0.05). The proportion of females who returned to work was 0.354 compared with 0.255 for males.
Occupation
The proportion returning to work was highest for professional-associate professionals and decreased monotonically across the groups and was lowest for the unskilled manual workers. The pattern was not statistically significant (χ 2 (4) =4.97, p = 0.290).
Length of treatment
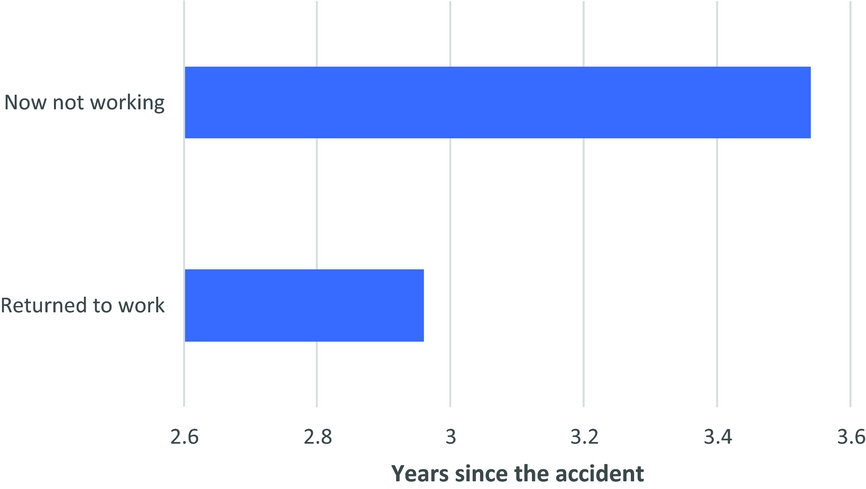
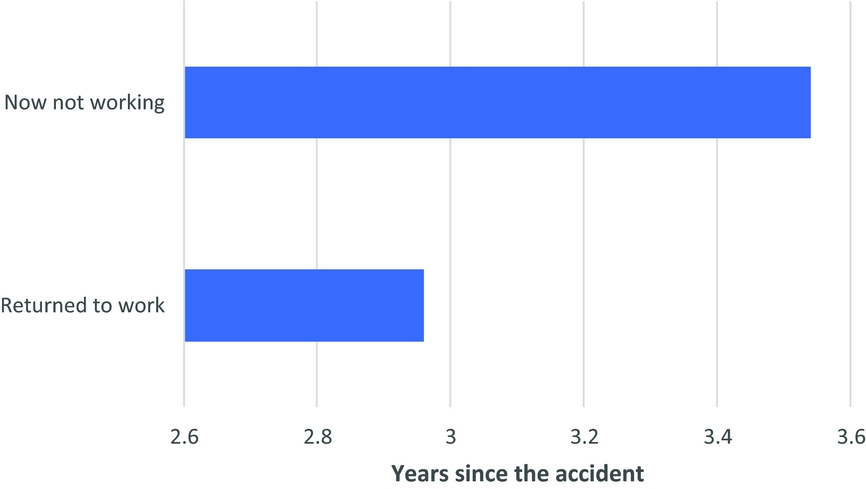
The length of treatment defined in terms of the period of time since the accident had a statistically significant effect on the type of return to work. The mean time since the accident was lowest for those who returned to work (t(286) = −3.03, p < 0.01). The differences between the groups are displayed clearly in Figure 2.
Period of time since the accident and its relations to return to work status (N = 461).
The proportion of participants returning to work was lowest for those with more than two years since the accident. Nevertheless, there was no statistically significant difference in the proportions of participants returning to work or not working (χ 2 (3) = 5.36, p = 0.147).
Labour market
Labour market conditions were not related to return to work (χ 2 (2) = 0.52, p = 0.771). Return to work rates were not related to the level of unemployment and in this instance the proportion of participants returning to work were highest for those in areas of high unemployment.
Spinal injury
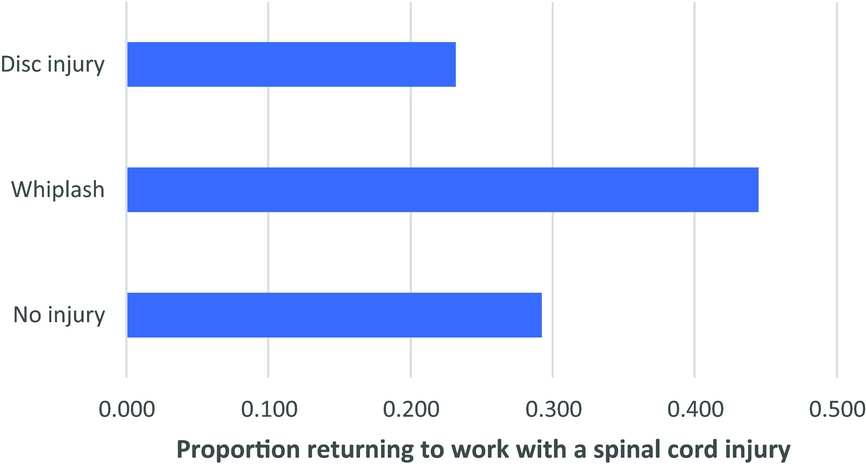
The proportion of those returning to work was higher for those with a whiplash injury (0.44) compared to those with a disc injury (0.23). Although the pattern of return to work or not working was statistically significant there was no direct relation between the seriousness of a spinal injury and return to work (χ 2 (2) = 9.66, p = 0.008). For instance, those with a whiplash injury had a higher rate of return to work (Figure 3).
Return to work according to the extent of spinal cord injury (N = 461).
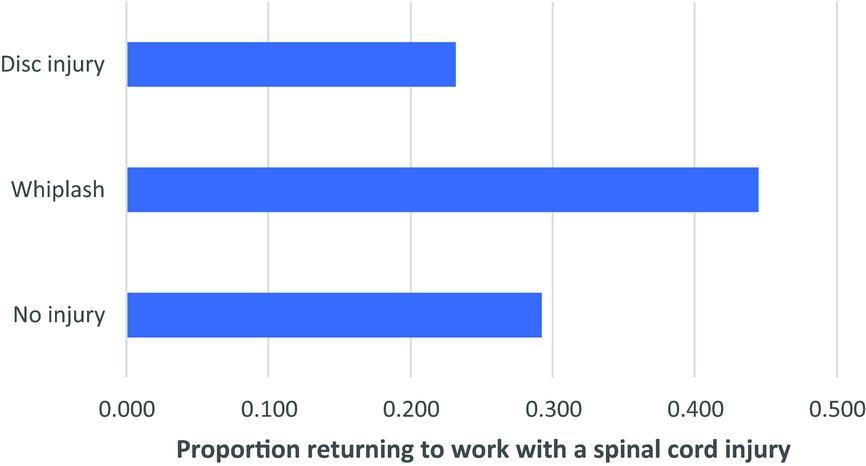
This result may be an artefact as having no spinal injury may also include those with other types of serious injury.
Psychological problems
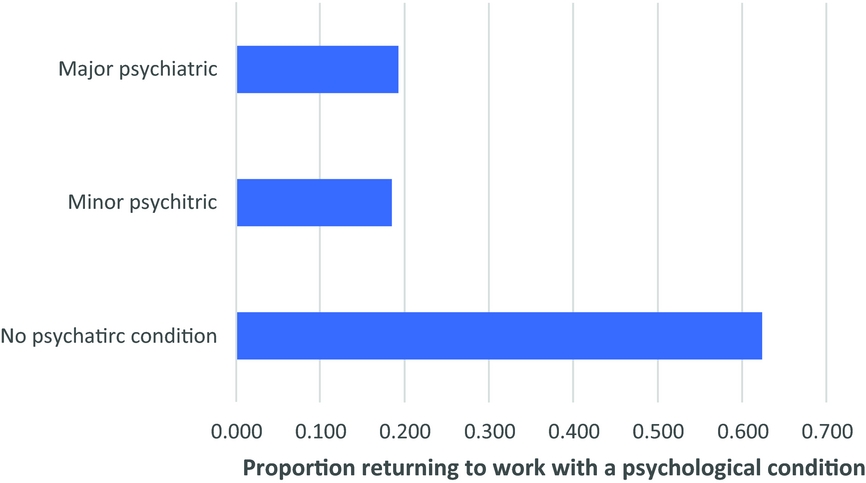
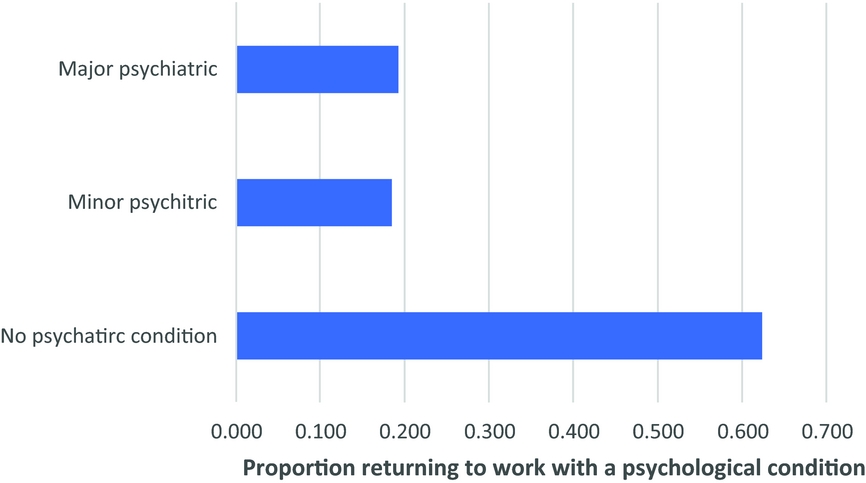
The proportion of those returning to work was substantially lower for those with a minor or major psychiatric condition although the pattern of not working or retuning to work was not statistically significant (χ 2 (2) = 2.86, p = 0.239). Of those who returned to work, 62% did not have psychiatric problems compared with 18% for those with a minor psychological problem and 19% for those with a major psychological problem (Figure 4).
Return to work according to the extent of psychological injury (N = 461).
Discussion and Conclusions
First, an overall evaluation of vocational potential in terms of the Vocational Rehabilitation Index does provide a valid albeit imperfect index. It captures some of the factors that relate to employment potential following a work accident. There was a statistically significant difference in the Vocational Rehabilitation Index scores of those who returned to work and those who were not working. As noted, the effect size was low. Second, the results of this study confirm the findings of earlier investigators (Cancilliere et al., Reference Cancelliere, Kristman, Cassidy, Hincapie, Cote, Boyle, Carroll, Stainacke, de Boussard and Borg2014; Krause, Frank, Dasinger, Sullivan, & Sinclair, Reference Krause, Frank, Dasinger, Sullivan and Sinclair2001; MacEachern, Clarke, Franche, Irvin, Reference MacEachen, Clarke, Franche and Irvin2006) that these seven factors have some utility as prognostic indicators.
The limitations of this study arise from the fact that the grading of categories and their numbering form 1–4 is arbitrary. This is a form of numeration rather than quantification as there are no formal units of vocational potential. For instance, the arbitrary allocation of one point to male and two points to female or a scale of one to three for psychological injury is problematic to say the least (for a discussion on this topic see Athanasou, Reference Athanasou2017, pp. 131–152). The grading for sex in particular, may not be valid as in this study females had a higher rate of return to work.
The utility of the Vocational Rehabilitation Index may have been understated in large part by the fact that all participants in the study had a whole person impairment of at least 10%. This means that from the outset the study is biased towards those that were more seriously injured. Indeed, the findings concerning the Vocational Rehabilitation Index may be conservative and have greater validity if they were investigated in a general population of all work injury cases. Of course there are other factors, such as secondary gain, family support, extent of vocational rehabilitation, job search or job modification that could influence the results. No claim was made that the Vocational Rehabilitation Index is a complete analysis of all factors pertinent to return-to-work.
Given that 23% of all cases returned to work, any indicator from the Vocational Rehabilitation Index would need to match or exceed this criterion to be deemed to have prognostic value. Younger patients had a higher chance of returning to work than the 23% criterion, as did females (35.5%). Similarly, professionals and skilled workers had above average return to work potential. The length of time since the accident was of variable importance but was certainly lowest for those who had been receiving treatment for the longest time. The level of local unemployment was not of much prognostic help. One potential reason is that the population of accident victims is not random but is skewed to those from lower socioeconomic groups who tend to reside in areas of medium to high unemployment. The findings relating to the higher rate of return to work of whiplash compared to other back injuries confirms an earlier finding (Athanasou, Reference Athanasou2005).
The findings of this study indicated that – in theory – a young woman working as a professional at the time of the injury but living in an area of local high unemployment, who had a whiplash injury and who had been under treatment for some 13–24 months but had no psychological problems had the best chance of returning to work. At the other end of the spectrum, a male aged 41–50 years with a back injury and minor psychological problems, who had been working in an unskilled job, who had been receiving treatment or out of work for more than two years and who lived in an area of medium unemployment presented the worst case scenario. These scenarios are reasonably consistent with clinical experience in vocational rehabilitation.
In coming to this tentative theoretical conclusion, one is actually converting the proportion who returned to work in Table 1 into a natural logarithm and in essence adding them (or alternatively simply multiplying proportions). This implies that a multiplicative rather than an additive view of the factors may well provide a better prognostic indicator of return to work following an accident or injury at work. Future research will investigate the validity of this synergistic or multiplicative view in relation to motor vehicle accidents and general liability claims. For rehabilitation counsellors, agency managers, insurers or policy makers, the results from this study can be used to explore the utility of an Australian Vocational Rehabilitation Index to guide the allocation of funding and services to those case most likely to benefit. Practitioners may wish to explore the validity of the categories, the original coding values or the suggested natural logarithms as a basis for routine use in rehabilitation services.
Acknowledgement
The helpful comments of Prof Elias Mpofu and an anonymous reviewer are gratefully acknowledged.
Conflict of Interests
None.
Funding
This research received no specific grant from any funding agency in the public, commercial or not-for-profit sectors.