I. INTRODUCTION
The crisis of energy resources is continuously deteriorating along with increasing cost, unemployment, and serious environmental impact. As a consequence, creative energy generators and energy storage (ES) devices are becoming focused topics of current research. Solar, wind, tide, hydrogen, and nuclear energy have been investigated to be the alternatives of conventional fossil fuels due to continuous energy and less influence on the environment. Nevertheless, how to store and deliver such energy becomes the contemporary handicap. Considering traditional rechargeable batteries, they have low-energy density and vulnerable stability for consecutive use. To overcome these drawbacks, it has become increasingly important to develop peculiar ES devices with large energy density, fast charging capability, and notable durability, and lithium ion (Li-ion) batteries have been one of the most widely studied ES devices.Reference Chen, Zhu, Li, Chen and Yan1–Reference Verma, Maire and Novak3 In comparison, supercapacitorsReference Bello, Fashedemi, Fabiane, Lekitima, Ozoemena and Manyala4–Reference Bhattacharjya, Kim, Bae and Yu6 unfortunately possess low-energy density and serious self-discharge even though their capacitance is able to remain for more working cycles. Moreover, along with shallow voltage windows, supercapacitors generally discharge in only hundreds of seconds, whereas lithium ion batteries can supply energy for tens of hours consistently. On the contrary, fuel cellsReference Ghasemi, Daud, Hassan, Oh, Ismail, Rahimnejad and Jahim7–Reference Yun, Lee, Lee, Lim, Park, Song and Shin10 are able to afford uninterrupted energy only if hydrogen and oxygen exist under certain conditions. However, insufficient hydrogen extremely limits the application and escalates the cost. Therefore, lithium ion batteries are becoming the potential distinction of next-generation ES devices due to their large energy density, superb durability, and acceptable cost.
At present, graphiteReference Safari and Delacourt11,Reference Banks and Compton12 has been commercialized to make lithium ion batteries for portable devices and stationary power. However, one detrimental shortcoming is the low capacity of conventional batteries. Around 300 mA h/g of commercial graphite electrode is inadequate for developed equipment, such as high-performance laptops, electrical vehicles, and long-distance unmanned aerial vehicles. To overcome this, various materials are fabricated to substitute graphite as an anode of lithium ion batteries. Transition metal oxides (TMO), like manganese oxide, have attracted significant attention as a potential anode materialReference Bai, Fan, Sun, Ju, Guo, Yang and Qian2,Reference Mai, Shi, Zhang, Lum, Gu and Tu13–Reference Lavoie, Malenfant, Courtel, Abu-Lebdeh and Davidson16 for high theoretical capacity (937 mA h/g for Mn3O4)Reference Bhattacharjya, Kim, Bae and Yu6,Reference Ghasemi, Daud, Hassan, Oh, Ismail, Rahimnejad and Jahim7 and copious reserves. In contrast to being popularized, TMO always suffers from severe pulverization resulting from hyperbolic inflation of volume during charge/discharge processing, which disastrously leads to rapid decay of capacity. Additionally, low intrinsic electric conductivity further obstructs the application of Mn3O4 in batteries. Nevertheless, Mn3O4 is an attractive alternative because it is environmentally friendly, low-cost, and abundant in TMOs.Reference Wang, Cui, Yang, Casalongue, Robinson, Liang, Cui and Dai15,Reference Zhang, Han, Gu, Zhang, Liu, Kong, Zhang, Dong, Zhang, Yao, Xu, Cui and Chen17 Therefore, it becomes of significance to combine TMOs and other conductive materials to enhance electric conductivity and reduce detrimental expansion.Reference Li, Cao, Shao, Li, Qu and Yin18–Reference Yu, Park, Davies, Higgins, Chen and Xiao20 For the above purpose, graphene is an ideal candidate due to its excellent mechanical flexibility and electrical conductivity,Reference Chen, Zhu, Li, Chen and Yan1,Reference Lian, Zhu, Liang, Li, Yang and Wang21,Reference Huang, Zeng, Fan, Liu and Zhang22 which leads to higher capacity with long-time durability.
Herein, 3D nanostructured graphene oxide–Mn3O4 (GO–Mn3O4) anode materials were successfully synthesized through the coprecipitation method under high-temperature and high-pressure.Reference Wang, Cui, Yang, Casalongue, Robinson, Liang, Cui and Dai15 Through this method, reduced graphene oxide (GO) layers and Mn3O4 nanoparticles were blended uniformly in one step from GO suspension and manganese acetate solution. The decoration of Mn3O4 nanoparticles on the surface of GO provides a 3-D structure of graphene layers to avoid stacks of plenty of graphene layers, so as to serve more active surface area and protection for Mn3O4 nanoparticles.
Powder x-ray diffraction (XRD), scanning electron microscopy (SEM), and scanning probe microscopy (SPM) were used as the main tools for nanostructural characterizations. Homogeneous distribution was demonstrated with locating separate Mn3O4 nanoparticles on the surface of graphene sheets. In addition, swelling and shrinkage of Mn3O4 were observed to be constrained by SPM observations, illustrating the potential electrochemical stability of GO–Mn3O4 during charging/discharging. Furthermore, as-prepared graphene–Mn3O4 was used as an anode active material of Li-ion batteries in two-electrode Swagelok-type cells. Different kinds of electrochemical measurements, such as impedance spectroscopy, cyclic voltammetry (CV), and galvanostatic cycling, were taken in series to test electrochemical performance.
II. EXPERIMENTAL
A. Materials
Graphite powder (SP-1) was obtained from Bay Carbon Inc. Phosphorus pentoxide (P2O5), potassium peroxydisulfate (K2S2O8), sulfuric acid (H2SO4, 95–98%), potassium permanganate (KMnO4), hydrogen peroxide solution (H2O2, 30%), hydrochloric acid (HCl, 37%), acetone (C2H6O2, >99.9%), lithium hexafluorophosphate (LiPF6, 99.99%), ethylene carbonate (EC, anhydrous, 99%), anhydrous dimethyl carbonate (DMC, 99%), poly(vinylidene fluoride) (PVDF), 1-methyl-2-pyrrolidone (NMP, anhydrous, 99.5%), lithium metal ribbon (99.9%), and manganese(II) acetate tetrahydrate (Mn(Ac)2·4H2O) were purchased from Sigma-Aldrich. Monolayer polypropylene (PP, Celgard 2400) separator was obtained from Celgard.
B. Synthesis
1. Preparation of GO solution
GO was made using a modified Hummers method.Reference Zhang, Han, Gu, Zhang, Liu, Kong, Zhang, Dong, Zhang, Yao, Xu, Cui and Chen17,Reference Lian, Zhu, Liang, Li, Yang and Wang21–Reference Wu, Ren, Xu, Li and Cheng25 Graphite powders (4 g) were firstly added to the mixture of P2O5 (3 g) and K2S2O8 (3 g) in conc. H2SO4 (15 mL) solution at 80 °C with stirring for 5 h. After that, the mixture was allowed to cool down to room temperature. Then, more DI water was used to dilute the slurry until no more heat was released. And the above solution was filtered with a Whatman filter paper (#3) and allowed to dry overnight under vacuum. In the next step, as-prepared expanded graphite was added to 150 mL conc. H2SO4 solution at ∼0 °C followed by adding KMnO4 powders (20 g) with stirring for 3 h. After the reaction, more DI water was added to make diluted solution, followed by H2O2 (80 mL, 3%) solution until the mixture turned golden yellow. In the final step, the above yellow solution was filtered using a 3 μm pore size PTFE filter and washed with HCl (200 mL, 3%), acetone (200 mL), and more DI water. After washing, the above sediment was dispersed in ethanol (10%)–DI water to make a yellow brown GO solution followed by centrifuging at 1000 rpm for 30 min. Finally, the concentration of the as-prepared GO solution was 1 mg/mL.
2. Preparation of GO–Mn3O4, Mn3O4, and GO anode materials
Three-dimensional GO–Mn3O4 composite materials were prepared by the coprecipitation method at high-temperature and pressure. First, the as-prepared GO solution (20 mL) was heated to 80 °C in a round bottom flask using a water bath. After that, Mn CH3COO)2·4H2O (89 mg) was added with stirring for 2 h to make a uniformly distributed solution. The sediments were collected by filtration of the above solution after being cooled down. Then, all the above materials were redispersed in 60 mL DI water in a 100 mL autoclave reactor (Col-Int Tech.). The above-prepared autoclave was kept in an oven or drier at 180 °C for ∼18 h. Then, the above-reacted solution was filtered under vacuum to get GO–Mn3O4 composite materials. Finally, the obtained materials were dried in a vacuum drier at 80 °C for 10 h to prepare GO–Mn3O4 active materials. The as-obtained materials owned a mass ratio of 1:1 (GO:Mn3O4). For comparison, pure Mn3O4 nanoparticles or GO nanosheets were prepared by using the same strategy: without GO solution; Mn(CH3COO)2·4H2O (89 mg) was dispersed in DI water following the same treatments of GO–Mn3O4 production for Mn3O4 nanoparticles; GO solution was sealed in an autoclave at 180 °C for obtaining GO nanosheets.
C. Preparation of electrodes
The above obtained GO–Mn3O4, Mn3O4, and GO, as active materials, were utilized to prepare working electrodes of lithium ion batteries. In the first step, specific active materials were mixed with carbon black and PVDF (wt% 80:10:10) in NMP solvent to produce a gummy slurry. Then, the slurry was coated on the surface of copper foil by a home-made doctor blading method and was dried in a vacuum oven at 80 °C for 10 h. Ultimately, the as-prepared electrodes were baked further for 2 h in an air oven. Copper needed to be cleaned ahead by 1 M HCl, 45% methanol, 70% acetone, and DI water in a medium-power sonicator. Herein, a very thin electrode was obtained in this report with a mass loading of ∼0.5 mg/cm2. If thicker electrodes were prepared, it was necessary to compress before drying in the air oven.
D. Characterizations
Powder XRD (XRD, PANalytical) was carried out using a Co Kα source (Kα1 = 1.78901 Å, Kα2 = 1.79290 Å, Kα2:Kα1 = 0.5) at 45 mA with a divergence angle of 0.3°, step size of 0.002°, and 100 s per step to detect the crystallography of GO–Mn3O4 composites and Mn3O4 particles. Standard database of Mn3O4 was referred to identify each peak present in the patterns for comparison. In addition, an x-ray photoelectron spectroscope (XPS, Thermal Scientific) was used to reveal the components of GO. Simultaneously, the architecture of the GO–Mn3O4 composite was further characterized by SEM (FEI) and SPM (Agilent Technologies). The images of SEM and SPM were validated by each other to display well-defined graphene layers decorated with Mn3O4 nanoparticles.
E. Electrochemical measurements
With as-obtained working electrodes made of GO–Mn3O4, Mn3O4, or GO, two-electrode Swagelok-type cells (X2lab, Singapore) were assembled in a glove box under an argon atmosphere with both H2O and O2 below 0.1 ppm. Li metal foil behaved as both counter and reference electrodes with an electrolyte of 1 M LiPF6 in 1:1 vol/vol EC:DMC. Then, galvanostatic cycling with potential limitation (GCPL) measurement was conducted on a MTI eight channel battery analyzer (BST8 Series) between 0.005 and 3.0 V (versus Li/Li+) at room temperature. Because both Mn3O4 and GO can store lithium reversibly, the whole weight of Mn3O4 and GO was counted to calculate current density and specific capacity. CV measurement was performed on a BioLogic SP-200 electrochemical workstation with a scan rate of 10 and 1 mV/s between 0.005 and 3 V (versus Li/Li+). Electrochemical impedance spectroscopy (EIS) was carried out on the above workstation with a frequency range from 10 to 1 MHz under potentiostatic conditions with an AC bias of 10 mV.
III. RESULTS AND DISCUSSION
A. X-ray diffraction (XRD)
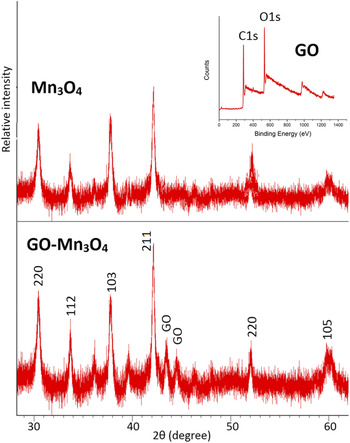
XRD patterns of GO–Mn3O4 composite materials and Mn3O4 particles are compared in Fig. 1, with the XPS spectra of GO structure inserted in the right corner. The tetragonal Mn3O4 structure mixed with a graphitic phase is obtained with Miller indices labeled on peaks by referring to the standard database of Mn3O4. There were no distinguished differences of XRD patterns between GO–Mn3O4 and Mn3O4, which affirmatively demonstrated that the same Mn3O4 material was obtained by the coprecipitation method without adding GO solution. The peak at 2θ = ∼43.517° corresponds to GO, determined by comparing with Mn3O4 particles. As established by the XPS spectrum, the as-made GO nanomaterials consist of 72% C1s, 27% O1s, and 1% N1s, based on the peak areas of such atoms.
XRD patterns of GO–Mn3O4 hybrid materials and Mn3O4 nanoparticles by the coprecipitation method: Miller indices of Mn3O4 crystal were labeled along with peaks at 2θ = 30°–60°. The inset is the XPS spectrum of GO nanostructure.

B. SEM
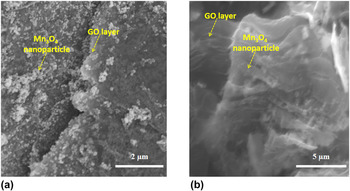
The morphologies of GO–Mn3O4 nanostructure were characterized by SEM as displayed in Figs. 2(a) and 2(b) with scale bars of 2 and 5 µm, respectively. These images showed that Mn3O4 nanoparticles with a size of ∼50 nm were homogeneously and separately distributed on the surface of reduced GO nanosheets. At the same time, GO layers were disentangled for avoiding detrimental stacking to provide more active area. Figure 2(a) precisely pointed out the size of Mn3O4 nanoparticles, which was comparable to others' work.Reference Zhao, Wang, Yang, Zhang and Zhang26–Reference Luo, Wu, Wu, Jiang, Wang and Fan29 Disjointed graphene nanosheets built the base and coverlet to support and simultaneously restrict Mn3O4 nanoparticles. The 3D nanostructure of GO–Mn3O4 is demonstrated in Fig. 2(b), a cross-sectional view of GO–Mn3O4. Mn3O4 nanoparticles had implanted the space between graphene layers to avoid significant stacking. Graphene nanosheets grew randomly to form three-dimensional structures. In this case, more active surface area was contributed to conducting electrons, fixing ions, and locating nanoparticles. At the same time, severe aggregation of Mn3O4 nanoparticles was avoided advantageously compared with the electrode of pure Mn3O4 nanoparticles. If aggregation occurred unfortunately, more Li ions would like to react with the center nanoparticles by passing through the outside shell. Such transportations would press nanoparticles to expand more and more until pulverization. In this study, however, Mn3O4 nanoparticles were isolated to decrease expansion during charging/discharging, make more use of active material, and lead to better stability of structure.
SEM images of GO–Mn3O4 electrodes: (a) 2 µm and (b) 5 µm.

C. SPM
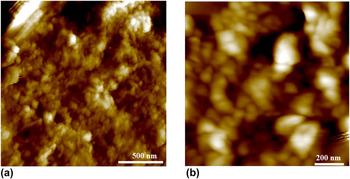
Corresponding to the SEM image in Fig. 2, the topography of GO–Mn3O4 hybrid material was repeatedly demonstrated by using SPM. Figure 3(a) was collected in air before electrochemical measurements, while Fig. 3(b) was taken after the initial charging process. Based on Fig. 3, graphene layers successfully covered all the Mn3O4 nanoparticles as blankets to protect and limit synchronously. Because the size of Mn3O4 nanoparticles was much larger than the thickness of graphene layers, alveolate projections appeared in topography images indicating locations of nanoparticles.
Topography images of GO–Mn3O4 electrodes by SPM with scale bars of 500 and 200 nm, respectively: (a) measured in air initially and (b) captured after one charge/discharge cycle.

As illustrated in Fig. 3(a), the sizes of Mn3O4 particles varied between 50 and 100 nm, which were exaggerated to some extent because of the coverage by graphene layers and tip diameter of the probe. That is echoed with the results obtained from SEM images in Fig. 2. Thus to say, Mn3O4 nanoparticles have been homogeneously distributed on the surface of graphene layers without aggregation, combinations, or overlapping. After galvanostatic charging completed, the topography image is shown in Fig. 3(b). Nanoparticles swelled with increased size by reacting with lithium ions as monitored by SPM. However, such kind of expansion was steadily confined by GO layers as the size of most particles remained between 65 and 150 nm, which was much better than the widely accepted expansion by ∼400% of pure Mn3O4 particles. Therefore, graphene is consolidated to ameliorate the cyclic stability of Mn3O4 through reducing pulverization of metal oxide. In addition, few particles still showed a contemplative expansion of ∼100%, illustrating the existence of defects. As a consequence, further ameliorating for defect-avoid nanostructures should be explored on the next stage of applying GO–Mn3O4 to batteries.
D. Electrochemical performance
1. Mechanism of redox
Swagelok-type half-cell was used to measure the electrochemical performance of GO–Mn3O4 with lithium foil as counter/reference electrode in the LiPF6 electrolyte. As a result, the reversible reaction between Mn3O4 and lithium atoms was observed with a different redox mechanism compared with traditional graphite-based Li-ion batteries. During the lithiation process, Mn3O4 powders were reduced to nanoscale Mn0, with reversible nanostructured Li2O formed simultaneously. Abu-Lebdeh's groupReference Lavoie, Malenfant, Courtel, Abu-Lebdeh and Davidson16 pointed out that during the intercalation process, each manganese atom consumed more than two electrons (e−) shown in Eq. (1), that is ∼12 times better than the graphite electrode (0.17 e− per carbon).
 $${\rm{M}}{{\rm{n}}_3}{{\rm{O}}_4} + 8{\rm{L}}{{\rm{i}}^ + } + 8{{\rm{e}}^ - } \to 3{\rm{M}}{{\rm{n}}^0} + 4{\rm{L}}{{\rm{i}}_2}{\rm{O}}\quad {\rm{.}}$$
As for the deintercalation procedure, the real mechanism was still unclarified. But a hypothesis was assumed in this study for understanding that Mn3O4 nanoparticles were reformed by electrons flowing out with two gradual steps. At first, Mn0 atoms were initially oxidized to MnO by removing two electrons per Mn [as shown in Eq. (2)]. In the second step, as-formed MnO was further oxidized to Mn3O4 with more electrons moving out [as shown in Eq. (3)]. These two delithiation processes corresponded to the obtained two peaks during oxidization in CV, which will be discussed afterward.
 $${\rm{M}}{{\rm{n}}^0} + {\rm{L}}{{\rm{i}}_2}{\rm{O}} \to {\rm{MnO}} + 2{\rm{L}}{{\rm{i}}^ + } + 2{{\rm{e}}^ - }\quad {\rm{,}}$$
 $$3{\rm{MnO}} + {\rm{L}}{{\rm{i}}_2}{\rm{O}} \to {\rm{M}}{{\rm{n}}_3}{{\rm{O}}_4} + 2{\rm{L}}{{\rm{i}}^ + } + 2{{\rm{e}}^ - }\quad {\rm{.}}$$
2. Cyclic voltammetry (CV)
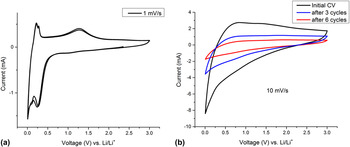
Figure 4(a) shows CV features of the GO–Mn3O4 anode at scanning rates of 10 mV/s and 1 mV/s with distinguished peaks revealing the mechanism of reaction between Mn3O4 and lithium. During the lithiation process, lithium intercalation peaks appeared between 0.007 and 0.265 V, where the reduction reaction [shown in Eq. (1)] of Mn3O4 executed intensely. Thus, Mn3O4 was converted into Mn0, whereas Li became Li2O. Then, in the lithium reduction step, the CV curve peaks at 0.22 and 1.25 V reflected as mentioned in Eqs. (2) and (3). And these peaks ensured that Mn0 was oxidized back to Mn3O4 with two reaction methods other than only one direct reaction between Mn0 and Li. Also such CV peak locations have been demonstrated by some researchers.Reference Wang, Cui, Yang, Casalongue, Robinson, Liang, Cui and Dai15–Reference Zhang, Han, Gu, Zhang, Liu, Kong, Zhang, Dong, Zhang, Yao, Xu, Cui and Chen17
CV of GO–Mn3O4 anodes applied to Li-ion batteries. The scanning rate is (a) 1 mV/s and (b) 10 mV/s.

Figure 4(b) displays the shift tendency of CV curve after GCPL cycling (initial, 3 cycles, and 6 cycles) at 10 mV/s. At high-scanning rates, redox peaks were usually not obvious to observe for lithium ion batteries because of incomplete reactions. With increase in the GCPL cycling number, CV curves became much more scale down but in a similar curve shape. The reason was that intercalation and deintercalation of Li-ions were obstructed increasingly with solid electrolyte interface (SEI) film formation during the first several charging and discharging processes. And during SEI filmformation, part of electrolyte was consumed resulting in a lower sectional electrolyte concentration. At the same time, SEI films formed between the working electrode and electrolyte dramatically increased charger transfer resistance, leading to smaller CV curves (as demonstrated in the following EIS discussion).
3. Electrochemical impedance spectroscopy (EIS)
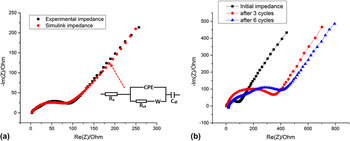
Figure 5(a) shows the initial EIS feature of the GO–Mn3O4 working electrode and comparison between initial EIS and fitting data with a best simulated circuit for this case. R e is the resistance of electrolyte, R ct represents the resistance of charger-transfer, W reflects the Warburg resistance depending on diffusion of reactants, CPE is compressed interface capacitance, and C dl represents a supplementary double-layer capacitor to best fit EIS data. All the components except C dl served as an ideal circuit of Nyquist plot, while the additional C dl reflected weak capacitor behavior of GO–Mn3O4 anodes. The initial impedance of GO–Mn3O4 [black dots in Fig. 5(a)] reflected the start point in a real axis is 2.75 Ω. And this small value indicated that the electrolyte resistance initially was negligible so as to facilitate rapid lithiation and delithiation processes. Moreover, the contrast of obtained and calculated EIS suggested that the GO–Mn3O4 electrode had capacitor effect to some degree in a low-frequency range. Therefore, the capacitor effect was to hint a potential higher lithium capacity than theoretical capacity (937 mA h/g for Mn3O4 and 740 mA h/g for graphene). Therefore, this phenomenon implied why the first discharging process reached an incredible capacitance (2514 mA h/g) beyond theoretical capacity, which will be discussed in a subsequent GCPL cycling part.
EIS measurement of GO–Mn3O4 anodes: (a) initial data and (b) after several charge/discharge cycles.

Figure 5(b) illustrates aggravated EIS performance of the GO–Mn3O4 anode along with more charging and discharging cycles. From an initial EIS curve to that after sixth cycling, the depressed semicircle was observed to become larger and larger, resulting in the capacity fading. In half-cell batteries, compressed semicircle stood for charger transfer impedance during lithium intercalation and deintercalation processes. After more charging/discharging cycles, a larger semicircle intimated the movement of lithium became more difficult causing the degradation of capacity as observed simultaneously.
4. Galvanostatic cycling with potential limitation (GCPL)
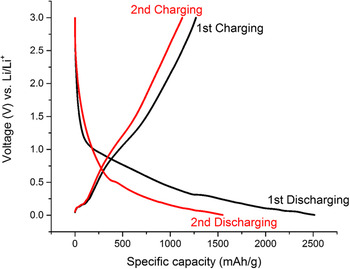
Figure 6 presents the typical charging/discharging traces in potential versus capacity of GO–Mn3O4 anode materials at a respective current density of 100 mA/g. After the first discharge, the highest discharging capacity of 2514 mA h/g reached, which was ∼270% of Mn3O4 theoretical specific capacity (937 mA h/g). This highest capacity came from follow-up principles. Above all, the capacitor effect from calculated EIS in Fig. 5(a) demonstrated that some beyond theoretical capacity was obtained like capacitor behaviors. Secondly, interfaces between electrode and electrolyte consumed more lithium to construct SEI films, bringing about conspicuous irreversible capacity as the capacity noticeably dropped during the first 6 cycles. Moreover, some capacity came from the reaction of Li-ions with oxygen from graphene nanosheets. Apart from the above mechanism, Tu and co-workersReference Mai, Zhang, Qiao, Gu, Wang and Tu14 indicated that more surface areas were available for energy conversion along with less capacity losses when Mn3O4 powders became nanoparticles. Therefore, the capacity of first several discharging processes always reached a much higher value than theoretical capacity, and the obtained capacity attenuates along with GCPL cycling due to completed SEI formation and loss of irreversible active materials.
Potential versus specific capacity curves of GO–Mn3O4 electrodes for first discharging, first charging, second discharging, and second charging processes.

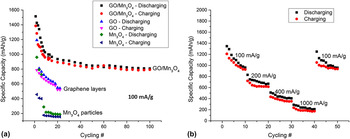
Characterizations of specific capacity at constant currents from 100 to 1000 mA/g are detailed in Fig. 7 by taking GCPL measurement. In addition, cycling capacity of pure graphene layers and Mn3O4 particles had been added as well for comparison. It was consolidated that GO–Mn3O4 hybrid materials displayed advantageous specific capacity for a long time. Figure 7(a) shows the cyclic performance of GO–Mn3O4 anodes from the second cycle at a constant current density of 100 mA/g. After 100 charging/discharging cycles, about 800 mA h/g of specific capacity was reserved with a coulombic efficiency of 98.1%. To compare, both pure GO nanosheets and manganese oxide nanoparticles were quantified at the same rate. For Mn3O4 particles, structure collapsed from pulverization after four charging/discharging cycles leading to capacity dwindling to less than 200 mA h/g. Graphene layers behaved better, but outstandingly worse than GO–Mn3O4 materials. On account of this, it was confirmed that graphene layers were able to do a favor to Mn3O4 nanoparticles for improving electrochemical performance when applied to lithium ion batteries, due to the constraint of expansion and shrinkage, fast electric conductivity, and abundant surface area. In addition, considering a commercial graphite theoretical capacity of 372 mA h/g,Reference Kang, Lahiri, Baskaran, Kim, Sun and Choi30,Reference Kaskhedikar and Maier31 GO–Mn3O4 electrodes exhibited about three times better capacity even after 100 cycles, which is of significance for next-generation ES devices. Such capacity performance is better than that of Mn3O4 nanoparticles,Reference Lavoie, Malenfant, Courtel, Abu-Lebdeh and Davidson16 carbon-coated MnO powders,Reference Zhong, Xia, Zhang, Li, Wang and Chen32 pure GO nanosheets,Reference Lavoie, Malenfant, Courtel, Abu-Lebdeh and Davidson16 and nanoscaled carbon.Reference Kawakubo, Takeda, Yamamoto and Imanishi33Figure 7(b) displays cyclic capacity of GO–Mn3O4 electrodes at varied current densities from 100 to 1000 mA/g. At a current rate of 100 mA/g, the reversible capacity of the GO–Mn3O4 anode maintained ∼926 mA h/g after 10 cycles. Furthermore, the rate capacity separately reached 616 and 352 mA h/g with a current density of 200 and 400 mA/g. Even at a notable current density of 1000 mA/g, the GO–Mn3O4 anode still obtained 174 mA h/g. When the current was retrieved back to 100 mA/g, the specific capacity simultaneously increased to ∼900 mA h/g demonstrating the excellent electrochemical stability of GO–Mn3O4 materials.
Cycling capacity of GO–Mn3O4 electrodes by GCPL at a current density of (a) 100 mA/g and (b) 100 mA/g, 200 mA/g, 400 mA/g, and 1000 mA/g, respectively.

IV. CONCLUSIONS
A one-step coprecipitation method was auspiciously developed to fabricate 3-D nanostructured GO–Mn3O4 composite materials as anodes of lithium ion batteries with enhanced energy density and sustained electrochemical stability. Through the coprecipitation method under high-pressure and temperature, Mn3O4 particles were distributed uniformly amongst graphene layers that was confirmed by using SEM characterization. As illustrated by SPM characterization, GO nanosheets wrapped Mn3O4 particles to avoid severe expansion during charge/discharge processing. At the same time, such inserted Mn3O4 nanoparticles prevented severe stacking of graphene layers to form 3D structure with more active surface area so as to facilitate the diffusion of electrons and transport of lithium ions. On the grounds of conducting electrochemical measurements, large energy density and durable lifetime have been demonstrated. The specific capacity of GO–Mn3O4 electrodes reached about 949 mA h/g after 10 cycles, compared to 300 mA h/g of graphite, and retained 792 mA h/g reversibly after 100 cycles caused by irreversible degradation of active material. Moreover, this work demonstrated the coprecipitation method to be a potent strategy for fabricating other nanostructured composite materials for abundant applications.