


1. Introduction
Isotope composition of precipitation (δD or δ18O) is closely related to the temperature of its formation (Reference DansgaardDansgaard,1964). Thus, isotope studies of ice cores may potentially provide valuable data on past climate changes (Reference PetitPetit and others, 1999).
It has been demonstrated (Reference Ekaykin and Barkov.Ekaykin and others, 1998) that the drift of snow dunes is primarily responsible for temporal oscillations of accumulation rate and thus likely of isotope composition of snow at a single point (ice core). Here we attempt to interpret the short-term δD oscillations observed in the deep Vostok (Antarctica) ice core using the new data on the present-day temporal and spatial variability of snow isotope composition in the vicinity ofVostok station.
2. Methods and Results
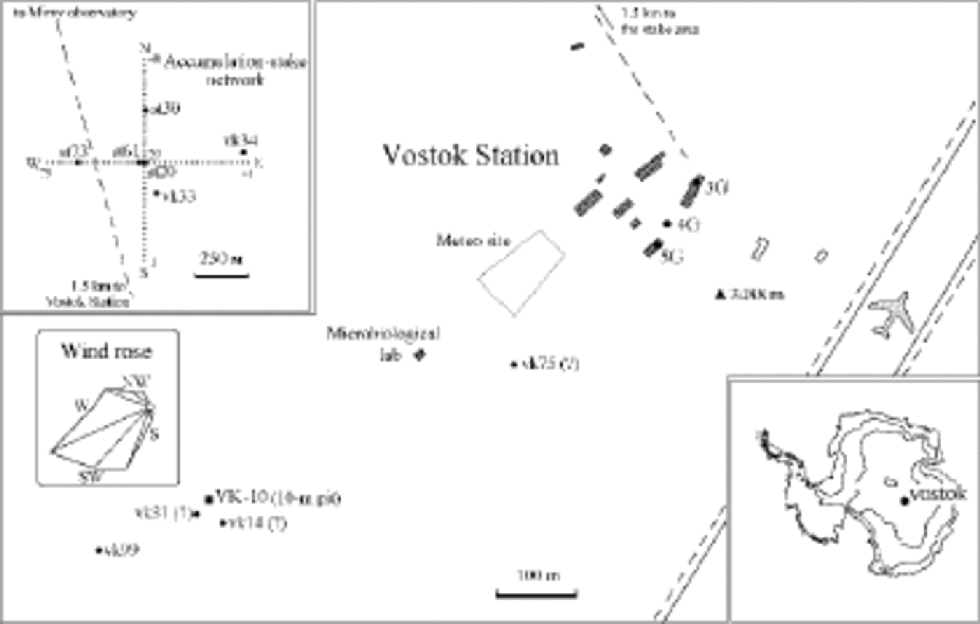
The data discussed here have been obtained from eight snow pits dug in the vicinity of Vostok station during the years 1984–2000 as depicted in Figure 1. the isotope samples were collected continuously with resolution of 2 cm (for pits vk14, st61, st73, vk99 and st30), 5 cm (vk33 and vk34) and 10 cm (vk31). Besides the pit studies, in January 2000 snow samples were collected near each stake of the north– south (NS) profile of the stake network (see Fig. 1), with samples representing the upper 10 cm layer of snow.
A schematic map of Vostok station. the pits mentioned in this paper are shown by solid circles. Question marks refer to the pits with doubtful locations.
The low mean annual temperature (–55.4˚C) and the inland location of Vostok station result in the extremely low snow-accumulation rate (2.1gcm–2 a–1; see Table 1) which is responsible for the lack of seasonal variations in snow properties and frequent layer hiatus. Accordingly, all the pits were dated using the stratigraphic observations taking into account the probability of annual layer hiatus (Reference Ekaykin and Barkov.Ekaykin and others, 1998). the initial dating was then corrected using the depths of 1955 and 1965 radioactive reference layers established for each pit, and by a comparison of snow-stratigraphy features in pits st61, st73 and st30 with accumulation measurements on the adjacent stakes located 0.1–0.3mapart from the corresponding pits.
Mean values of δD,x δ18O and snow-accumulation rate for the pits studied in the vicinity of Vostok station (see Fig. 1)

The deuterium content of the samples was measured in all eight pits, while the δ18O content was determined only for the samples from pits vk14, st61, st73 and vk99. the reproducibility of the measurements was estimated to be 0.6–0.8 (1σ) for δD and 0.03–0.06‰ for δ18O. the δD profiles from four pits are shown in Figure 2. the mean values of snow isotope composition and accumulation rate for each pit are listed in Table 1. the average δD, δ18O and d values are –440.05‰, –56.5‰ and 15.1‰, respectively. the relationship between δD and δ18O (meteoric line) is given by δD = 7.47 δ18O– 15.0.
The results of snow studies (stratigraphy, δD and d) in pits st61, st73, vk99 and st30. the annual snow build-up values measured at stakes 61, 73 and 30 were corrected for snow settling to correspond with annual layer thickness. the horizontal lines represent isochrones as indicated in the figure. Bold isochrones correspond to the reference horizons of 1955 and 1965 as determined by the total beta-activity measurements. the δD profiles smoothed with a period of 25 cm are shown by thin curves.
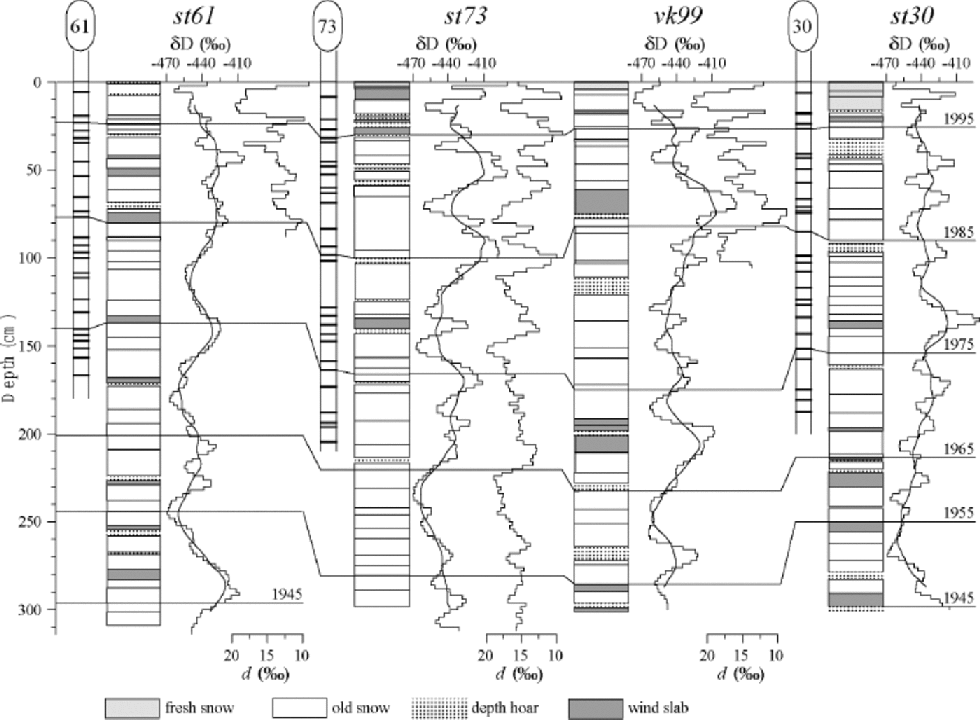
The amplitude of d variations in a vertical profile is typically 5‰ (Fig. 2), so the accuracy of measurements required for the present study is 0.8‰ and 0.08‰ for δD and δ18O, respectively, which provides an accuracy of 1‰ for the deuterium excess determination. We conclude that the accuracy of the data obtained is sufficient for the purposes of our study.
3. Discussion
3.1. Temporal variability of δD at Vostok station over the last 50 years
The main feature of measured profiles (Fig. 2) is the regular oscillations of isotope composition of snow with typical wavelengths of the order of 20–30cm and about 70 cm and with a total magnitude of about 60–80‰ for δD, the same as the seasonal change in precipitation at Vostok (Reference Gordienko, Barkov and Orlov.Gordienko and others, 1976). Similar oscillations have been discovered in the vicinity of Dome C, Antarctica (Reference Petit, Jouzel, Pourchet and MerlivatPetit and others, 1982), which resembles Vostok in its geographical and meteorological conditions (mean annual accumulation is 3.2 g cm–2).
According to pit dating, individual isotope profiles were transformed into the time series of mean-annual isotope composition of snow. Theresulting time series (see Fig. 3) cover the last 40–60 years. Figure 3 shows only weak correlation between annual δD values obtained in different pits (with a mean correlation coefficient of 0.17), which can be attributed to a high level of ``stratigraphic noise’’ in the series studied (Reference Fisher, Reeh and Clausen.Fisher and others,1985). This noise, linked with the extremely low accumulation rate, was previously found in snow accumulation series from the Vostok stake network (Reference Ekaykin and Barkov.Ekaykin and others, 1998). to reduce the noise, we constructed the stacked δD time series based on the data from eight pits. the new series, hereafter referred to as pit, is also shown in Figure 3.
The time series obtained from snow pits studied at Vostok: mean annual snow isotope composition (δD) in the individual pits vk14–st30 and the stacked pit series; T, air temperature; a, snow accumulation rate.The smoothed pit, T and a series are shown by thin lines.

According to Reference Fisher, Reeh and Clausen.Fisher and others 1985), the signal variance in a δ series is given by  where
 is the total variance and r is the correlation coefficient between two adjacent δ series. for Vostok the mean
 value equals 45‰2 (for δD). to reduce the total variance of an individual δ series to this value, the series have to be smoothed with a period of about 20 years. This period is considered to limit the resolution of time series obtained at a single point at Vostok in terms of a possible climate signal. for the pit series the required period of smoothing is then 7 years. the smoothed pit series is shown by the thin line in Figure 3.
A comparison of both the individual and stacked δD time series with the record of mean-annual air temperature, T, measured at 2m above the snow surface during the period 1958–98 reveals no significant correlation between the two parameters. At the same time, for smoothed stacked series (7 year running mean) the correlation becomes statistically significant  with the δD–T slope being 17‰˚C–1. Interestingly, a statistically significant slope of 20.3‰ ˚C–1, but for non-smoothed values of the parameters, was obtained at South Pole where snow accumulation is about four times as much as that at Vostok (Reference Jouzel, Merlivat, Petit and LoriusJouzel and others, 1983). In both cases, the temporal slope appears to be three times greater than the spatial slope typical for this region of Antarctica (Reference JouzelJouzel and others, 1997), a difference which is not yet well understood.
The lowest curve in Figure 3 is the stacked series of snow-accumulation rate deduced from the stratigraphic observations in the eight pits. One can see that δD correlates more strongly with accumulation than with temperature. This could be understood if the mean annual temperature differed significantly from the mean temperature of precipitation events which were typically associated with infrequent invasions of the warm, moist air masses into the region of Vostok station.
3.2. Spatial variability of δD of snow
As mentioned in the Introduction, redistribution of snow by wind may produce spatial and temporal variability of snow isotope composition. Here we discuss the spatial variability of snow isotope composition at Vostok station and its possible influence on the temporal δ changes at a single point.
It has been shown (e.g. Reference Black and BuddBlack and Budd, 1964; Reference Gow and RowlandGow and Rowland, 1965; Reference WhillansWhillans, 1975; Reference Van der Veen, Mosley-Thompson, Gow and Mark.Van der Veen and others, 1999) that the quasi-periodical spatial variability of snow accumulation with a wavelength of 2–40 km is caused by drifting undulations of the snow surface. Much shorter waves have been detected in the study of snow accumulation at the stake network located 1.5 km to the north of Vostok station (Fig. 1). Spectral analysis of the spatial series of annual snow accumulation (Reference Ekaykin and Barkov.Ekaykin and others, 1998) revealed four types of quasi-periodical snow-accumulation waves with typical wavelengths ranging from 50–60m to approximately 1km (waves I, II, IV and VI; see column 4 in Table 2). the evolution with time (drift) of wave IV is shown in Figure 4, as an example. from Figure 4 it is possible to calculate the mean velocity of the wave movement (e.g.12 m a–1 for wave IV) and, thus, to estimate the typical time period of the corresponding accumulation oscillations generated at a single point (~20 years). Such calculations were performed for all four types of the waves observed at the stake network. the predicted periods were found to be nearly the same as the real periods established by means of spectral analysis of the accumulation time series obtained from stakes (see column 2 inTable 2) and pits (column 3). Note that the stake series are too short to allow study of spatial variations longer than waves I and II. Finally, it was concluded that periods of about 2.5, 5, 20 and of the order of 102 years that may be found in accumulation time series obtained from a single point at Vostok station are linked with the migration of accumulation waves at the snow surface, rather than with changes in climatic conditions (Reference Ekaykin and Barkov.Ekaykin and others, 1998).
Six-year snow build-up series obtained along the NS profile of the Vostok accumulation-stake network as adapted from Reference Ekaykin and Barkov.Ekaykin and others (1998). the series were processed with a band-pass filter to extract spatial accumulation wave IV (see Table 2). DB denotes deviation of snow build-up from its average over the profile.

The oscillation periods observed in temporal and spatial series of snow isotope composition and accumulation rate at Vostok station. the typical wavelengths of the snow surface undulations as obtained by the snow surface levelling are also shown. See text for details

A levelling of the snow surface performed at the stake network in December 1999 made it possible to directly compare the spatial distribution of the snow accumulation with the snow surface height. In Figure 5a and b, the snow surface relief along the NS profile of the stake network is shown together with the 2 year (1998–99) snow build-up profile, both smoothed with a length scale of 125 m. One can see a covariation between snow-relief forms and the spatial oscillations of snow accumulation. Spectral analysis of the surface profile revealed four types of surface undulations, with horizontal lengths very similar to those of the spatial accumulation waves (cf. columns 4 and 8 in Table 2). We thus conclude that comparatively short accumulation waves observed at Vostok are strongly linked through snow redistribution by wind with the undulations of the snow surface.
The surface profile in December 1999 (a), 2 year (1998–99) snow build-up (b), δD and d profiles (c and d, respectively) measured in 10 cm samples. All the profiles represent a 125 m running mean. Note that the general slope of the snow surface is subtracted from the surface profile.
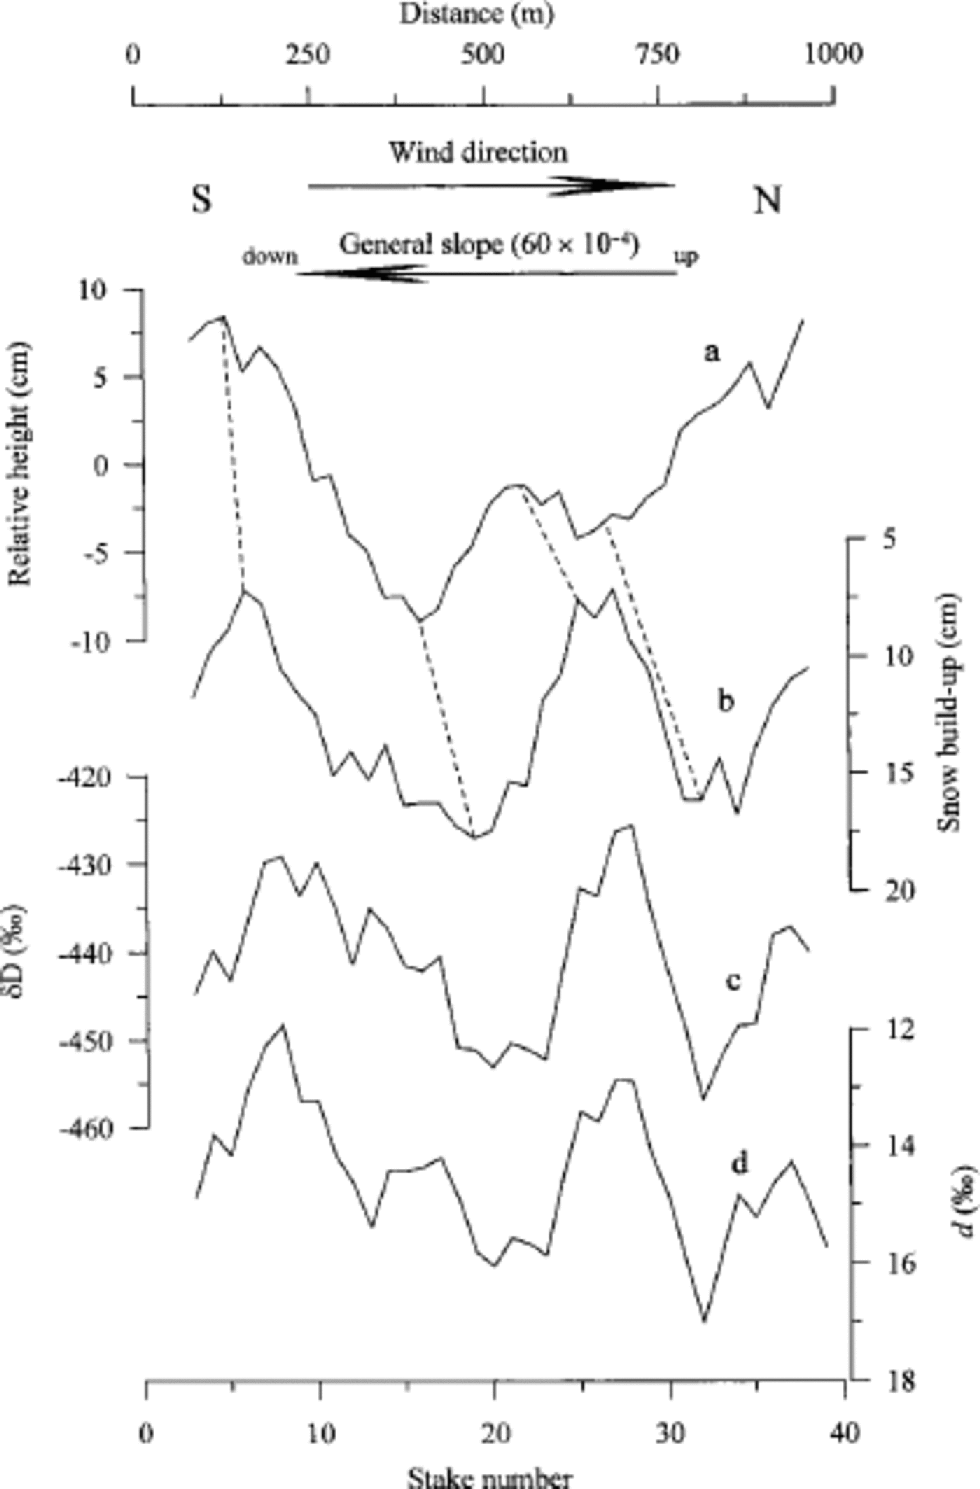
Figure 5c shows the profile of isotope composition of the upper 10 cm of snow. the negative correlation between this profile and that of accumulation (Fig. 5b) is remarkable  The similarity in magnitude of the spatial and seasonal δD variations suggests a spot-like spatial distribution of the winter and summer precipitation, with winter snow predominantly accumulated in the hollows of the relief, and summer snow on the bumps (see Fig. 5a and c). This supposition is supported by the observed strong negative correlation between the profiles of δD and d (see Fig. 5c and d) taking into account that the seasonal cycle of d in central Antarctica is the inverse of that of δD (e.g. Reference Ciais, White, Jouzel and PetitCiais and others, 1995). Such a peculiarity in spatial distribution of seasonal snow can be explained assuming winter snow is more liable to redistribution by wind (because of smaller particles and higher wind speed during winter) than summer snow.
We can expect that, as in the case of the accumulation rate, the spatial variations of δD will also be reflected in the isotope time series. the periods of the δD oscillations revealed during the pit studies are presented in Table 2 (column 6). These periods are essentially the same as those in the accumulation time series (columns 2 and 3), which suggests that the observed oscillations have a similar origin.
The main variations in the vertical δD profiles having a period of about 20–30cm (see Fig. 2) are associated with 100m long surface undulations (wave II in Table 2). to eliminate these relief-related oscillations we smooth the vertical profiles with a length scale of 25 cm (thin curves in Fig. 2). In the smoothed profiles, in turn, one can see relatively long oscillations with an average period of 70 cm which roughly corresponds to 12 years. We assume that this variation has a climatic origin. the longer oscillations cannot be seen in the individual profiles as they have comparatively small amplitudes. However, the stacked pit series (see Fig. 3) reveals δD changes with a period of ~40 years that are likely related to changes in cyclonic activity (Reference EnomotoEnomoto, 1991). the climate-related variations with periods of about 12 and 40 years are also seen in the accumulation series (see Table 2; Fig. 3).
3.3. Short-term δD variations in the deep Vostok core
The results of δD measurements in the Vostok ice cores recovered from depths of 123,183,1819 and 2136 m (the ages of the ice are 5, 8,127 and 150 kyr, respectively) are shown in Figure 6. the profiles are reduced to a common length scale, so that an annual layer in each profile has the same thickness. the smoothed δD profile from pit st61 is shown in Figure 6 for comparison.
Detailed isotope (δD) profiles measured in the Vostok ice cores from 123 m (the age of the ice is about 5 kyr), 183 m (8 kyr), 1819m (127 kyr) and 2136 m (150 kyr) compared with the δD profile from pit st61. the pit profile is smoothed with the period 25 cm. All the profiles were reduced to a common time-scale (see upper axis) by correcting for annual layer thinning, density and accumulation-rate differences.

From Figure 6, the profiles for st61, 123m and 1819m have similar periods of oscillation (about 10–12 years), though the amplitude of δD variations at 1819m is much weaker than in pit st61, probably due to diffusive smoothing. As for the profile from 183m, the wavelength (≥ 57 cm of ice, corresponding to about 25 years) is close to that of wave IV (see Table 2), though the total length of the profile leaves this result uncertain. the average period of δD variations in the core from 2136 mis about 44 years, which is similar to waveV (Table 2). Note that oscillations with periods less than 10– 12 years are not presented in the deep isotope profiles since they are completely erased in the process of firnification (Reference JohnsenJohnsen,1977; Reference Johnsen, Clausen, Cuffey, Hoffmann, Schwander, Creyts and HondohJohnsen and others, 2000).
In summary, the results obtained by the study of snow accumulated at Vostok over the last 50 years provide a basis for understanding the δD variations in ice deposited in the vicinity of the station in the remote past.
Conclusion
Our results suggest that the δD oscillations with periods 2.5, 5 and 20 years in the vertical isotope profiles measured in the vicinity of Vostok station are mainly caused by the movement of snow-accumulation waves of various scales. Similar oscillations have been found in the snow-accumulation time series obtained at single points (Reference Ekaykin and Barkov.Ekaykin and others, 1998).
The time period of smoothing required to sufficiently reduce the noise in a δD time series is about 20 years. We also assume a possible existence of non-climatic, relief-related secular δD oscillations, in which case smoothing periods much greater than 20 years may be required.
The climate-related fraction of the total variance of the isotope profiles is estimated to be about 17% and manifests itself mainly in δD oscillations with periods of 12 and 40– 50 years. Moreover, the isotope composition of snow records the temperature of precipitation events, which is not representative of the mean annual air temperature.
The diffusive smoothing in the upper 3 mof snow at Vostok results mainly in erasure of the high-frequency variations in δD profiles. During the firnification process the δD oscillations with a period of 520 cm of ice (8 years) are completely erased, which is consistent with the fact that the shortest isotope variations found in the detailed δD profiles measured in the deep Vostok ice core have periods of about 10–12 years. In general, the δD oscillations preserved in the deep core have roughly the same periods and likely the same origins as those in the near-surface snow.
Acknowledgements
We wish to thank V.N. Golubev, V. I. Nikolaev, A.N. Salamatin, S. Johnsen and J. Jouze. for valuable discussions. the manuscript was improved by comments from W. Budd and B. Smith. This work is a contribution to Project 6 of Subprogram``Study and research of the Antarctic’’, FTP ``World Ocean’’ of the Russian Federation. the results presented here were obtained in the course of Russian–French collaboration on the Vostok ice core and the International Trans-Antarctic Scientific Expedition. One of the authors (A.E.) was supported by a TEMPRA grant from the French Rhône–Alpes region.



