I. INTRODUCTION
Richard Feynman first discussed the concepts of nanotechnology in 1959 to describe the possibility of synthesis via direct manipulation of atoms. In 1974, Norio Taniguhi was the first scientist who used the term nanotechnology to describe semiconductor processes. Nanotechnology is an important research field through a conceptual framework for nanotechnology. The invention of the scanning tunneling microscope and atomic force microscope mainly contributes to the advancement of nanotechnology applications. The discovery of fullerenes by Harry Kroto, Richard Smalley, and Robert Curl is the second major breakthrough that sparked the growth of nanotechnology in 1985.
Nanotechnology is the engineering of functional systems at the molecular scale and includes advanced current work and concepts. One nanometer (nm) is one billionth, or 10−9, of a meter. The US National Nanotechnology Initiatives defines nanoscale as size range from 1 nm to 100 nm. Nanotechnology uses two main approaches, namely, bottom–up and top–down. Any materials or devices that are built from molecular components, which assemble themselves chemically, are called the bottom–up approach. The top–down approach is indicated by the objects in nano size that are constructed from large materials without controlling the atom level.
Graphene is a single-atom-thick carbon atom layer that comprises six-membered carbon ring. These carbon atoms are tightly packed into a 2D hexagonal honeycomb network. The structure of graphene monolayer is a basic building block for all other carbon allotropes, such as bulky balls, nanotubes, and graphite. Graphene is one of the strongest and finest materials to replace silicon application because of its extraordinary properties. Many studies investigated the properties of graphene synthesized from various carbon sources, such as graphite, graphene oxide, methane, and ethanol. Palm oil is a good and reliable material used to produce high-quality graphene. It has long carbon chain to supply carbon atom during graphene growth and is bio-renewable.
Carbon atoms, which are arrayed in a hexagonal honeycomb lattice, are called 2D graphene sheets. These sheets are quite strong when held together at a distance of approximately 1.4 angstroms between the carbon atoms with sp2 bonds. Bulk graphite comprises at least 10 layers of graphene (in other respects more like 100) that stacked on top of each other. The distance between the stacked layers is approximately 3.4 angstroms.
Andre Geim and Kostya Novoselov discovered graphene in 2004 at the University of Manchester. These two Russian-born researchers won the Nobel Prize in physics for their outstanding work in isolating a single layer of graphite. Industries and governments worldwide have spent huge investment to isolate graphene that is arranged in tightly bound hexagons.
Graphene is the hardest known material. It can rapidly conduct electricity and possesses extremely good electrical conductor. Graphene exhibits higher thermal conductivity than diamond. It is highly optically transparent, and it can stretch up to 20 times its length. Graphene is the most impermeable material that has been discovered. This unique material is not only a crystal but also a molecule, a solid, and a surface.
Scientists all over the world have extensively conducted studies on graphene. Many research papers on this material have been published daily since 2004. The chemical, physical, and electronic properties of graphene are investigated. These unique combination properties of graphene have opened new potential for composite materials, as well as electrical, physical, and electronic applications. Overcoming the physical limitations of the lack of band gap through these properties and producing suitable sheets of graphene for practical restrictions in device integration are discussed. These limitations are overcome by a chemically inert and thermodynamically stable graphene. Therefore, a material can be strengthened by doping it with other atoms or placing it on top to enhance the material properties. The characteristics of graphene for electronic devices are enhanced by introducing a band gap which controls electron transportation. Chemical doping can be controlled by certain set up parameter to obtain the required band gap. Multiple graphene can also be used to achieve the required band gap by layering its lattices. This study shows that graphene has high potential in any industry, particularly in electronic and composite materials, because of its versatile properties. This finding proves that graphene has a commercial value worldwide, and further research should be performed to realize more potential applications.
A Bravais lattice is used to analyze a honeycomb lattice with a two-atom unit cell. The entire lattice is constructed by duplicating and translating this cell by a set of translation vectors at the set amount. The jagged edge cut along the honeycomb lattice results in “zig-zag” and “armchair” directions. Either direction of graphene lattice orientation exhibits fundamental effects on its electronic behavior.
Monolayer graphene as a transferrable material was first found in 2004. This material has attracted research activities among material scientists, physicists, and chemists because of its properties.Reference Novoselov, Geim, Morozov, Jiang, Zhang, Dubonos, Grigorieva and Firsov1–Reference Ruoff4 Considerable research has been conducted on obtaining large sheets of single-layer or double-layer graphene by developing new and various processes. Graphene growth on copper or nickel substrates was investigated using chemical vapor deposition (CVD) of CH4 of C2H2 gases as carbon precursor.Reference Reina, Jia, Ho, Nezich, Son, Bulovic, Dresselhaus and Kong5–Reference Kim, Zhao, Jang, Lee, Kim, Kim, Ahn, Kim, Choi and Hong7 However, the limitations of the CVD method include the use of gaseous raw materials; this method is also difficult to apply to large various feedstocks that can easily be found.
Graphene shows potential in a plethora of applications with its extraordinary electronic and mechanical properties.Reference Kim, Zhao, Jang, Lee, Kim, Kim, Ahn, Kim, Choi and Hong7–Reference Schlapbach and Zuttel13 Graphene can now be obtained by several different methods. The reduction and liquid exfoliation of graphene oxide are one of the methods that are widely used to produce graphene in large quantities that is chemically converted.Reference Hernandez, Nicolosi, Lotya, Blighe, Sun, De, McGovern, Holland, Byrne, Gun'Ko, Boland, Niraj, Duesberg, Krishnamurthy, Goodhue, Hutchison, Scardaci, Ferrari and Coleman14,Reference Stankovich, Dikin, Piner, Kohlhaas, Kleinhammes, Jia, Wu, Nguyen and Ruoff15 Large-sized graphene on wafers is synthesized by the amorphous carbon growth on annealing the SiC by using CVD technology methods.Reference Reina, Jia, Ho, Nezich, Son, Bulovic, Dresselhaus and Kong5–Reference Kim, Zhao, Jang, Lee, Kim, Kim, Ahn, Kim, Choi and Hong7,Reference Berger, Song, Li, Wu, Brown, Naud, Mayou, Li, Hass, Marchenkov, Conrad, First and de Heer16,Reference Zheng, Takei, Hsia, Fang, Zhang, Ferralis, Ko, Chueh, Zhang, Maboudian and Javey17 High-quality graphene with suitable size and thickness is produced to achieve the required specifications of industry using the most common substrates, such as nickel and copper, for CVD graphene growth.Reference Reina, Jia, Ho, Nezich, Son, Bulovic, Dresselhaus and Kong5–Reference Kim, Zhao, Jang, Lee, Kim, Kim, Ahn, Kim, Choi and Hong7
X-ray diffraction (XRD), atomic force microscopy (AFM), UV–vis spectrophotometry, and micro Raman spectrometry are conducted to characterize graphene.Reference Sun, Hasan, Torrisi, Popa, Privitera, Wang, Bonaccorso, Basko and Ferrari50–Reference Ferrari and Basko52 AFM images allow a quantitative estimate of the film thickness and surface morphology. Micro Raman analysis is used to obtain more information on the number of layers and graphene quality, as well as to confirm the graphene layer formation from this powerful tool. The G and G′ bands of the graphene layer are the strong peaks that exhibit the appearance of graphene layers in the sample. The peak of the graphitic carbon species that corresponds to the D band is associated with the amount of effects in the crystalline structure of the graphene layers. The synthesized graphene can confirm its lower or free structural defects by observing the low cross-section of the D band from the micro Raman analysis.
Strong covalent bonds are formed in the graphene layer of sp2 carbon hexagonal networks between two adjacent carbon atoms. Carbon atoms are bonded together with σ bonds and π orbital in two sublattices that contribute to a delocalized electron network. Graphene structure possesses different electronic properties compared with the typical 3D materials. The Fermi surface of graphene is characterized by six double cones.
The Fermi level of inherent graphene is located at the contact points of these six double cones. However, an electric field can influence the Fermi level. The effect of the tuned Fermi level appears, depending on the applied field polarity; graphene can be either n- or p-doped. Water and ammonia are adsorbents that can be used as a dopant onto the graphene surface. The doped graphene has potentially high electrical conductivity compared with copper at room temperature.
The Fermi level is linearly close to the dispersion relation for holes and relations. The zero effective mass corresponds to the energy band curvature that gives the effective masses. The Dirac equation describes the charge carriers in graphene instead of Schrödinger equation. The massless fermions are the charge carriers that act like quasiparticles that travel at a constant speed. The Dirac points are also called the contact points of these six double cones. The Fermi level shifts by gating due to the low density of states, which causes a significant charge density variation that leads to significant transmission changes. Based on the graphene carrier concentration, the photo-induced electron–hole pair recombination and relaxation occur in tens of picoseconds in the graphene structure. Therefore, the graphene field-effect transistor (FET) exhibits an efficient and ultra-fast photo response in high-speed optoelectronic devices for sensing, communications, detection, and other applications because of the graphene high carrier transport velocity under a moderate electrical field.Reference Charlier, Ekluncd, Zhu and Ferrari46,Reference Bonaccorso, Sun, Hasan and Ferrari47
Graphene is a high potential material that surpasses the silicon performance for the semiconductor devices, and it can replace silicon for future semiconductor generation. This high performance is due to the graphene thermal and electrical conductivities, which are outstanding compared with other materials. The charge carriers in graphene can be tuned continuously between electrons and holes, which are called ambipolar electric field effect. Transparency is another graphene intrinsic property that can be used in various applications.Reference Charlier, Ekluncd, Zhu and Ferrari46–Reference Bonaccorso, Lombardo, Hasan, Sun, Colombo and Ferrari48 Several graphene applications exist, such as solar cells, dye-sensitized solar cells, organic photovoltaic cells, and flexible photovoltaic cells.Reference Torrisi, Hasan, Wu, Sun, Lombardo, Kulmala, Hsieh, Jung, Bonaccorso, Paul, Chu and Ferrari49
According to a previous experiment, the starting materials to obtain graphene are graphite oxide,Reference Suriani, Azira, Nik, Md Nor and Rusop24–Reference Williams, Serger and Kamat39 graphite intercalation compound,Reference Valles, Drummond, Saadaoui, Furtado, He, Roubeau, Ortolani, Monthioux and Penicaud41 graphite fluoride,Reference Worsley, Ramesh, Mandal, Niyogi, Itkis and Haddon33 graphite rod,Reference Liu, Luo, Wu, Liu, Zhang and Chen44 expendable graphite,Reference Li, Wang, Zhang, Lee and Dai18,Reference Li, Zhang, Bai, Sun, Wang, Wang and Dai42,Reference Hao, Qian, Zhang and Hou43 and polymethyl methacrylate,Reference Sun, Yan, Yao, Beitler, Zhua and Tour45 among others. In the present experiment, palm oil is used as starting material to produce graphene on silicon substrate.Reference Salifairus, Hamid, Soga, Alrokayan, Khan and Rusop40 This material is selected because of its unique chemical composition with long chain carbon as carbon precursor. Moreover, palm oil is a bio-renewable material and is easily obtained at low cost.
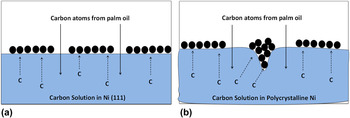
Diverse synthesis methods are performed to grow graphene layers, including CVD,Reference Stankovich, Dikin, Dommett, Kohlhaas, Zimney, Stach, Piner, Nguyen and Ruoff11–Reference Stankovich, Dikin, Piner, Kohlhaas, Kleinhammes, Jia, Wu, Nguyen and Ruoff15 chemical reduction of exfoliated graphene oxide,Reference Berger, Song, Li, Wu, Brown, Naud, Mayou, Li, Hass, Marchenkov, Conrad, First and de Heer16 and thermal decomposition of SiC.Reference Zheng, Takei, Hsia, Fang, Zhang, Ferralis, Ko, Chueh, Zhang, Maboudian and Javey17 Thus, CVD is an attractive method because of the large surface area and high-quality graphene on metal surfaces.Reference Hernandez, Nicolosi, Lotya, Blighe, Sun, De, McGovern, Holland, Byrne, Gun'Ko, Boland, Niraj, Duesberg, Krishnamurthy, Goodhue, Hutchison, Scardaci, Ferrari and Coleman14,Reference Stankovich, Dikin, Piner, Kohlhaas, Kleinhammes, Jia, Wu, Nguyen and Ruoff15 Polycrystalline nickel was explored as substrate to synthesize high-quality graphene and obtain an in-depth understanding on the growth mechanism of graphene layer using palm oil. The different nickel surfaces as catalysts influence the graphene growth. Figure 1 shows the graphene growth mechanism between single crystal Ni (111) surface and polycrystalline Ni surface. In single-crystal Ni (111), graphene is formed in the monolayer. The monolayer and multilayer graphene form on the polycrystalline Ni surface because of the uneven surface.
Growth mechanism of graphene on (a) a single-crystal Ni (111) surface and (b) a polycrystalline Ni surface.

In this study, palm oil is chosen as a starting material that supplies carbon atom during the synthesis process. Many renewable resources, such as camphor oil and corn oil, have already been investigated to deposit graphene on the substrate. This study is the first to focus on the possibility of utilizing palm oil as carbon precursor to graphene production.Reference Tan, Md Jahim, Harun, Wu and Mumtaz23 Previous studies showed that palm oil successfully grows high-quality carbon nanotubes (CNTs). Suriani et al. grew vertically aligned CNTs on silicon substrates using palm oil as a carbon precursor via CVD.Reference Suriani, Azira, Nik, Md Nor and Rusop24 Palm oil as a natural oil source has high potential in large-scale production of CNT as a new renewable and green carbon precursor.Reference Suriani, Azira, Nik, Md Nor and Rusop24–Reference Salifairus, Shamsudin, Maryam and Rusop26 According to the Malaysian Palm Oil Council, 4.49 million ha of land in Malaysia is cultivated with oil palm, producing about 17.73 million tonnes of palm oil supply.27 Sime Darby Plantation reported that oil palm is cultivated in approximately 13.46 million ha of land worldwide, producing 32% of the global production of 17 major oils and fats in 2012.28 Thus, palm oil supply is sustained because of the high production of palm oil around the world.
Palm oil is enriched with a long chain carbon atom. This property is an important factor in supplying carbon atom during the synthesis of graphene. The number of carbon atom in palm oil cannot be controlled during the synthesis; however, the volume of the palm oil can be determined. Therefore, this study mainly aims to synthesize graphene from natural palm oil via CVD method and investigate the structural characteristic of the synthesized graphene.
II. EXPERIMENTAL
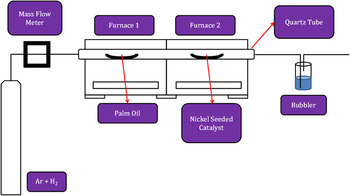
Graphene was deposited on the nickel sheet with a dimension of 0.10 mm × 10 mm × 10 mm via thermal CVD (TCVD) method (Fig. 2). The natural carbon source was obtained from a commercial palm oil as a carbon precursor. The palm oil and nickel sheet were placed in the middle of the two different furnaces in a TCVD system. Argon and hydrogen were allowed to flow for 10 min to flush out any gas impurities inside the quartz tube and provide an inert atmosphere for the deposition. The substrate furnace was heated from 800 °C to 1100 °C with a 50 °C interval. When the substrate furnace reached a stable temperature, the carbon precursor furnace was heated up to 300 °C. Both furnaces were switched off immediately after several minutes of synthesis time and were rapidly cooled to room temperature. The synthesized graphene was characterized using Raman spectrometry (HORIBA Scientific, Longjumeau, France), AFM (Park Systems Corporations, Suwon, Korea), UV–vis spectrophotometry (Agilent Technologies, Santa Clara, California), XRD (PANalytical, Almelo, The Netherlands), and field emission scanning electron microscopy (FESEM; JEOL Ltd., Tokyo, Japan).
Schematic of TCVD.

III. RESULTS AND DISCUSSION
Raman spectroscopy is a versatile tool for measuring lattice vibration signal of graphene–graphitic layers. It is also extremely sensitive in determining the degree of structural defects. Only two active phonon modes exist at the center of the first Brilliouin zone with E2g symmetry in the first-order Raman scattering. The first mode corresponds to successive layers that refer to the antiphase translational motions, which are perpendicular to their normal layerReference Stankovich, Dikin, Piner, Kohlhaas, Kleinhammes, Jia, Wu, Nguyen and Ruoff15 and located at about 43 cm−1. The first phonon mode is difficult to observe in the spectra because of its proximity with the Rayleigh line. However, this mode does not exist in a single-layer graphene.
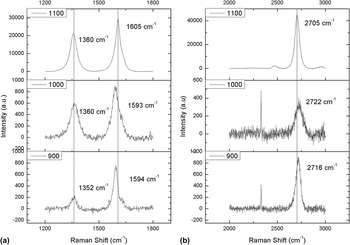
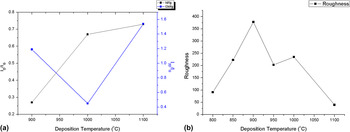
The second mode is the most common feature of all carbon graphitic materials, such as graphene and CNTs. It is commonly known as G band and located at approximately 1580–1650 cm−1 (Fig. 3). This band corresponds to the carbon atoms in the layer planes with the zone center vibration between atoms.Reference Stankovich, Dikin, Piner, Kohlhaas, Kleinhammes, Jia, Wu, Nguyen and Ruoff15 The occurrences of D (around 1360 cm−1) and G (around 1590 cm−1) bands are associated to the presence of the graphene–graphitic lattice defects. The overtone 2D band (around 2700 cm−1) is attributed to the D band and is assigned as second-order Raman scattering. The information on the number of graphene layers and the stacking order of graphene system are shown by the shape and intensity analysis of the overtone 2D band.Reference Berger, Song, Li, Wu, Brown, Naud, Mayou, Li, Hass, Marchenkov, Conrad, First and de Heer16–Reference Li, Wang, Zhang, Lee and Dai18 The summary of the Raman peaks and the ratio of the Raman peaks that indicate the crystallinity of carbon atom in graphene and the number of graphene layers are shown in Table I. The I D/I G ratio indicated the degree of the graphene–graphitic lattice defects with the lowest value defined as good crystallization (Fig. 4). The 2D/G intensity ratio (I 2D/I G) of these bands for high-quality single-layer graphene is greater than or equal to 2, and the 2D/G intensity ratio in this study is less than 2, which indicates that the deposited graphene is multilayer. Kaniyoor et al. reported that the I 2D/I G ratio of deposited graphene from graphite is less than 0.5, and in this study, the I 2D/I G ratio is more than 1 at certain deposition temperature.Reference Kaniyoor and Ramaprabhu29 As the deposition temperature increased, the D band shifted to the right. However, the G and 2D bands exhibited different shifting behavior between 1000 °C and 1100 °C compared with 900 °C. The Raman peak at 900 °C produced high-quality graphene compared with other two deposition temperatures. This result is due to the nucleation that mainly occurred on the step edge, whereas the nucleation at the terrace became significant at a relatively high temperature and on a flat surface, which is caused by the low barrier energy.Reference Gao, Yip, Zhao, Yakobson and Ding30
Raman spectra of graphene layers at different deposition temperatures. (a) D and G bands. (b) 2D band.

Peaks from Raman spectra and the ratio of the peaks at different deposition temperatures.

(a) I D/I G and I 2D/I G ratios and (b) surface roughness of graphene layers.

The width of the G band increased as the deposition increased. The lowest value of G band width was 28.7 cm−1 at 900 °C. However, the G band width was not influenced by the number of graphene layers. The single and sharp 2D bands gave the full width at half maximum (FWHM) value less than 30 cm−1 that can be fitted to a single Lorentzian. The 2D band FWHM became broad for the bilayer and trilayer graphene. The FWHM (2D band) of bilayer graphene had a value at about 50 cm−1. In this study, the 2D band FWHM was more than 50 cm−1 and proved that the deposited graphene on the polycrystalline nickel is multilayer.
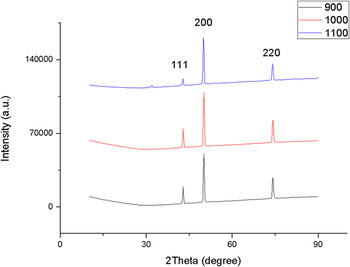
The XRD patterns for graphene on nickel substrates are presented in Fig. 5. The XRD patterns show peaks that correspond to (111), (200), and (220) crystallographic planes of nickel. The (200) peak is still the highest peak because of the non-uniform graphene layers on the nickel substrate. The carbon peaks of the graphene could not be resolved in XRD patterns because of the low graphene content on the nickel substrate. The intensity of the Ni (111) diffraction peaks decreased, and the peak width was broadened when the graphene layers were increased. This result is ascribed to the decrease in the grain size of the nickel substrate. The XRD patterns were proven by the FESEM images that show the uniform deposits in the graphene surface morphology. The FWHM value of the XRD (200) peak was 0.38°. The increase in FWHM values indicated the decrease in graphene grain size. The grain sizes can be calculated with Scherrer's equation.
 $$\tau = {{K\lambda } \mathord{\left/ {\vphantom {{K\lambda } {\beta {\rm{cos\ }}\theta }}} \right. \kern-\nulldelimiterspace} {\beta \,\,{\rm{cos\ }}\theta }}\quad ,$$
where τ (the mean size of the ordered (crystalline) domains), K (a dimensionless shape factor, 0.9), λ (the x-ray wave length), β [the line broadening at half the maximum intensity (FWHM)], and θ (the Bragg angle) are obtained using the data from the XRD patterns.
XRD patterns of graphene layers and nickel at different temperatures.

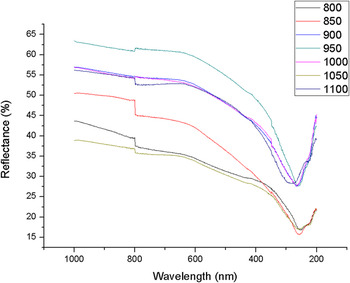
A minimum reflectance is evidently observable in the UV range of the spectrum for all graphene samples. The consistent spectroscopic feature observed in the UV range is known to emerge from the peak on the states joint density for a graphene layer. This occurs at the M point of the Brillouin zone at E = 2γ0 and is typically known as the π plasmon resonance.Reference Panchakarla, Subrahmanyam, Saha, Govindaraj, Krishnamurthy, Waghmare and Rao19 The UV–vis spectra for graphene on nickel substrates are shown in Fig. 6. The percentage of reflectance at different deposition temperatures is less than 30% between 266 and 285 nm. Furthermore, the spectra patterns show an increment of reflectance percentage due to the increase in deposition temperature.
UV–vis spectra of graphene layers at different temperatures.

The absorbance (A) can be determined from reflectance by using the below equation.Reference Wang, Li, Zhang, Yoon, Weber, Wang, Guo and Dai20,Reference Wei, Liu, Wang, Zhang, Huang and Yu21
 $$A = \log \left( {{1 \mathord{\left/ {\vphantom {1 R}} \right. \kern-\nulldelimiterspace} R}} \right)\quad .$$
The absorbance is proportional to the concentration of sample's substance according to Beer–Lambert's law. The foundation of the law in the classical absorption spectrophotometry states a homogenous and nonscattering liquid sample. However, in this experiment, graphene sample was used in characterization using diffuse reflectance spectroscopy. The graphene sample did not fulfill the requirement of the classical absorption spectrophotometry because it is a nonhomogenous and scattering sample.Reference Ci, Song, Jin, Jariwala, Wu, Li, Srivastava, Wang, Storr, Balicas, Liu and Ajayan22 Therefore, in this study, the relation between spectral data and the increased deposition temperature can be determined by analyzing the reflectance.
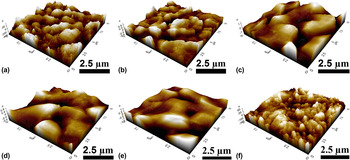
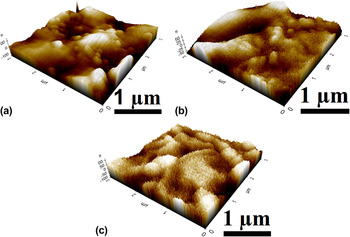
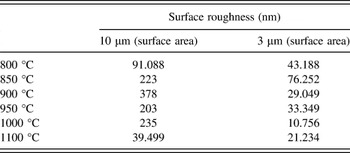
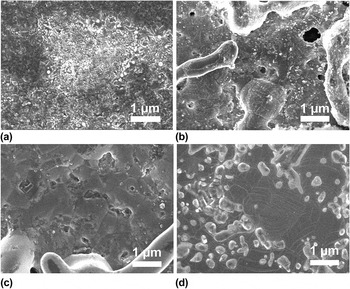
The AFM images show that the surface roughness decreased from 800 °C to 1100 °C in the range of 378–39 nm (Figs. 7 and 8). The Raman spectra show the multilayer graphene growth at 900 °C and 1100 °C. The surface roughness is related to the layer of graphene growth on the substrate. However, based on the I D/I G ratio, the graphene layer growth at 900 °C was of high quality compared with that at 1100 °C. The surface roughness analysis shows that roughness decreases with small surface area (Table II). This roughness values exhibit a non-uniform graphene sheet; however, when the surface is smaller, the roughness decreases tremendously up to 95%. The FESEM images proved that the surface morphology is rough at 900 °C compared with those at other temperatures.
AFM images of graphene layers at different temperatures in 10 µm surface area: (a) 800 °C, (b) 850 °C, (c) 900 °C, (d) 950 °C, (e) 1000 °C, and (f) 1100 °C.

AFM images of graphene layers at different temperatures in 3 µm surface area at (a) 900 °C, (b) 1000 °C, and (c) 1100 °C.

Surface roughness of graphene at different deposition temperatures and surface areas.

The FESEM images in Fig. 9 show the surface morphology of the graphene layers at different deposition temperatures. The transformation from lower to higher temperature was investigated using the Raman spectra and proven by the FESEM images. At 900 °C, the graphene was observed at the edge of the nickel substrate and was not uniformly deposited. The carbon atoms that diffused to the edge of the vertical graphene bound well because of the strong in-plane C–C covalent bond and grew normally on the substrate. However, the carbon species that arrived in the planer region were re-evaporated because of the weak van der Waals force between the graphene layers.
FESEM images of graphene at different temperatures at (a) 800 °C, (b) 900 °C, (c) 1000 °C, and (d) 1100 °C.

IV. CONCLUSION
In conclusion, this study successfully demonstrated the graphene synthesis from palm oil via CVD. Raman spectroscopy is a versatile tool for measuring signal of lattice vibration of graphene–graphitic layers. This tool is also extremely sensitive in determining the degree of structural defects. The D and G bands appeared at about 1352 and 1594 cm−1, respectively. The overtone 2D band appeared at approximately 2716 cm−1. Raman spectra at 900 °C gave a high-quality graphene based on the I D/I G and I 2D/I G ratios, which were 0.27 and 1.19, respectively. The XRD patterns can be determined by the three peaks of nickel at (111), (200), and (220) orientations. The FWHM value of the (200) peak was 0.38°. The percentage of reflectance was increased by increasing the deposition temperature; 900 °C showed the best percentage value at about 27%. The AFM and FESEM images proved that the surface topography and morphology are rough and flat, which enhanced the graphene growth. The synthesized graphene at 900 °C showed excellent characteristics compared with other deposition temperatures.
ACKNOWLEDGMENTS
The authors would like to thank Mrs. Nurul Wahida binti Aziz and Mr. Mohd Azlan bin Jaafar, NANO-SciTech Centre for their help and support during the research work. This study was financially supported by LRGS grant (600-RMI/LRGS 5/3 (3/2013)), Institute of Research Management & Innovation, Universiti Teknologi MARA, Yayasan Sultan Iskandar Johor, Research Chair for Biomedical Applications of Nanomaterials, King Saud University, and Ministry of Education Malaysia. This paper is originally presented and accepted at MITC 2015.