INTRODUCTION
Carbonaceous aerosols in the atmosphere have a negative effect on climate change and human health (Aiken et al. Reference Aiken, De Foy, Wiedinmyer, Decarlo, Ulbrich, Wehrli and Jimenez2010). Their sources and distribution patterns are not fully known or understood yet. Carbonaceous atmospheric aerosols affect the radiative budget. Direct radiative forcing of black carbon is caused by scattering and absorbing sunlight, and it affects indirectly the properties of liquid and ice clouds through diverse and complex processes (Szidat Reference Szidat2009). In addition, the carbonaceous aerosols cause health problems, mainly respiratory and cardiovascular diseases (Knaapen et al. Reference Knaapen, Borm, Albrecht and Schins2004).
Carbonaceous aerosols contain organic carbon (OC) and elemental carbon (EC). OC comprises weakly refractory polycyclic hydrocarbons or polyacids. EC, an aggregate of small spheres, is highly polymerized, refractory, and insoluble in water and common organic solvents (Bond et al. Reference Bond, Doherty, Fahey, Forster, Berntsen, DeAngelo and Zender2013). EC has a warming potential 460 times higher than of CO2, and causes a negative radiative force (IECEI-ZMVM 2012). EC and OC are derived mainly from biogenic sources and biomass and fossil fuel burning (Zhang et al. Reference Zhang, Zotter, Perron, Prévôt, Wacker and Szidat2013), followed by other sources (food cooking, incinerators, etc.). They can be divided into two subfractions: fossil and biogenic (contemporary carbon) carbon. All fossil carbon comes from anthropogenic activities.
Radiocarbon is an ideal tracer for determining the contribution of carbonaceous aerosols sources, as it distinguishes the contemporary carbon from fossil carbon (Marley et al. Reference Marley, Gaffney, Tackett, Sturchio, Heraty, Martinez and Steelman2009; Szidat et al. Reference Szidat, Jenk, Ga, Synal, Fisseha, Baltensperger and Hajdas2004). This is due to the fact that all living matter has an abundance of 14C, as a result of equilibrium reactions with atmospheric CO2. In dead matter, the consumption of CO2 stops and 14C begins to decrease exponentially, with a half-life of 5730±40 yr. Consequently, fossil fuels, with ages of millions of years, do not contain 14C. There are two global anthropogenic effects that have affected the abundance of atmospheric 14CO2 (Levin et al. Reference Levin, Munnich and Weiss1980, Reference Levin, Hammer, Kromer and Meinhardt2008). The first one is the dilution by the increment of CO2 release from fossil fuel burning since the beginning of the Industrial Revolution. The second is the significant release of 14C into the atmosphere by nuclear bomb tests during the decade of the 1950s (Levin et al. Reference Levin, Naegler, Kromer, Diehl, Francey, Gomez-Pelaez, Steele, Wagenbach, Weller and Worthy2010).
Atmospheric aerosols are a global environmental problem. Since they are easily transported, they can be emitted in a specific place and affect a different place. In addition, they react together, creating even more toxic, corrosive, and recalcitrant compounds. The application of the analysis of 14C in atmospheric aerosols to identify some of the sources of carbonaceous particulate material has been increasing worldwide. In the Mexico City Metropolitan Area (MCMA), two major campaigns were undertaken: MCMA 2003 (Molina et al. Reference Molina, Kolb, de Foy, Lamb, Brune, Jimenez, Ramos-Villegas, Sarmiento, Paramo-Figueroa, Cardenas, Gutierrez-Avedoy and Molina2007) and MILAGRO 2006 (Molina et al. Reference Molina, Madronich, Gaffney, Apel, de Foy, Fast, Ferrare, Herndon, Jimenez, Lamb, Osornio-Vargas, Russell, Schauer, Stevens, Volkamer and Zavala2010). On the Molina Center web site (Molina Center 2016), there is a description and references of each campaign where 14C analysis is applied to atmospheric aerosols. This area, with more than 22 million inhabitants, in a basin of 3540 km2, making it the largest metropolitan region in North America. Environmental pollution, which is a risk to the health of the inhabitants (Aldape et al. Reference Aldape, Flores, Flores and Retama2005; Chow et al. Reference Chow, Watson, Edgerton and Vega2002), requires the identification of emission sources of carbonaceous atmospheric aerosols. This information will help to implement appropriate actions to control anthropogenic fraction (Gasca et al. Reference Gasca, Ortiz, Castillo, Jaimes and González2004; Martínez-Carrillo et al. Reference Martínez-Carrillo, Solís, Isaac-Olive, Andrade, Beltrán-Hernández, Martínez-Reséndiz and Lucho-Constantino2010; Ortiz et al. Reference Ortiz, Solís, Vivier-Bunge, Martínez Carrillo, Iuga, Lucho Constantino and Beltrán-Hernández2011; Seinfeld and Pandis Reference Seinfeld and Pandis2012).
The results of the campaigns MCMA 2003 and MILAGRO 2006 indicated that approximately 70% of the carbonaceous material aerosols in Mexico City came from biogenic material derived from biomass burning or biogenic secondary aerosol precursors. This fraction of modern carbon exceeds the air quality model estimations and can be adjusted only by considering the contribution of regional wildfire values (Hodzic et al. Reference Hodzic, Jimenez, Prevot, Szidat, Fast and Madronich2010). The presence of high levels of particulate material (PM) in the air of Mexico City and its effects on health and the environment have turned out to be major issues in environmental politics. The purpose of this work is to apply 14C analysis with accelerator mass spectrometry (AMS) to aerosols studies. Total carbon (TC), EC, and OC as well as 14C in PM10 specifically were quantified to determine the relative contribution from fossil fuels burning (fossil carbon, FC) and biogenic sources (biogenic carbon, BC) to carbonaceous aerosols. PM10 sampling campaign was carried out in the cold-dry season (November–December), when the occurrence of forest fires is low. Sampling was conducted at three sites in Mexico City and a semi-urban area near a forest in the city of Cuernavaca, 80 km south of México City. Cuernavaca was chosen to serve as a less polluted reference site. A reconstruction of material balance for each site was performed from elemental, ionic, and carbonaceous composition. These data allow one to understand the spatial variations of the components. This information thereby allows one to establish the origin of carbonaceous aerosols.
METHODOLOGY
Study Area
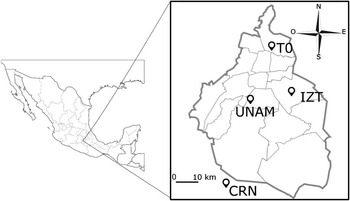
Sampling was conducted at four sites as shown in Figure 1. Three of the sites are located in Mexico City: the Mexican Institute of Petroleum (T0 during MILAGRO campaign) is predominantly industrial; Iztapalapa (IZT), with a high population density and big affluence of public transport; and Ciudad Universitaria (UNAM) with a low population density. The fourth site is in Cuernavaca (CRN), chosen as a control since it is located in a forest and less urbanized area.
Location of the four monitoring stations

Sampling and Analysis
In 2013, the Institute of Physics of the National Autonomous University of Mexico established the first AMS laboratory in Mexico (LEMA by its acronym in Spanish), based on a 1MV HVEE Tandetron Accelerator, which is used for dating archaeological objects and other radioisotope studies applied to medicine, astronomy, geophysics, biology, and now for environmental studies (Solís et al. Reference Solís, Chávez-Lomelí, Ortiz, Huerta, Andrade and Barrios2014; Gómez et al. Reference Gómez, Solís, Chávez, Andrade, Ortiz, Huerta, Aragón, Rodríguez-Ceja, Martínez and Ortiz2016).
Atmospheric aerosols were collected on quartz filters (Pallflex 2500 of 20×25 cm, QAT-UP; Pall Sciences, Ann Arbor, MI, USA) using a high-volume sampler of PM10 with 1.9 m3/min flow (Graseby Andersen SA-2000H). The sampling period for each sample was 48 hr in the cold-dry season of 2012 (from 19 November to 6 December). The filters were wrapped in aluminum foil and stored at 4°C. The PM10 total mass collected on a filter ranged from 99.7 to 560 mg. Four different portions were cut from filters. One was analyzed for the carbonaceous component (TC, OC, and EC), a second one for 14C, and the other two portions were taken for elemental and ionic composition analyses. A carbon analyzer (UIC model CM5014) was used to obtain TC, OC, and EC. The combustion is performed at a constant temperature (500°C for OC and 700°C for TC) in the presence of barium chromate catalyst/scrubber to ensure that all carbon compounds are converted to CO2. The CO2 is measured by a coulometric titration.
For 14C analysis, filters were cut and encapsulated in a tin crucible. Sample combustion and graphitization was carried out in automated graphitization equipment AGEIII (Ion Plus) as previously described (Solís et al. Reference Solís, Chávez, Ortiz, Andrade, Ortíz, Szidat and Wacker2015). The graphite obtained was pressed into an aluminum cathode and measured directly by AMS. Reference material NIST SRM 4990C oxalic acid (OXAII) of similar sample size was used for normalization. Blanks with no 14C [phthalic acid (C8H6O4)] were also measured to correct for background. AMS 14C measurement precision was around 0.5% for 0.25-mg samples (Solís et al. Reference Solís, Chávez-Lomelí, Ortiz, Huerta, Andrade and Barrios2014). The 14C results are expressed as pMC, the 14C/12C ratio (in %) of the sample related to the isotopic ratio of standard OXAII in the year 1950, following the conventions of Stuiver and Polach (Reference Stuiver and Polach1977). Phthalic acid (LEMA 250) is used as blank for 14C in routine analysis at LEMA since its carbon content from obtained graphite gives a pMC value close to 0.25±0.01 (~50,000 yr old). We could not detect any carbon in three prebaked blank filters combusted to measure TC, at our detection limit of 10 ppm.
Elemental, ionic, and carbonaceous composition were determined in order to perform a reconstruction of material balance. This allowed us to understand the spatial variations of the components. The elemental composition was analyzed using X-ray fluorescence (XRF). The X-ray detector was an Amptek (Bedford, MA, USA) XR-100CR Si-PIN detector (180-eV resolution at 5.9 keV). Spectra were collected with an ORTEC (Oak Ridge, TN, USA) ADC and the Maestro® software, while the spectra analyses were performed with the QXAS computer code (Espinosa et al. Reference Espinosa, Reyes-Herrera, Miranda, Mercado, Veytia, Cuautle and Cruz2012). The quantified elements were Al, P, S, K, Ca, Ti, V, Cr, Mn, Fe, Cu, and Zn. For analysis of ion components, a high-resolution ion chromatograph (Perkin-Elmer, model isocratic LC Puma 250) was used. The following ions were quantified: NO3 –, NO2 –, F–, Cl–, PO4 3–, SO4 2–, Li+, Na+, NH4 +, K+, Mg2+ and Ca2+. A Hamilton PRP-X100 column was used for nitrate and sulfate analysis. The injection volume was 100 μL. The mobile phase was phthalic acid 2 mmolar in 10% acetone and a 2 mL min–1 flow rate. For ammonium and potassium ions, the injection volume was 50 μL. The analytical conditions were as follows: Hamilton PRP-X200 analytical column; Alltech 335SPCS suppressor module; Alltech cation suppressor cartridge. The mobile phase was a solution of nitric acid, 4 mmolar in 7:3 water: methanol and 2 mL min–1 of flow rate.
RESULTS AND DISCUSSION
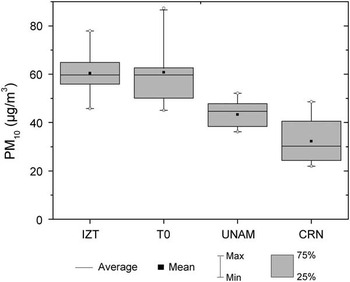
In Figure 2, a box-and-whisker plot (n=7 for each site) shows the concentration of PM10, collected at three sites in Mexico City and one in the city of Cuernavaca during part of the dry-cold season. The highest concentrations values were observed in IZT and T0. The IZT area was characterized by strong winds during the campaign, compared to other sites, which explains a high dispersion of PM10 values. Winds were from the NNW, N, and NNE, reaching speeds of up to 8.8 m/s on 19 November. Although the highest concentrations of PM10 were in IZT, these values did not exceed the Mexican Legislation NOM-025-SSA1-1993 that ruled in 2012 that established a maximum allowable limit for PM10 of 0.12 mg/m3 in 24 hr. The cleanest site was CRN; therefore, it was considered as a reference site for comparison. The average PM10 and medians (in μg/m3) were 43.3 and 44.6 for UNAM, 59.4 and 59.3 for IZT, 60.8 and 59.7 for T0, and 32.2 and 30.2 for CRN, respectively. As shown in the figure, the averages and medians are similar, indicating a normal distribution.
Box-and-whisker diagram of the concentration of PM10 in the four sites sampled.

Chemical Composition of PM10
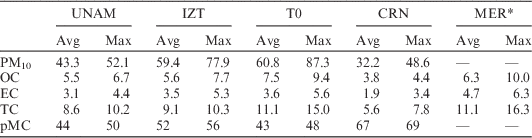
Table 1 lists the average and maximum values of the concentrations of PM10, OC, EC, TC, and pMC for the studied sites. IZT and T0 showed the maximum concentrations of particle PM10 during the sampling period. The average and maximal concentrations of PM10 at UNAM were 43.3 and 52.1 μg/m3, respectively; for CRN, the average and maximal concentration were 32.2 and 48.6 μg/m3, respectively. The highest average value for pMC was observed in CRN (67%) and the lowest in T0 (43%). For every location in Mexico City, TC, OC, and EC average values were higher than those of CRN. Values obtained in this work for Mexico City locations are similar to those previously reported for La Merced site (MER) (a commercial zone in downtown of Mexico City) (Chow et al. Reference Chow, Watson, Edgerton and Vega2002; Querol et al. Reference Querol, Pey and Minguill2008; Vega et al. Reference Vega, Ruiz, Escalona, Cervantes, Lopez-Veneroni, Gonzalez-Avalos and Sanchez-Reyna2011; Retama et al. Reference Retama, Baumgardner, Raga, McMeeking and Walker2015).
Average and maximum concentrations of PM10, OC, EC, TC (μg/m3), and pMC (%) in 48 hr, in the four study sites. Data from Merced (MER) (PM2.5) are included for comparison.

* CENICA campaign 2012 (private communication by S Blanco Jimenez of the National Institute of Ecology and Climate Change).
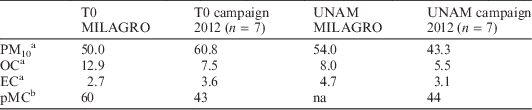
In Table 2, results of this work for PM10 are compared with those of the MILAGRO campaign, only for T0 and UNAM (Querol et al. Reference Querol, Pey and Minguill2008). Since only average values from MILAGRO campaign are reported, it is not possible to conduct a rigorous comparison. In addition, differences are expected since samples were taken in different seasons of the year and carbonaceous material has different origins. Indeed, in March, when the MILAGRO campaign was carried out, a greater contribution of carbon derived from agricultural and forest fires with high pMC values are expected (Aiken et al. Reference Aiken, Cubison, Huffman, DeCarlo, Ulbrich, Docherty, Sueper and Jimenez2007). In contrast, lower pMC values are expected in November–December (this study), where a higher amount of carbon from fossil fuels is emitted (Retama et al. Reference Retama, Baumgardner, Raga, McMeeking and Walker2015). Historical monthly variations also indicate greater concentration of PM10 in March relative to November–December (CACDMX 2014).
Comparison of data obtained in this campaign with the campaign MILAGRO at T0 and UNAM sites (average concentrations in μg/m3).

aQuerol et al. Reference Querol, Pey and Minguill2008; bMarley et al. Reference Marley, Gaffney, Tackett, Sturchio, Heraty, Martinez and Steelman2009.
In our case, the following observations can be drawn: the PM10 concentration increased for T0 and decreased slightly for UNAM from 2006 to 2012, resulting in a compensated value. Higher OC mean values were observed in 2006 relative to 2012 at UNAM and T0. The mean value of pMC (measured only in T0) was higher in 2006 than in 2012. This result can be explained by the enlarged population and higher emissions from vehicular fleet and construction materials in 2012 relative to 2006 (IECEI-ZMVM 2012).
Material Balance
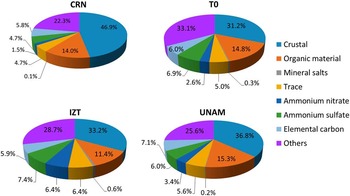
In order to understand spatial differences of chemical components between sites during the sampling period, the chemical composition was reconstructed from the measured components. PM10 was classified in the following components: crustal, organic material, mineral salts, trace elements, ammonium nitrates, ammonium sulfates, elemental carbon, and others. In order to account for hydrogen and oxygen, the average organic carbon concentrations were multiplied by 1.2 to obtain organic material (OC with associated oxygen, hydrogen, nitrogen, and sulfur), ammonium nitrate was obtained as 1.29×NO3 –, ammonium sulfate as 1.375×SO4 2–, and for crustal material was considered the following equation (Chow et al. Reference Chow, Watson, Edgerton and Vega2002): 1.89×Al+2.14×Si+1.4×Ca+1.43×Fe. It should be noted that, because the filters used for the sampling were quartz, it was not possible to determine the silicon in the PM, so it was fixed taking into account the Si/Al ratios for PM10 from six sites in Mexico City described in Chow et al. (Reference Chow, Watson, Edgerton and Vega2002). The average Si/Al ratio was 2.87±0.32, n=6. Then, assuming a Si value equal to 2.87×Al, the equation is rewritten as 8.03×Al+1.4×Ca+1.43×Fe. Trace elements include elements of the periodic table excluding Al, Ca, Fe, Cl, Si, and S. The mineral salts were estimated as 1.65×Cl. Others are determined as the difference between the measured mass and the sum of the material balance.
The reconstructed mass is summarized in Figure 3. The seven components accounted for 67% to 74% of the PM10 mass in Mexico City sites and 78% in CRN. Crustal material accounted for 31.2% to 36.8% in the three sites of Mexico City, while maximal values were observed in CRN as 46.9%, indicating a higher soil dust resuspension. The contribution of organic material to PM10 varied between 11.4% and 15.3% in Mexico City sites. A similar contribution was observed in CRN (14%). Sources of these components may be the industrial and vehicular fleet, but in CRN this relatively high proportion may also come from biogenic sources. EC accounted for 5.9% to 7.1% at Mexico City sites and 5.8% at CRN. EC is an indicator of the emissions from vehicular fleet and mobile sources. The main emission sources of this type of carbon in aerosols are trucks with 49%, followed by freight vehicles above 3.8 ton with 14%, buses 8%, machinery 5%, cars 3%, and cabs 1% (IECEI-ZMVM 2012; ProAire 2011–2020). In CRN, the vehicular fleet is much less than in Mexico City; therefore, other additional sources such as sugarcane burning must be taken into account. The highest level of ammonium nitrate was observed in IZT (6.4%), while high levels of ammonium sulfate were observed in the three sites of Mexico City (6–7.4%). Their precursors are secondary compounds formed by high amounts of nitrates and sulfates in the atmosphere. The source of both compounds is again the combustion of fossil fuel through the emission of SO2, NO2, and NH3 (Chow et al. Reference Chow, Watson, Edgerton and Vega2002). Trace elements and mineral salts were higher in Mexico City sites relative to CRN, indicating higher levels of industrial activities in Mexico City.
Balance of material pie charts at four study sites

Variation of PM10, EC, and OC Contents
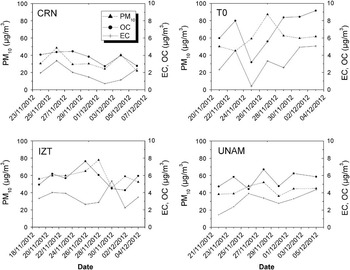
The temporal variations of the content of PM10 and elemental and organic carbon for the studied sites are displayed in Figure 4. In general, OC and EC followed the same trend as PM10 in each site, with OC in general higher than EC. PM10, OC, and EC values showed little variation in CRN and UNAM sites while IZT had a higher dispersion. In T0, higher PM10, OC, and EC values were observed as the cold-dry season progressed. The higher values at the end of the sampling campaign observed may be the result of a reduced vertical and horizontal air exchange or temperature inversions not evident in the other sites (Edgerton et al. Reference Edgerton, Bian, Doran, Fast, Hubbe, Malone, Shaw, Whiteman, Zhong, Arriaga, Ortiz, Ruiz, Sosa, Vega, Limon, Guzman, Archuleta, Bossert, Elliot, Lee, McNair, Chow, Watson, Coulter, Doskey, Gaffney, Marley, Neff and Petty1999; Salcido et al. Reference Salcido, Sozzi and Castro2003; Yokelson et al. Reference Yokelson, Urbanski, Atlas, Toohey and Alvarado2007; Klingner and Sähn Reference Klingner and Sähn2008).
Temporal variations of PM10, EC and OC contents for the four sites sampled

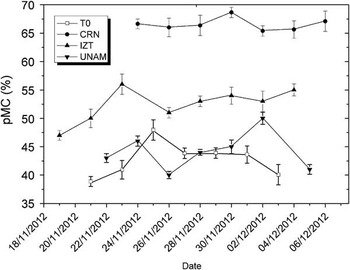
Temporal variations of pMC for the four sites sampled are shown in Figure 5. Overall, this figure shows pMC temporal variation at all sites during the sampling period. The highest pMC values were obtained for CRN, as expected for a control unpolluted area. It varied from 65% to 69% with an average of 67%. In IZT, pMC varied from 47% to 56% with an average of 52%. IZT showed a greater contribution of biogenic sources compared with the other two sites of Mexico City. We note that IZT has numerous informal settlements with high population density and limited economic resources. In this zone, inhabitants often use firewood for food processing, which would explain the significant increased contribution of biogenic carbon sources. The lowest values obtained were for T0 and UNAM, which also showed similar ranges of variation (from 39% to 48% with an average of 43% at T0, and from 40% to 50% with an average of 44% at UNAM). Lower pMC values were expected in T0 relative to UNAM, since T0 is more industrialized, with many heavy fuel trucks, while UNAM is a residential area with less industrial emissions, and less TC, OC, and EC contents (Table 1). The similar levels of these two sites may be explained by the fact that both T0 and UNAM are located in the path of the northwest and northeast winds, which carry pollutants from the industrial area of the city where they are emitted.
Percentage of modern carbon (pMC) for the four sites sampled. Uncertainties varied from 1.2% to 4.5%.

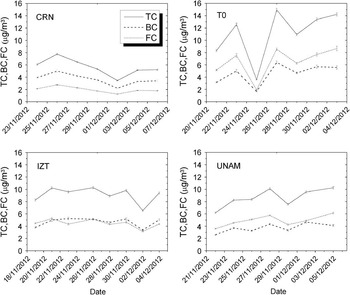
Figure 6 shows the TC and the carbon emitted by biogenic sources (BC) and fossil fuels (FC) present in aerosols collected at the four sites. These concentrations were calculated from the fraction of modern carbon, fM (pMC/100) and total carbon (μg/m3), using Equations 1 and 2, proposed by Takahashi et al. (Reference Takahashi, Hirabayashi, Tanabe, Shibata, Nishikawa and Sakamoto2007)
 $${\rm Biogenic}\,{\rm carbon}\left( {{\rm BC}} \right)\,{\equals}\,\left( {{{{\rm pMC}} \mathord{\left/ {\vphantom {{{\rm pMC}} {100}}} \right. \kern-\nulldelimiterspace} {100}}{\times}{\rm TC}} \right){\times}f$$
 $${\rm Fossil}\,{\rm fuel}\,{\rm carbon}\left( {{\rm FC}} \right)\,{\equals}\,{\rm TC}-{\rm BC}$$
where ƒ is a correction factor defined as 100/pMC*. The value of pMC* was calculated assuming that (1) the BC fraction originates from surface soil organic matter and aboveground biomass and (2) the 14C signal could be as old as 20 yr as observed in high latitudes (Mouteva et al. Reference Mouteva, Czimczik, Fahrni, Wiggins, Rogers, Veraverbeke, Xu, Santos, Henderson, Miller and Randerson2015). Reported 14C concentrations in tree rings from Chapultepec Park, Mexico City, by Beramendi-Orosco et al. (Reference Beramendi-Orosco, Gonzalez-Hernandez, Martinez-Jurado, Martinez-Reyes, Garcia-Samano, Villanueva-Diaz, Santos-Arevalo, Gomez-Martinez and Amador-Muñoz2015) were fitted to an exponential curve. The best fit for fM values was obtained using Equation 3
 $$f_{{M\,chapultepec}} \left( t \right)\,{\equals}\,e^{{119.5970}} e^{{{\minus}0.06111t}} {\plus}0.9563$$
with R 2=0.997. The average pMC value for 1992–2012 was estimated as pMC*=102.4±0.25 and used in Equations 1 and 2 to estimate BC and FC.
Temporal variation of calculated BC, FC, and TC for the sites sampled

Uncertainties estimated for each sampling date ranged from 3.6% to 5.1% for BC (3.3±0.1 and 5.6±0.3 μg/m3, respectively) and from 2.6% to 4.5% for FC (4.2±0.1 and 8.7±0.4 μg/m3, respectively). These uncertainties are slightly larger than those obtained for pMC of TC (Figure 5). In UNAM and T0 sites, BC and FC increase at the end of the campaign while in IZT and CRN they remain constant. FC is in general greater than BC at T0 and UNAM. In contrast, IZT shows a similar contribution of BC and FC. In CRN, the situation is reversed and the biogenic contribution is much higher than the fossil one, and the gap between BC and FC through the campaign is almost constant. Both FC and BC showed little temporal variation.
CONCLUSIONS
Analyses of PM10, its carbon content, airborne elements, and ions were carried out on aerosol filters collected during November and December 2012 in Mexico and Cuernavaca cities. Average levels of PM10 were higher in Mexico City sites (43.3–60.8 μg/m3) relative to Cuernavaca (32.2 μg/m3), the reference site.
For every location in Mexico City, TC, OC, and EC values were higher than values at CRN. These numbers are similar to the previously reported values for the La Merced site (a commercial zone in downtown of Mexico City). Results on temporal variation of TC, OC and EC showed that in Mexico City locations and Cuernavaca, OC concentrations were in general, higher than EC.
When comparing the results of this study in T0 with the MILAGRO campaign, higher average pMC values were obtained in MILAGRO. This is likely due to the increased biomass burning component in March (when the MILAGRO campaign was carried out), as it is a common time for agricultural and natural fires.
According to the material balance, the PM10 collected in Mexico City had a lower contribution of crustal material (31.2% to 36.8%) than in Cuernavaca (46.9%). Average contributions of particulate carbonaceous matter to PM10 were similar in both cities, but much higher contribution of mineral salts, trace elements, and ions were observed in Mexico City relative to Cuernavaca.
AMS 14C was also applied to address the source apportionment of the carbonaceous matter in PM10. Average pMC values of TC measured in filters collected in the three sites of Mexico City (T0, UNAM, and IZT) were lower than those from Cuernavaca, indicating a higher apportionment of carbon from fossil fuels relative to biogenic sources, in the megacity. Results from a theoretical calculation of fossil (FC) and biogenic (BC) carbon concentrations showed that levels of FC and BC were a function of site: At the Mexico City sites, FC was equal or higher than BC. In Cuernavaca, BC was always higher than FC.
In a future study, we will include a longer and wider investigation of Mexican cities coupled with the measurement of specific markers of the modern and fossil particulate carbon in aerosol filters.
Acknowledgments
The authors would like to thank A Retama from SIMAT, Mexico City Government, and J C Reyes and J Castro for their support with aerosol monitoring. We also thank A Huerta, M Rodríguez Ceja, and M Saavedra for their technical assistance. This research was partially funded by the grants CONACYT 205317, 232718, 261085, 153663, and DGAPA-UNAM IG100216.