Adolescents have matured beyond the frailties of childhood, but have not begun the declines of aging; thus, the adolescent period can be characterized as a period of strength and resilience. Paradoxically, morbidity, and mortality increase markedly over the transition to adolescence making it also a period of risk and vulnerability. Dahl (Reference Dahl2004), in discussing this paradox, noted that most of the major sources of adolescent morbidity and mortality derive from problems in emotion and behavior regulation. As a disorder of emotion and stress dysregulation (Hasler, Drevets, Manji, & Charney, Reference Hasler, Drevets, Manji and Charney2004; Meyer, Chrousos, & Gold, Reference Meyer, Chrousos and Gold2001), the rising incidence of depression in adolescence provides a prime example. Depression, however, presents an additional developmental quandary. During childhood, depression rates are comparable between boys and girls, whereas in adulthood women account for the majority of clinical cases (Stroud, Papandonatos, Williamson, & Dahl, Reference Stroud, Papandonatos, Williamson and Dahl2004). The female preponderance in depression emerges around age 13–14 years (Stroud et al., Reference Stroud, Papandonatos, Williamson and Dahl2004). Because this age roughly corresponds to the midpoint of pubertal development, the role of hypothalamic–pituitary–gonadal axis in stimulating increases in depression in girls has been the focus of considerable research (see for review, Angold & Costello, Reference Angold and Costello2006). However, because in adults depression is associated with abnormalities in functioning of the stress-sensitive, hypothalamic–pituitary–adrenal (HPA) axis, several researchers have proposed that the rising incidence of depression among girls might also be related to puberty-associated changes in activity of the HPA axis (Spear, Reference Spear2000; see also Stroud et al., 2009).
The hypothesis that pubertal changes in HPA activity increase vulnerability to psychiatric disorder has been applied to disorders beyond depression (e.g., Spear, Reference Spear2000; Walker, Walder, & Reynolds, Reference Walker, Walder and Reynolds2001). The broader application of the puberty–HPA stress reactivity hypothesis is grounded in evidence that stress precipitates a variety of psychiatric disorders, that the HPA axis plays a critical role in stress, and that cortisol (the primary hormone of the HPA axis) impacts neurodevelopment (see Gunnar & Vazquez, Reference Gunnar, Vazquez, Cicchetti and Cohen2006). Broader application of the puberty–HPA stress hypothesis is not gender specific, although gender-differentiated vulnerabilities may interact with increasing HPA activity to influence the type of pathology observed.
The puberty–HPA stress hypothesis is about increasing stress reactions of the axis with sexual maturation. Nonetheless, researchers arguing this hypothesis typically point to evidence that basal activity of the axis increases in adolescence. Numerous studies have shown that basal cortisol levels increase between childhood and adulthood (see for review, Gunnar & Vazquez, Reference Gunnar, Vazquez, Cicchetti and Cohen2006). Although most of the evidence comes from cross-sectional studies (Kenny, Preeyasombat, & Migeon, Reference Kenny, Preeyasombat and Migeon1966; Kiess et al., Reference Kiess, Meidert, Dressensorfer, Schriever, Kessler and Konig1995; Scheifbein & Susman, Reference Scheifbein and Susman2006; although for null findings see Knutsson et al., Reference Knutsson, Dahlgren, Marcus, Rosberg, Bronnegard and Stierna1997), longitudinal analyses confirm these findings (Legro, Lin, Demers, & Lloyd, Reference Legro, Lin, Demers and Lloyd2003; Shirtcliff, Granger, Booth, & Johnson, Reference Shirtcliff, Granger, Booth and Johnson2005). There is disagreement over whether basal cortisol levels increase gradually or rise more markedly at some point during adolescent development. Walker et al. (Reference Walker, Walder and Reynolds2001) have argued for a marked increase in basal cortisol levels around midpuberty. To our knowledge, only one study provides support for this argument. Legro and colleagues (Legro et al., Reference Legro, Lin, Demers and Lloyd2003), studying urinary free cortisol in girls every 6 months, noted little change in the initial stages of sexual maturation but increasing levels around Tanner Stage III that continued through Tanner Stage V. Review of the figures in the article actually suggest that a year prior to first menstruation, basal cortisol production decreased before beginning to rise with sexual maturation. The Legro et al. (Reference Legro, Lin, Demers and Lloyd2003) study only examined girls. At least two other studies that included both genders revealed puberty-related increases in basal activity only for girls (Netherton, Goodyer, Tamplin, & Herbert, Reference Netherton, Goodyer, Tamplin and Herbert2004; Scheifbein & Susman, Reference Scheifbein and Susman2006), although increases for boys have also been reported (Adam, Reference Adam2006; Shirtcliff et al., Reference Shirtcliff, Granger, Booth and Johnson2005; Walker et al., Reference Walker, Walder and Reynolds2001). Thus, age- and puberty-associated increases in basal activity of the axis have been observed fairly consistently for girls, and less consistently for boys. Marked increases around midpuberty, although consistent with the rise in adolescent depression in girls at age 13–14, have been reported only in one study.
Age- or puberty-associated changes in stress responses of the HPA axis have been less studied (see also Stroud et al., 2008) and inconsistently reported. One frequently cited study involved 11- to 18-year-olds who were examined twice, 1 to 2 years apart (Walker et al., Reference Walker, Walder and Reynolds2001; Weinstein, Diforio, Schiffman, Walker, & Bonsall, Reference Weinstein, Diforio, Schiffman, Walker and Bonsall1999). Cortisol levels when the participants first arrived at the laboratory for testing were correlated with age and increased between the two assessments. Because cortisol levels decreased across each assessment, the initial laboratory samples were interpreted as stress reactions to the novelty of coming in to the laboratory, and hence, evidence of increased HPA stress reactivity as adolescence progressed. Unfortunately, because no baseline measures of cortisol were obtained, it is not certain that the initial laboratory samples were measures of the HPA stress response.
The Trier Social Stress Test (TSST; Kirschbaum, Pirke, & Hellhammer, Reference Kirschbaum, Pirke and Hellhammer1993) is widely recognized as a stressor task that contains all the elements (unpredictability, uncontrollability, and threats to the social self) that stimulate elevations in cortisol to laboratory stressors in human adults (Dickerson & Kemeny, Reference Dickerson and Kemeny2004). The TSST has been adapted for use with children as young as 7 years (TSST-C; Buske-Kirschbaum et al., Reference Buske-Kirschbaum, Jobst, Psych, Wustmans, Kirschbaum and Rauh1997; Buske-Kirschbaum et al., Reference Buske-Kirschbaum, von Auer, Krieger, Weis, Rauh and Hellhammer2003). In an analysis integrating data from various studies using children, adolescents, young adults and aging individuals, no evidence of age differences in stress responses were noted until participants reached an advanced age (Kudielka, Buske-Kirschbaum, Hellhammer, & Kirschbaum, Reference Kudielka, Buske-Kirschbaum, Hellhammer and Kirschbaum2004). This analysis, however, involved only a handful of peripubertal children, and thus might not have had the power to detect changes occurring around the transition to adolescence.
Among TSST studies of adults, gender differences have been noted in cortisol responses that are associated with stages of the menstrual cycle and oral contraceptives (Kirschbaum, Kudielka, Gaab, Schommer, & Hellhammer, Reference Kirschbaum, Kudielka, Gaab, Schommer and Hellhammer1999; Kirschbaum, Wust, & Hellhammer, Reference Kirschbaum, Wust and Hellhammer1992). At a certain point in the menstrual cycle, women exhibit smaller not larger HPA responses than do men. Thus, estrogen-related gender differences in cortisol responses to the TSST do not fit with the idea that during puberty the HPA system of girls becomes more stress responsive than that of boys, contributing to gender differences in adolescent and adult rates of depression. Consistent with pubertal increases in HPA reactivity for girls but not boys, however, Stroud and colleagues (2004) used corticotropin-releasing hormone (CRH) to stimulate pituitary (ACTH) and adrenal (cortisol) activity in 7- to 16-year-old physically and mentally healthy participants. They noted that with increasing sexual maturation, girls but not boys increased pituitary–adrenal output in response to CRH.
To summarize, there is significant evidence of age- and puberty-related increases in basal activity of the HPA axis among girls, with less evidence for boys. Evidence for marked increases around age 13–14 or the midpoint of puberty is less available. The evidence for increases in stress reactivity of the HPA axis is actually quite sparse and conflicting. Even so, increases in stress reactivity of this neuroendocrine system have been hypothesized as a partial explanation for rising rates of psychopathology among vulnerable adolescents. The study below was designed to examine the following questions about the normative development of both basal and stress reactivity of the HPA system as indexed using salivary cortisol: (a) are there increases in salivary cortisol basal levels and/or stress reactivity between 9 and 15 years, (b) are any increases similar for boys and girls, (c) are increases relatively linear across these years, and (d) are they associated with measures of sexual maturation? Home levels of cortisol collected over several days were used to examine questions about basal activity. The TSST-C was used as the laboratory stressor to examine age- or puberty-related changes in HPA reactivity. In addition, to replicate the Walker et al. (Reference Walker, Walder and Reynolds2001) study, we examined the first cortisol sample taken at laboratory arrival and compared it to the home sample at the same time of day to determine whether there are any age- or puberty-associated increases in cortisol stress reactions to coming to the laboratory for testing.
Of course, age, pubertal, or gender differences in cortisol responses to the TSST-C might reflect differences in psychological as well as physiological reactions to this stressor task. To help examine perceptions of task stressfulness, children self-reported on how stressed they were at several points during the assessment. We also obtained measures of heart rate (HR), preejection period (PEP), and vagal tone (VT). PEP reflects sympathetic regulation of HR, whereas VT indexes parasympathetic regulation. Generally speaking, there is an increase in cholinergic (parasympathetic) and decrease in adrenergic (sympathetic) modulation in HR variability between infancy and adulthood (e.g., Massin & von Bernuth, Reference Massin and von Bernuth1997), with these changes resulting in improved cardiovagal autonomic function (Lenard, Studinger, Merisch, Kocsis, & Kollai, Reference Lenard, Studinger, Merisch, Kocsis and Kollai2004). Between 9 and 15 years, however, changes are slight. Thus, we used these autonomic measures to provide another window into the participant's reactions to the TSST-C assessment. Finally, to examine associations between emotional behavior and HPA basal and stress-reactive functioning, we obtained parent reports of the participant's temperamental fearfulness and symptoms of anxious–depressed and withdrawn–depressed behavior problems. Associations with these measures were examined separately for boys and girls to determine whether these associations were stronger for girls, consistent with arguments that increases in HPA axis activity over the transition to adolescence might help explain increases rates of female depression around midpuberty.
Methods
Participants
Eighty-nine children aged 9 (M = 9.79, SD = 0.16), 11 (M = 11.57, SD = 0.15), 13 (M = 13.55, SD = 0.46), and 15 (M = 15.55, SD = 0.47) years, living in an urban region of the Midwest, were recruited from a list of families who previously had indicated interest in taking part in developmental research. Seven children were excluded from analysis because of obesity (n = 3), use of asthma medication on the day of testing (n = 1), deviation from normal sleep patterns (waking after 1 p.m.) on the day of testing (n = 2), and refusal to complete the session (n = 1), leaving 22 9-year-olds (12 girls), 18 11-year-olds (9 girls), 22 13-year-olds (10 girls), and 20 15-year-olds (9 girls) available for analysis (N = 82). Participants were screened at the time of recruitment to exclude those using steroid medications. The majority of participants (88%) were of European descent, but one was African American, 2 were Asian, 1 was Latino/Hispanic, and 6 were of mixed race/ethnicity. Nearly all (93%) lived in two-parent homes. Parent education ranged from high school or general education development (2.5% mothers, 7.6% fathers) to postbaccalaureate degrees (17.5% mothers, 29% fathers), with the median educational attainment being a college degree (55% mothers, 32% fathers). Family income (in $25,000 increments) ranged from $25,000–$50,000 to >$200,000, with a median income of $75,000–$100,000. There were no age group or gender differences for any of the demographic measures.
Procedures
The participants and at least one parent were asked to attend a laboratory session that lasted approximately 1.5 hr. The sessions started at roughly 4 p.m. and ended at 5:30 p.m. Participants were asked not to eat for 1 hr prior to coming to the laboratory. After consent/assent was obtained, the first saliva sample was taken and four spot electrodes were applied for autonomic recording while parents were present. The parent was then escorted to a nearby room where s/he completed questionnaires. The parent was able to watch the speech/math segment of the assessment on closed-circuit video. A 25-min adaptation period then began, during which the electrodes were given 19–20 min to acclimate to the skin while the participant worked on a puzzle with the help of the experimenter, then a second saliva sample was taken and adaptation autonomic data (6 min) were obtained while the participant relaxed and watched clips from National Geographic nature and animal videos.
Following the adaptation period, the TSST-C was administered (Buske-Kirschbaum et al., Reference Buske-Kirschbaum, Jobst, Psych, Wustmans, Kirschbaum and Rauh1997). This task involved providing participants with a story scenario and then giving them 6 min to develop their story (speech preparation period). During this time, the experimenter sat quietly in the back of the room and informed the participant when 3 min and 1 min remained in the preparation time. Participants were then taken to another room where they were confronted with several unfamiliar adult judges to whom they delivered their speech for 5 min, followed by 5 min of mental arithmetic testing (speech/math period). During the speech, if the child stopped speaking for longer than 20 s, the judges used scripted prompts to encourage the child to speak for the entire 5 min. During the math section, if the participant made an error the judges promptly said, “That is incorrect. Please start over from the beginning.” Throughout the speech/math segment the judges, who were the only ones other than the child present in the room, maintained somber, serious demeanors and pretended to take notes. The participants were told their performance was being videotaped and they delivered their speech facing not only the judges but also a highly visible video camera.
In the story scenario, the participants were to imagine that they had gone to the school library with a group of friends. Everyone put their backpacks down. When they retrieved their backpacks, one of their friends had lost their money for lunch. The backpacks were search by a teacher and the money was found in the participant's backpack. Although the participant was innocent, s/he was accused of taking the money and was being sent to the principal's office. The participant was told to develop a speech explaining that they were innocent that would be convincing to the principal and a teacher (the roles played by the two judges). The math problem used was subtraction by 7s starting from 758. This problem was too difficult for some of the participants. If the participant made five mistakes in a row or if they could not continue after fewer mistakes, the problem was changed to subtraction by 3s starting from 307. Older participants completed more problems than younger ones, F (3, 75) = 9.44, p < .001, and boys completed more than girls, F (1, 75) = 12.92, p < .001. There was no significant age group difference in the percentage of correct problems, F (3, 75) = 2.13, ns, although boys got a greater percentage of problems correct than girls, F (1, 75) = 10.53, p < .001 (M boys = 89.5, SD = 7.90; M girls = 82.2, SD = 12.10).
After the speech/math period, the participants were congratulated by the judges and experimenters and debriefed (i.e., reminded that all of the adults knew that they were role-playing and had not stolen anything). Audience members immediately adopted a friendly demeanor and the experimenter informed the child that the audience members had been instructed to act unfriendly as part of the study. They then returned to the original room and saliva collection and autonomic recording resumed. The participants watched another 12 min of the National Geographic video, divided into a 6-min postspeech period and 6-min recovery period. A puberty questionnaire was then administered and finally parents and participants were given and instructed on how to complete the home data collection kit. Participants were compensated with a $10 gift certificate for attending the lab session and a second $10 gift certificate for completing the home portion of the study.
Measures
Salivary cortisol
Saliva was collected by having participants chew a piece of original flavor TridentTM gum for 1 min and then spit through a 3-in. straw into a cryos vial (Eppendorf, Westbury, NY; Schwartz, Granger, Susman, Gunnar, & Laird, Reference Schwartz, Granger, Susman, Gunnar and Laird1998). The sealed vials were time/date labeled. Samples collected at home (see below) were stored in a zip-locked bag in the family's refrigerator and then mailed to the laboratory. These procedures have been shown not to affect cortisol levels (Clements & Parker, Reference Clements and Parker1998). Samples collected in the laboratory and those received through the mail were then stored at −20°C until assayed in duplicate using a time-resolved fluorescence immunoassay (DELFIA) with coefficients of variation of 5.4% (intraassay) and 8.1% (interassay).
Eight saliva samples were taken in the laboratory as follows: three were obtained over the adaptation period, one after consent/assent (M = 4:10 p.m.), one 15 and one 25 min later (adaptation cortisol 1–3). The last was considered baseline (see below) and its collection started the timing for the TSST-C. Samples were then taken immediately after the speech preparation period (+10 min), after the speech/math period (+20 min), and then at 10-min intervals until +70 min. To provide a home baseline, participants took saliva samples on two regular school days at 4 p.m. and 5 p.m. The 4 p.m. sample corresponded to the first laboratory adaptation sample and the 5 p.m. sample corresponded to the +30 min response sample which was anticipated to be the timing for peak cortisol response to the TSST-C. Families also completed a diary documenting sleeping, eating, and medications on the days of home saliva collection. Diary reported times of home sampling averaged 4:10 p.m. (SD = 60 min and 5:10 p.m., SD = 60 min). Of the 82 participants, 78 provided home samples. The five participants who did not provide home samples did not differ on laboratory cortisol activity compared to those who did, F (1, 77) = 1.7, ns.
The home samples were correlated across days: home, 4 p.m., r (72) = 0.30, p < .01; home 5 p.m., r (72) = 0.44, p < .01. Thus, the two samples were averaged to yield one home value for each time point. We expected that by the third adaptation sample cortisol levels would be at home levels. A repeated-measures analysis of variance (ANOVA) comparing the 4 p.m. home sample with the third adaptation sample yielded a nonsignificant trials effect, F (1, 76) = 0.01, p > .05, M home = 0.15 µg/dl, SD = 0.07; M adaptation3 = 0.15 µg/dl, SD = 0.10. The third adaptation sample was used as the laboratory baseline value. To estimate cortisol secretion, three measures were computed using the trapezoidal method for computing area under the curve (AUC): home (AUCh), adaptation (AUCa), and stress (AUCs; Pruessner, Kirschbaum, Meinlschmid, & Hellhammer, Reference Pruessner, Kirschbaum, Meinlschmid and Hellhammer2003). The two averaged home measures were used to calculate AUCh, the three adaptation measures were used for AUCa, while the third adaptation, speech preparation, and six postspeech cortisol samples were used for AUCs. In response to the TSST-C, we wanted the measure to reflect elevation over baseline; thus, AUCs was corrected for the third adaptation level (i.e., baseline).
Autonomic measures
HR, PEP, and VT were obtained simultaneously during four 6-min collection periods (adaptation, speech-prep, post, and recovery). During each collection period, event marks were made at 3-min intervals, and measures were computed for two 3-min periods within each collection period (i.e., Adaptations 1 and 2). A SORBA Medical Systems Inc. CIC-1000 was used to collect electrocardiogram (ECG) readings and estimate PEP. The signal was obtained through four spot electrodes attached to the child's mastoid, below the collarbone, on the lower abdomen, and on the backside of the ribcage. A 500-µA signal was fed through two of the four electrodes, and the transthoracic impedance was recorded through the others. For each 20-s epoch within each collection period, Q-onsets and the impedance notch points were identified and ensemble averaged to obtain an estimate of PEP. Noise detection was set at a threshold of 0.0 and data were aligned to dZ/dt max. PEP was calculated as the time, in milliseconds, from the ECG Q-wave to the dZ/dt1 in the CIC software. These estimates are then averaged within collection periods providing one PEP value per each baseline, speech prep, recovery1, and recovery2. Scoring was completed to remove trials from the averages where an exceptional amount of artifact was present. VT was obtained using raw ECG input from the electrodes into a Polar HR monitor to detect R-spikes and a Mini-Logger (Mini-Mitter Co. Inc., Bend, OR) recorded interbeat intervals (IBIs) throughout each collection period. R-Spikes were detected from the ECG signal and IBIs were calculated. MXedit software was used to create a visual representation of cardiac data, to correct for outliers and artifacts, and to calculate VT (Porges, Reference Porges1985). Respiratory sinus arrhythmia was computed with a time-series analysis with the following parameters, and its amplitude was used as an estimate of VT. Epochs were created every 30 s with a sampling rate of 250 ms, and a bandpass frequency of 0.24 to 1.04 Hz to approximate respiration across this wide age range (S. Porges, personal communication, May 8, 2006). Recovery period measures of autonomic activity were expected to be the most quiescent, and thus were used as baseline measures. Speech preparation was expected to be the most aroused autonomic period (as we did not measure during the speech and math periods); thus, the difference between speech preparation and recovery values was used to index autonomic stress responses.
Movement artifact and equipment problems produced some missing data for the autonomic measures. Seventy-four participants had complete data for HR and PEP, whereas 70 had complete data for VT. Autonomic measures were, therefore, analyzed using growth analysis with maximum likelihood estimation allowing for imbalance in the repeated measures thus maximizing the degrees of freedom available for hypothesis testing. Growth curve analyses for HR, PEP, and VT were conducted using linear mixed models. Based on theoretical expectations of the speech preparation period being the most stressful (highest HR, lowest PEP, lowest VT), a quadratic model was specified. Initial curve fitting, however, indicated the need for a cubic model. Parameter estimates and statistical tests were obtained with the MIXED procedure of SAS version 9.1. Restricted maximum likelihood was used, which allows for missing data and produces unbiased estimates for small sample sizes (Fitzmaurice, Laird, & Ware, Reference Fitzmaurice, Laird and Ware2004, chap. 4). In addition, the Kenward and Roger (Reference Kenward and Roger1997) method of estimated degrees of freedom for small sample size were used in all hypothesis tests. We used F tests based on Type III sums of squares for testing the model effects and unadjusted t tests for follow-up tests.
Puberty measure
The Pubertal Development Scale (Petersen, Crockett, Richards, & Boxer, Reference Petersen, Crockett, Richards and Boxer1988) was administered to 52 of the 82 participants. Administering this questionnaire had not been part of the original design, and thus it was not given to the first participants run through the protocol. Children were given the questionnaire and instructed that their answers to these questions were confidential. The questionnaire was then filled out independently, unless the child asked the experimenter to clarify the meaning of any of the questions. Four questions, with responses ranging from 1 (has not begun) to 4 (is complete), examined growth, skin changes, pubic hair, and breast/voice changes. The average of these four questions was the puberty index. In addition, girls were asked whether they had begun menstruating.
Perceived stress
A self-report measure of perceived stress was obtained at the end of the recovery period. Children were shown the Self-Assessment Manikin developed by Lang (Reference Lang, Sidowski, Johnson and Williams1980). The first figure was characterized to the child as being “completely relaxed,” whereas the fifth figure was said to be “freaking out.” “Freaking out” rather than stressed out was used because in pilot testing some of the participants, especially the younger ones, were not familiar with the term stress. Children were asked to use this scale to describe their reactions at five points in the testing: arrival at the laboratory, during speech preparation, while giving the speech, during the math segment, and during the recovery period. As expected, perceived stress varied across the session, trials, F (3.32, 215.30) = 103.64, p < .001; M arrival = 1.60, M speech prep = 2.23, M speech = 3.11, M math = 2.92, M recovery = 1.23. Perceived stress during the math segment was correlated with the percentage of correct problems solved, r (80) = −.36, p < .001; therefore, we computed a TSST-C stress score based on the average of the speech preparation, speech and recovery periods, Cronbach αc = .60.
Fearful temperament and depressive symptoms
Two instruments were used to obtain parent-report measures of the participant's fearfulness: the Fear Scale of the Emotionality, Activity, Sociability, and Impulsivity Temperament Survey—Third Edition (Buss & Plomin, Reference Buss and Plomin1984) and the Behavioral Inhibition Scale from the BIS/BAS (Carver & White, Reference Carver and White1994) adapted for children (adapted by Steve Sutton; see also Blair, Reference Blair2003). These two scales were highly correlated, r (80) = .58, p < .001, and were standardized and averaged to yield one measure of fearful temperament. In the course of the study, it was decided to include the school-aged version of the Child Behavior Checklist (CBCL) to obtain a measure of depressive symptoms (Achenbach & Rescorla, Reference Achenbach and Rescorla2001). These data from parent report were available for the last 58 of the 82 participants. Two scales on the CBCL examine depressive symptoms: Anxious/Depressed and Withdrawn/Depressed. Scores on these scales ranged from 0 to 8, M = 1.95, SD = 2.16 for Anxious/Depressed and 0 to 6, M = 1.22, SD = 1.54 for Withdrawn/Depressed. All but one child scored below the clinical range on these two scales. These two scales were highly correlated, r (56) = .60, p < .001, and were standardized and combined to yield one measure of depressive symptoms or behavior problems (Cronbach α = .71). There were no significant gender, age, or interaction effects for this summary measure.
Results
Cortisol measures
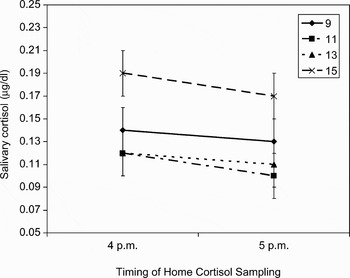
The Sex (2) × Age Group (4) ANOVA on cortisol secretion at home (AUCh) yielded a significant main effect of age group, F (3, 69) = 3.08, p = .033, partial η2 = .11. Neither the main nor interaction effect for gender was significant. Post hoc tests using the Fisher's least significant difference (LSD) formula revealed that 15-year-olds secreted significantly more cortisol than 11- and 13-year-olds. Means and standard deviations were the following: 9-year-olds, M = 8.99, SD = 5.62; 11-year-olds, M = 7.18, SD = 2.82; 13-year-olds, M = 7.85, SD = 5.15; 15-year-olds, M = 11.36, SD = 5.22. Figure 1 depicts the means and standard errors of the mean of the cortisol values used in computing AUCh.
Home cortisol by age group in micrograms per deciliter (μg/dl). Bars reflect standard errors of the mean.

To determine whether there was a cortisol response to coming to the laboratory, a Gender (2) × Age Group (4) × Trials (2) repeated-measures ANOVA was computed using the 4 p.m. home value and the initial laboratory (first adaptation) value. Although a significant cortisol response to the laboratory was obtained, F (1, 69) = 5.38, p = .023, ηG2 = .07 (Bakeman, Reference Bakeman2005), there were no significant interaction effects of trials with gender or age group. The main effect of age group was significant, F (3, 69) = 6.81, p < .001, ηG2 = .09, but because the 4 p.m. home value was included in this analysis, it was not independent of the previously reported home cortisol analysis. Combined across age groups, the initial laboratory sample averaged 0.03 µg/dl higher than home values at the same time of day (SEM = 0.01).
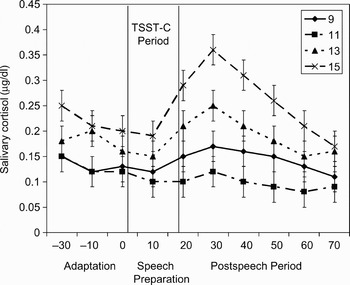
Cortisol secretion during the adaptation period (AUCa) yielded only a significant age group effect, F (3, 73) = 3.07, p = .033, partial η2 = .10. Using LSD post hoc tests, during the adaptation period 15-year-olds' cortisol secretion was higher than either that of the 9- or 11-year-olds; AUCa: M 9 = 4.54, SD = 2.89; M 11 = 4.01, SD = 1.31; M 13 = 5.45, SD = 3.11; and M 15 = 6.64, SD = 3.35. Figure 2 depicts the means and standard errors of the mean for all of the cortisol values taken in the laboratory.
Laboratory cortisol by age group in micrograms per deciliter (μg/dl). Bars reflect standard errors of the mean. The period from introduction of the TSST-C until the end of the speech/math period is indicated.

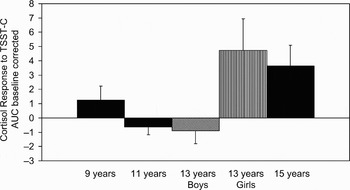
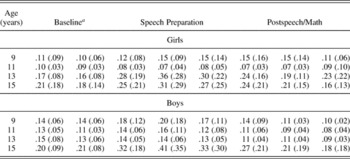
Finally, we examined cortisol reactions to the TSST-C. The baseline corrected cortisol response to the TSST-C (AUCs) did not differ by gender, F (1, 73) = 0.11, ns. There was a marginally significant effect of age group, F (3, 73) = 2.21, p = .094, partial η2 = .084, and a significant Gender × Age Group interaction, F (3, 73) = 2.87, p = .042, partial η2 = .11. Tests of simple effects of gender within age group revealed that 13-year-old girls exhibited a larger response than did 13-year-old boys, F (1, 19) = 5.82, p < .05; gender differences were not significant at 9, 11, and 15 years. Figure 3 depicts these effects, presenting boys and girls separately only at 13 years, the age where the gender difference was significant (see also Figure 2). LSD examination of age group differences revealed that 15-year-olds exhibited larger AUCs than did 11-year-olds. Table 1 provides the descriptive data on the cortisol measures used in this analysis.
Means and standard errors of the mean of cortisol AUC (baseline corrected) in response to the TSST-C by age group. Separation means for boys and girls are depicted at age 13 to reflect the significant gender difference in cortisol response at this age.

Mean (standard deviation) cortisol values used in calculating baseline corrected area under the curve

aThird adaptation sample.
Autonomic results
HR
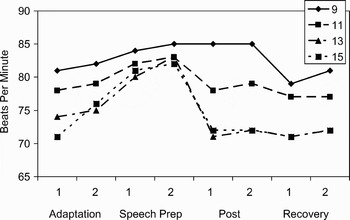
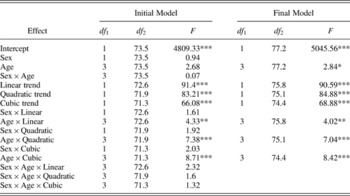
Figure 4 shows the HR data, and Table 2 provides the results of the HR analysis, with results for the initial model (full model) on the left and those of the final model based on the step-down analysis on the right. The initial model showed no significant gender effects (single and interactions); thus, those effects were omitted, resulting in a final model with age group differences. The results in the right-hand columns indicate a significant age by trend interaction (i.e., Age × Cubic, Age × Quadratic, and Age × Linear) and significant age differences in level at baseline (i.e., age main effect). To investigate age differences in overall level, all possible pairwise comparisons of the intercepts were tested. Significant differences were found for age 13 versus age 9, mean difference = −7.39, t (77.4) = 2.54, p < .01, and age 15 versus age 9, mean difference = −7.07, t (77.4) = 2.43, p < .05. Nine-year-olds also exhibited a monotonic increased HR for a much longer period than the other age groups. Mean HR of the 9-year-old group began to decrease by Recovery 1, whereas the older groups began to decrease by Post 1. Overall, 9-year-olds had the highest HRs.
Means and standard errors of the mean for HR activity during the TSST-C by age group.

Results of the heart rate analysis

*p < .05. **p < .01. ***p < .001.
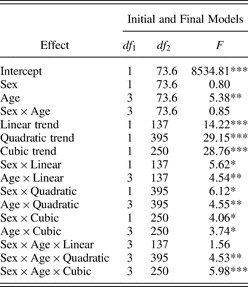
PEP
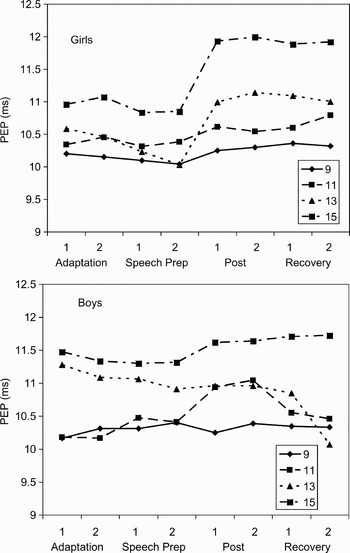
Table 3 shows the results of the PEP analysis. Because the highest order term of the initial model was significant (Gender × Age × Cubic), the initial model was also the final model. Figure 5 shows the PEP data with girls in the top panel and boys in the bottom panel. Fifteen-year-old girls showed a reduction in sympathetic arousal (increase in PEP) as soon as the speech and math period was over (i.e., post and recovery), as did the 11-year-old girls even though overall their PEP values were lower (more sympathetic arousal). The 9- and 11-year-old girls showed less modulation of PEP over the testing session. For boys, 11-year-old boys showed a pattern of PEP modulation similar to the 13- and 15-year-old girls, whereas the other boys did not. Overall, however, for both boys and girls, 15-year-olds had the highest PEP values (lowest sympathetic activity).
Means and standard errors of the mean for PEP during the TSST-C by age group.

Results of the pre-ejection period analysis

*p < .05. **p < .01. ***p < .001.
VT
Other than the intercept, no effects were significant in the full or any reduced models. Thus, there were no age group, gender, or interaction effects for VT.
Perceived stress and parent-report measures
To examine whether some of the age changes might be due to age differences in perception of the stressfulness of the TSST-C procedures, we computed Gender (2) × Age Group (4) ANOVA on the perceived stress measure. Neither age nor gender effects were significant. Perceived stress was correlated with cortisol reactivity to the TSST-C (AUCs), r (80) = .22, p < .05 and marginally with PEP reactivity, r (78) = .20, p < .10.
For parent-reported fearful temperament and depressive symptoms, correlations were computed within gender. No significant correlations were obtained with home basal levels of cortisol or baseline measures of either sympathetic or parasympathetic activity. For girls, depressive symptoms were significantly correlated with cortisol reactivity to the TSST-C, r (29) = .61, p < .001, but this was not the case for boys, r (25) = −.18, ns. The difference between these correlations was significant (Z = 3.17, p < .001). Fearful temperament was not significantly associated with cortisol reactivity for girls, r (29) = .17, ns, but was negatively correlated with cortisol reactivity for boys, r (25) = −.37, p < .05. These correlations were also significantly different (Z = 2.42, p < .05). For both genders, fearful temperament was negatively correlated with baseline PEP, r girls (39) = −.46, p < .01, r boys (38) = −.35, p < .05. As lower PEP values index higher sympathetic activity, these correlations indicate that more temperamentally fearful children exhibited higher baseline sympathetic tone.
Puberty scores and cortisol measures
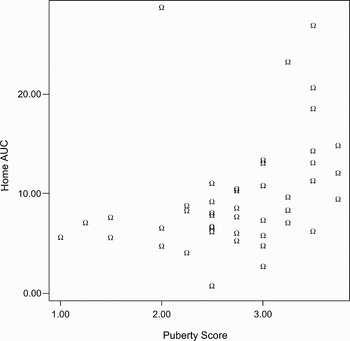
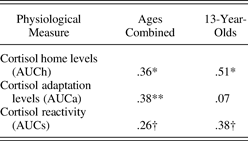
Puberty scores could range from 1 to 4; values in this sample ranged from 1 to 3.75. As would be expected, controlling for age, girls (M = 2.9, SD = 0.71) were more advanced than boys (M = 2.61, SD = 0.62). Age was highly correlated with puberty scores, r (50) = .74, p < .001. The means for puberty scores were the following: 9 years, M = 1.7, SD = 0.35; 11 years, M = 2.1, SD = 0.43; 13 years, M = 2.7, SD = 0.53; 15 years, M = 3.3, SD = 0.33. As expected, the variability and gender differences were the most marked at age 13. At 13 years, 70% of the girls had begun menstruation and had puberty scores above 3, whereas only 25% of the boys had scores in this range. We analyzed the association between puberty scores and cortisol measures first for the total group. However, because these analyses confounded age and pubertal status, we also examined whether they would hold within the 13-year-old age group. Because puberty and gender were so highly correlated at this age, the 13-year analysis needs to be viewed with caution. Table 4 shows that home basal cortisol levels were positively correlated with puberty scores both when we combined age groups and within the 13-year-old age group. Cortisol levels during adaptation were also correlated with puberty scores, but this did not hold among just the 13-year-olds. Cortisol reactivity (baseline corrected) was marginally associated with puberty, and this same association was marginally significant among only the 13-year-olds as well. To attempt to determine whether the associations were linear or quadratic, curve estimates were computed entering both linear and quadratic terms. For home basal cortisol (AUCh), after entering the linear term, the equation with the quadratic term accounted for 32% of the variances, F (2, 44) = 10.14, p < .001, quadratic term, t = 2.0, p = .056. The inflection in the curve revealed higher basal cortisol levels for participants with puberty scores of 3 or above (see scatter plot, Figure 6). This was also the case when only the 13-year-olds were examined. For 13-year-olds, the equation with the quadratic term included explained 48% of the variance, F (2, 17) = 7.7, p < .01, quadratic term, t = 2.6, p < .05. Similar analyses for the cortisol reactivity data (AUCs) did not yield evidence of a quadratic relation with puberty scores.
Home cortisol measures (AUCh) as a function of puberty score.

Correlations of puberty with physiological measures for all ages combined and 13-year-olds separately
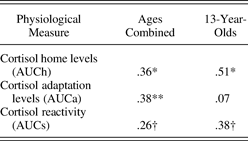
Note: The total numbers ranged from 38 to 52 for Ages Combined and 20 to 21 for 13-year-olds. AUCh, AUCa, and AUCs, areas under the curve home, adaptation, and stress, respectively.
†p < .10. *p < .05. **p < .01.
Discussion
The TSST has been used with a variety of ages from school-aged children to adults (Kudielka et al., Reference Kudielka, Buske-Kirschbaum, Hellhammer and Kirschbaum2004). Although it has been previously argued that this laboratory stressor evokes similar cortisol responses across this wide age range (Kudielka et al., Reference Kudielka, Buske-Kirschbaum, Hellhammer and Kirschbaum2004), the results of the present study indicate developmental changes in cortisol reactions to this protocol over the transition to adolescence. Certainly, any age-related changes in HPA response might reflect age changes in the emotional and cognitive demands of the task. Thus, this possibility needs to be considered before discussing the cortisol results. We obtained no age differences in self-reports of stress during the TSST-C. Although these data need to be viewed cautiously, the fact that perceived stress correlated with cortisol and sympathetic reactivity to the TSST-C suggests that these self-reports were reasonably valid (for similar findings with children see Lindahl, Theorell, & Lindblad, Reference Lindahl, Theorell and Lindblad2005). Furthermore, the autonomic data did not indicate that the TSST-C was more threatening for older than younger participants. Indeed, it was the youngest participants who had the highest HRs, whose high HRs were sustained longer and whose PEP data indicated that they were the most sympathetically aroused. Among 13- and 15-year-olds, although increases in HR to the TSST-C were noted, these increases were noticeable because they came against a backdrop of lower HRs during the adaptation period and even lower HRs once the speech/math period was over. The PEP data indicate that, overall, the older participants were less sympathetically aroused especially once the speech/math period was over. Taken together, the self-report and autonomic data argue that the laboratory protocol was not more threatening for the older participants; indeed, if anything the whole experience of laboratory testing appeared to be less challenging for them than for the younger participants.
Against this backdrop, the developmental changes in HPA activity are particularly striking. The results of the present study clearly indicate that the transition to adolescence is accompanied by changes in activity of the HPA axis (see also this issue, Stroud et al., Reference Stroud, Foster, Handwerger, Papandonatos, Granger and Kivlighan2009). These changes involve both increases in basal activity and changes in stress reactivity. Furthermore, the results provide support for the argument that heightened HPA activity is associated with pubertal maturation. The age- and puberty-associated differences in basal and stress activity of the axis differ somewhat and are discussed separately.
The results add to a growing literature indicating that basal activity of the HPA axis increases with age and sexual maturation during the adolescent years (Adam, Reference Adam2006; Legro et al., Reference Legro, Lin, Demers and Lloyd2003; Netherton et al., Reference Netherton, Goodyer, Tamplin and Herbert2004; Scheifbein & Susman, Reference Scheifbein and Susman2006; Shirtcliff et al., Reference Shirtcliff, Granger, Booth and Johnson2005; Walker et al., Reference Walker, Walder and Reynolds2001). Increases in the set point of the HPA axis with age were apparent for both genders and for both home and laboratory measures. At home, levels for the 9-, 11- and 13-year-olds did not differ significantly, while those for the 15-year-olds were higher, significantly so when compared to the 11- and 13-year-olds. During the adaptation period in the laboratory, again 15-year-olds exhibited the highest cortisol levels, this time significantly higher than the 9- and 11-year-olds. Finally, although we analyzed the cortisol response to the TSST-C corrected for baseline, the data in Figure 2 clearly show that the 15-year-olds continued to maintain higher cortisol output throughout most of the session. In sum, the increased set point for the HPA axis was apparent for both boys and girls and across both home and laboratory contexts of measurement.
Consistent with the age group data, which suggested a nonlinear pattern of increase with age, the puberty data also revealed a nonlinear relation between basal cortisol and sexual maturation. Here, the data suggested that puberty scores of around 3 (on a 4-point scale) were associated with increasing basal cortisol levels. This was observed when all the children with puberty data were examined and when the 13-year-old age group was examined separately. These latter data, although obtained on a small number of children, help to pinpoint the effect as related to sexual maturation and not merely age. Because the cortisol measures in the present study were all obtained late in the afternoon, we cannot be sure that the results generalize to basal set points at other times in the day. However, it is noteworthy that the present findings are consistent with Legro et al.'s (2003) data, which involved 24-hr urinary cortisol measures.
Turning to the cortisol reactivity data, here we also found evidence of increases in reactivity with age and pubertal maturation, and again the pattern was not linear. Considering age first, consistent with Stroud (2008), overall, participants under 13 years had lower cortisol reactivity than did participants 13 years and older. However, it was not merely that the younger participants failed to respond to the TSST-C. This was the case for the 11-year-olds, but not for the 9-year-olds. The 9-year-olds showed a significant cortisol response to the TSST-C, as has been reported in other studies of elementary school-aged children (Kudielka et al., Reference Kudielka, Buske-Kirschbaum, Hellhammer and Kirschbaum2004; C. Kirschbaum, personal communication, August 2006). Strangely, at 11 years, cortisol levels decreased rather than rose in response to the TSST-C. Declining cortisol levels following imposition of a presumed stressor is not an uncommon finding. What makes it noteworthy in the present study is that these declining values were noted only among the 11-year-olds of both genders and the 13-year-old boys. When declining values are observed in stressor studies, two explanations are typically given. One explanation is that the task was imposed when the HPA axis was already activated (i.e., elevated above baseline), and thus, in the context of negative feedback regulation of the axis. In the present study, however, all of the participants were adapted to the laboratory prior to introducing the TSST-C instructions. For all age groups cortisol levels were at home basal levels at the time the TSST-C was initiated. Thus, this explanation seems unlikely. The second explanation is that the stressor task was not potent enough to activate the axis. For this explanation to hold there would need to be a reason that the task was sufficiently stressful for 9-year-olds and 15-year-olds, but not for 11-year-olds or 13-year-old boys. As the participants rated the session as equally stressful across all ages and autonomic data indicate that, if anything, the whole session was more arousing for the 11- and 9-year-olds, than for the older participants, this explanation also seems unlikely. Thus, the hyporesponsiveness of the HPA axis to this stressor at 11 years and, for boys, at 13 years is striking and begs explanation. The association of this apparent hyporesponsivity of the axis at earlier stages of sexual maturation raises the possibility that physiological changes associated with early stages of puberty may play a role. In addition to replicating these findings and extending them to other stressor tasks, examining their association with other physiological changes that occur around this point in sexual maturation is needed.
In the present study, although the means for cortisol reactivity to the TSST-C were higher for the 13-year-old girls and 15-year-olds of both genders than for the 9-year-olds, perhaps because of insufficient power, the difference was statistically nonsignificant. The evidence of a marginally significant association with puberty scores, however, would tend to support the possibility that rising HPA reactivity with sexual maturation is superimposed on rising basal cortisol levels. There was no evidence that by 15 years, greater HPA reactivity was peculiar to girls. However, at 13 years, girls were clearly more HPA reactive than boys of the same age. We cannot tell from the present study whether this gender difference in HPA reactivity during early adolescence might contribute to the gender difference in rising rates of depression at this age. The participants in the present study were drawn from the community. Although CBCL data were obtained only for the last 58 (70%) of the participants tested, only one (a boy) exhibited clinical levels of depressive symptoms. Thus, the participants in this study likely represented a relatively healthy sample with regard to affective disorders. Even so, girls but not boys who exhibited more depressive symptoms also exhibited larger cortisol reactions to the TSST-C. This gender difference was not because of girls being more temperamentally fearful. Indeed, temperamental fearfulness was not correlated with cortisol reactivity for girls and bore an anomalous negative correlation with cortisol reactivity for boys. For both genders, more fearful participants had higher baseline sympathetic tone. Thus, the correlation between cortisol reactivity and depressive symptoms for girls may indicate that activity of the HPA axis is more closely bound with risk for depression for girls than it is for boys. Of course, the sample size was small when divided by gender; thus, these associations need to be viewed with caution. There are a number of other limitations to this study. Because the focus was on normative developmental changes, we recruited a low psychosocial risk sample with regard to socioeconomic status. The sample was also largely Caucasian. We cannot generalize results to lower socioeconomic status groups or other racial/ethnic groups. Because we did not recruit a sample at risk for psychopathology, we cannot generalize to children at risk for depression or other disorders that increase in frequency in adolescence. A study comparing developmental changes in basal and reactive cortisol between participants at low and high risk for psychopathology is clearly needed. In addition, cortisol was our only measure of HPA activity. Studies exploring other levels of the axis are needed to help determine whether the developmental differences observed in this study are due to increased adrenal responsiveness to ACTH, greater pituitary sensitivity to CRH, changes in hypothalamic CRH activity, or alterations in negative feedback control of the HPA system with age or sexual maturation. Another limitation is that we only examined one laboratory stressor. Thus, we cannot generalize the reactivity data in this study to other types of stressor tasks (see this issue, Stroud et al., Reference Stroud, Foster, Handwerger, Papandonatos, Granger and Kivlighan2009). Still another limitation is that all of the measures were obtained late in the afternoon. Although the HPA axis should be more sensitive to stimulation later in the day, we cannot generalize the results to other points during the HPA diurnal rhythm. Finally, we used a cross-sectional design. A longitudinal design would allow stronger conclusions; however, repeating a laboratory stressor introduces issues of habituation/familiarity that complicate longitudinal analyses of stress reactivity.
Despite these limitations, the present study adds to evidence that the transition to adolescence is associated with significant increases in HPA activity. These increases in basal and reactive cortisol may increase risk of psychopathology in vulnerable individuals. Heightened risk of depression may be related to increased cortisol reactivity for girls, but the increase in risk of psychopathology may extend beyond depression. Nonetheless, it would be wrong to view the present findings as indicating that there is a general increase in stress vulnerability with the transition to adolescence. Between 9 and 15 years our measures of HR and sympathetic arousal indicated reduced and more modulated stress responses. Indeed, if the sympathetic arm of the stress system had been the focus of this study, we would have concluded that children become less stress vulnerable over the transition to adolescence. Viewed in conjunction with the autonomic data, the increase in cortisol reaction over this age period can be seen as part of the emergence of a more adultlike pattern of responding to this stressor task. That is, a more marked and modulated adrenal (medulla and cortex) response to the challenge of this stressor task as children approach mature adult status. For most children it seems likely that these developmental changes lead to greater physiological support for the cognitive and emotional challenges represented by this type of performance stressor. Rather than disrupt functioning, it seems likely that in healthy individuals these developmental changes would support competent functioning. Thus, the results of the present study conform to the paradox of adolescence; specifically, normative developmental changes resulting in adolescence being a period of increasing competence and resilience, while at the same time being a period when vulnerable individuals are at increasing risk of emotional and behavioral disorders.