Controlling the phase transition characteristics in strongly correlated electron systems such as vanadium dioxide (VO2) is fundamentally important due to its reversible switching capabilities of electrical,Reference Morin1 thermal,Reference Dong-Wook, Changhyun, Shriram and Cahill2 and opticalReference Barker, Verleur and Guggenheim3 properties across the metal–insulator transition (MIT) near room temperature. Along with the several orders of magnitude change in electrical resistance and optical transmittance, experimentally measured large recoverable stress arising from monoclinic to tetragonal structural transition makes VO2 thin film a potential candidate for novel actuator/sensor applications.Reference Viswanath, Ko and Ramanathan4, Reference Rua, Fernandez and Sepulveda5 Areal changes associated with the structural phase transition are primarily responsible for the stress change in VO2 thin films that induces the substrate to bend reversibly. Studies on this particular problem of how to control the stress interactions during a metal–insulator phase transition are still in their early stages. Although microelectromechanical systems (MEMS)-based devices may require high recoverable stress across the phase transition to deliver large actuation force, making use of MIT properties, such as for phase-change memory applications, demands minimal phase transition-induced stress changes in functional materials. For example, the stress change associated with phase transition in Ge2Sb2Te5-based chalcogenides can limit its performance in phase-change random access memory applications.Reference Kang, Choi, Wamwangi, Wang, Steimer and Wuttig6 Hence, understanding factors that influence stress relaxation across a phase transition is important from scientific and technological aspects.
Here, we study the grain-size dependence of MIT-induced stress changes in VO2 thin films grown on Si substrate by studying various thicknesses of VO2 layers. Microstructural investigation combined with in situ wafer curvature measurements as a function of temperature indicates a correlation between the thicknesses, grain size, and stress relaxation across the phase transition. Although size effects on structural phase transition,Reference Lopez, Haynes, Boatner, Feldman and Haglund7 optical,Reference Lopez, Feldman and Haglund8 and electrical propertiesReference Sahana, Dharmaprakash and Shivashankar9–Reference Suh, Lopez, Feldman and Haglund11 of VO2 thin films across the MIT have been considered in previous studies, microstructural effects on the associated stress changes have not received much attention to date. The investigated nonmonotonic size-dependent stress relaxation behavior of VO2 could be critical in designing memory or MEMS devices based on phase-change properties.
Polycrystalline VO2 thin films of various thicknesses were grown on n-type Si (100) single crystalline substrates by RF sputtering at 550 °C using V2O5 target. Thin film stress measurements were carried out using TENCOR FLX-2320 instrument (TENCOR Instruments, CA) by in situ wafer curvature method from 40 to 100 °C as a function of several heating–cooling cycles. Thicknesses of the VO2 films were obtained from cross-sectional transmission electron microscopy (X-TEM). Atomic force microscopy (AFM) was used to estimate grain size distribution. Glancing angle x-ray diffraction has been carried out to investigate the VO2 phase and its orientation.
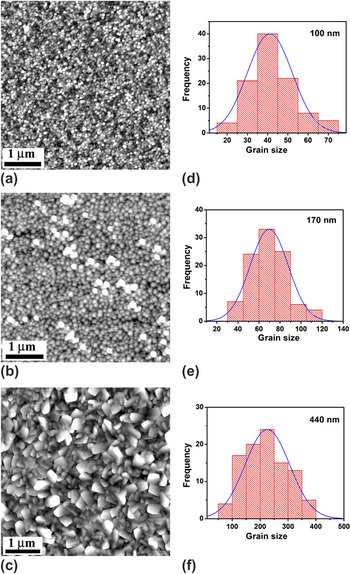
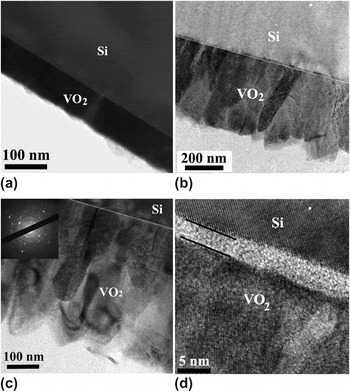
With increasing film thickness, the average grain size increases gradually that is evident from a series of AFM images shown in Fig. 1. VO2 films of nominal film thickness of 100 and 170 nm display normal grain size distribution with an average grain size of ∼41 and ∼70 nm, respectively. The microstructure of VO2 film deposited for 720 min is different in that it consists of much larger grains along with some proportion of smaller grains with an average grain size of ∼226 nm showing uniform distribution in grain size with a standard deviation of 80 nm. This grain growth can take place by densification process during which the total grain boundary area will be reduced by replacing fine grains with coarse grains.Reference Thompson and Carel12 Representative X-TEM bright-field and lattice images obtained from VO2 films grown on Si (100) substrate are shown in Fig. 2. VO2 thin film of thicknesses 100 and 440 nm grown for 120 and 720 min, respectively, are seen in Fig. 2(a) and Fig. 2(b), respectively. To resolve the densely packed polycrystalline columnar grains and grain boundaries better, bright-field image was also recorded at slight underfocus condition and shown for VO2 film grown for 720 min [Fig. 2(c)]. Inset shows the corresponding selected area diffraction pattern indicating the polycrystalline nature of the VO2 film. The thickness of the interfacial amorphous interfacial layer of ∼3 nm between VO2 film and Si (100) substrate (that forms during the deposition process) is similar in all samples and a representative high-resolution transmission electron microscopic image recorded from VO2 film of 440 nm is shown in Fig. 2(d). The polycrystalline nature of VO2 and its orientation has been checked by x-ray diffraction, and VO2 films on Si substrate show similar out-of-plane orientation in the studied film thickness range presented here.
Atomic force microscopy images of vanadium dioxide (VO2) film/Si deposited for (a) 120 min, (b) 240 min, and (c) 720 min with different thicknesses (100, 170, and 440 nm). Grain size distribution of VO2 film with different thicknesses (d) 100 nm, (e) 170 nm, and (f) 440 nm.

Representative cross-sectional transmission electron microscopy (X-TEM) bright-field images of VO2 thin films grown on Si with thicknesses (a) 100 nm and (b) 440 nm are shown. (c) Polycrystalline nature of the VO2 film with 440-nm thickness is evident from X-TEM bright-field image recorded at slight underfocus condition and the selected area diffraction pattern (inset). (d) High-resolution image of a 440-nm-thick VO2 film on Si substrate shows ∼3 nm of amorphous layer (marked by solid lines) at the interface.

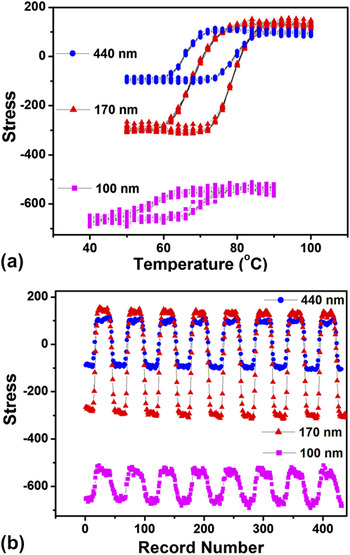
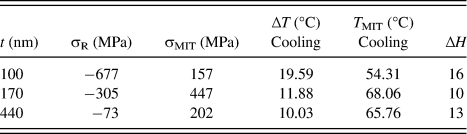
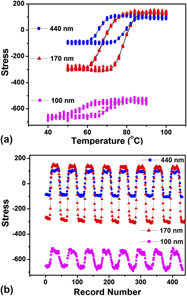
Figure 3 shows the stress change across thermally triggered MIT during 10 thermal cycles for VO2 film of different thicknesses. This clearly shows the strong thickness dependence on stress relaxation characteristics, which is evident from the large differences in recoverable stress, hysteresis, transition temperature, and transition width among the films of different thicknesses. A stable stress change is observed over 10 thermal cycles shown in trend plot for VO2 film of different thicknesses. Difference in thin film stresses and phase transition-induced stress changes are clearly seen in the position and magnitude of stress switching behavior of VO2 film with different thickness. The average values of stress changes and other transition properties are shown in Table I. The transition temperatures (T t) and hysteresis widths (ΔH) for heating and cooling were determined by Gaussian curve fitting to the derivatives of stress–temperature plots. The recoverable stress was determined by the difference between the stress minima and maxima before and after the transition, respectively.
Effect of film thickness on thermally triggered phase transition-induced stress changes studied under thermal cycles shown as (a) stress–temperature plot and (b) trend plots obtained from multiple heating and cooling cycles between 40 and 100 °C.

Phase transition properties of vanadium dioxide are tabulated with different thicknesses of film along with thin film residual stress.
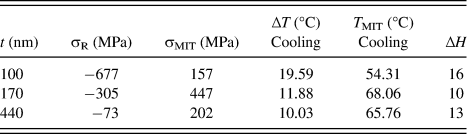
t, film thickness; σ R, residual stress; σ MIT, phase transition-induced stress; ∆T, transition width; T MIT, transition temperature; ∆H, hysteresis.
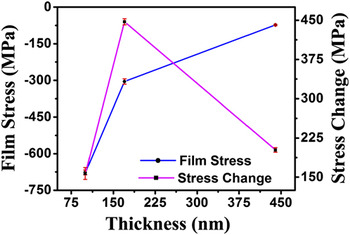
Figure 4 shows the relationship between the grain size/thickness, thin film residual stress, and phase transition-induced stress. The respective thin film residual stresses and stress changes associated with the phase transition are also shown. First, the 100-nm-thin film shows a maximum residual stress of −677 MPa, whereas the 440-nm-thick VO2 film shows residual stress of only −73 MPa. Second, the phase transition-induced stress varies nonmonotonically with film thickness and grain size. The phase transition-induced stress values are 157, 447, and 202 MPa for film thickness of 100, 170, and 440 nm, respectively. This clearly reveals that the phase transition-induced stress change is high at intermediate film thickness and grain size. The poor phase transformation characteristics (low recoverable stress and high transition width) of VO2 film with lowest thickness (100 nm) and grain size (∼41 nm) can be correlated to the grain size effect. It is known that the phase transformation phenomena in solids are greatly altered when the grain size is below a critical size.Reference Waitz, Antretter, Fischer, Simha and Karnthaler13 The electrical and optical properties of VO2 are also affected by the large hysteresis and transition width when the particle size is decreased to few tens of nanometers.Reference Lopez, Feldman and Haglund8, Reference Brassard, Fourmaux, Jean-Jacques, Kieffer and El Khakani10, Reference Dai, Cao, Gao and Luo14 It was argued that fine grain structures lack in number of defective sites that can promote heterogeneous nucleation of the second phase.Reference Lopez, Haynes, Boatner, Feldman and Haglund7, Reference Lopez, Feldman and Haglund8 We note here that the size effect observed in isolated VO2 nanoparticles or embedded nanoparticles in amorphous matrix is different from fine-grained polycrystalline thin films. In addition to the grain size, the contribution of grain boundaries also needs to be considered in heterogeneous nucleation since grain boundaries are potential sites for the nucleation of the transition phase for polycrystalline thin films. For the above reason, the transition temperature of the fine grain-structured (∼41 nm) thin film is relatively lower than the larger grain-structured films in contrast to the size dependence on transition temperature reported for isolated VO2 nanoparticles.Reference Lopez, Haynes, Boatner, Feldman and Haglund7, Reference Lopez, Feldman and Haglund8, Reference Donev, Ziegler, Haglund and Feldman15 Nevertheless, the magnitude of transition and the sharpness of the transition follow a similar size effect with respect to VO2 nanoparticles. Thin film deposited for 240 min (170-nm thick) possesses relatively large grains (∼70 nm) showing high recoverable stress and low transition width compared to VO2 with ultrafine grains. Further increase of thickness (440 nm) and grain size (226 nm) drastically decreases the recoverable stress, which is seen in the stress change–thickness plot shown in Fig. 4. The recoverable stress in this case is almost 55% lesser than the VO2 with uniform fine grains of 70 nm. Constraint effects from neighboring grains is known to reduce the transformation strain in shape memory alloys across the martensitic transition.Reference Ishida and Sato16 Although at low thicknesses (∼100 nm) the critical grain size effect is dominant, the constraint from neighboring grains dominates at higher film thickness (∼440 nm). The grain size effect becomes less significant once the size exceeds ∼70 nm, thereby exhibiting good phase transition characteristics and shows maximum recoverable stress of −447 MPa for the VO2 film of 170-nm thickness. Further increase of film thickness and grain size limits the stress relaxation due to constraint effects introduced by neighboring grains. These two contra effects at low and high thicknesses lead to a nonmonotonous size dependence of stress relaxation across the MIT in VO2 thin films.
Relation between the film thickness, grain size, and phase transition-induced stress changes are shown. Thin film residual stress and phase transition-induced stress changes are plotted against the VO2 film thickness. The mean values with standard deviations obtained from 10 thermal cycles are shown with error bars.

In conclusion, reversible stress change across the MIT varies nonmonotonically with film thickness and grain size in the range investigated here. The transformation stress is found to be maximum (−447 MPa) in VO2 film of ∼170-nm thickness while showing lower recoverable stresses at 100- and 440-nm-film thickness. Microstructural aspects affect the recoverable stress across the MIT in a nonmonotonic manner. These results could be potentially relevant to design VO2-based MEMS and phase-change memory devices.
ACKNOWLEDGMENTS
The authors acknowledge the financial support provided by Focus Center Research Program in the Materials Structures and Devices Focus Center. This work was performed in part at the Center for Nanoscale Systems, Harvard University, a member of the National Nanotechnology Infrastructure Network, which is supported by the National Science Foundation.