INTRODUCTION
Zinc (Zn) is an essential micronutrient for plant nutrition (Broadley et al. Reference Broadley, White, Hammond, Zelko and Lux2007) and human health (Cakmak & Hoffland Reference Cakmak and Hoffland2012). Zinc deficiency is a well-known problem worldwide that causes reduced agricultural productivity. Regions with Zn-deficient soils are also places where there is widespread Zn deficiency in humans (Fageria et al. Reference Fageria, Baligar and Clark2002; Rehman et al. Reference Rehman, Aziz, Faroop, Wakeel and Rengel2012); Zn deficiency adversely affects rice production in many parts of Asia (Zhao et al. Reference Zhao, Lu, Chen, Tian and Yang2011; Rehman et al. Reference Rehman, Aziz, Faroop, Wakeel and Rengel2012). In a comprehensive study, Zn deficiency was found to affect the health of billions of people worldwide, especially in developing countries, where diets are based on cereal grains with very low Zn content (Welch & Graham Reference Welch and Graham2004; Hotz & Brown Reference Hotz and Brown2004; Cakmak et al. Reference Cakmak, Pfeiffer and McClafferty2010). Rice (Oryza sativa L.) is the staple food for more than half of the world's population (Zimmermann & Hurrell Reference Zimmermann and Hurrell2002; Wang et al. Reference Wang, Xue and Li2005; Liang et al. Reference Liang, Han, Han, Nout and Hamer2007) and feeds 0·60 of the population in China. The consumption of cultivated food is one of the most common natural sources of nutrients and microelements for humans. Rice has an inherently low content of Zn in its grain, particularly in plants grown in Zn-deficient soils. In screens of nearly 1000 rice genotypes grown at the International Rice Research Institute (IRRI) farm (Los Baños, Philippines), the grain Zn content ranged from 15·9 to 58·4 mg/kg (Graham et al. Reference Graham, Senadhira, Beebe, Iglesias and Monasterio1999). Based on several reports and survey studies in China, the average content of Zn in grains from various rice varieties was between 10 and 30 mg/kg (Gao et al. Reference Gao, Zou, Zhang, van der Zee and Hoffland2005; Zhang et al. Reference Zhang, Wu and Wang2008). Therefore, increasing the content of Zn in food crops is a growing global challenge with potentially significant implications for both crop production and human health.
Zinc deficiency can be overcome through Zn-tolerant genotypes and management practices relating to soil, water and nutrients. Two strategies that are widely accepted as feasible and sustainable are used to increase Zn contents in grain and other edible plant parts. These are genetic biofortification, i.e. varieties which accumulate high Zn content and are being developed in breeding programmes (Cakmak Reference Cakmak2008), and agronomic methods using appropriate fertilizer management, especially Zn fertilization (Kumar & Qureshi Reference Kumar and Qureshi2012; Tabassum et al. Reference Tabassum, Jeet, Kumar, Dev, Kumar and Rehana2014). Zinc fertilizer is applied directly to the soil or as a foliar spray to correct soil Zn deficiency and improve the Zn content of the edible crop parts. In addition, physical fortification through par-boiling with Zn (Prom-u-thai et al. Reference Prom-u-thai, Rerkasem, Cakmak and Huang2010) and transgenic rice (Vasconcelos et al. Reference Vasconcelos, Datta, Oliva, Khalekuzzaman, Torrizo, Krishnan, Oliveira, Goto and Datta2003) for the enhancement of iron (Fe) and Zn accumulation have been reported.
Zinc deficiency is now considered to be the most widespread micronutrient disorder in lowland rice soils, half of which have shown Zn deficiency (White & Zasoski Reference White and Zasoski1999). In many cases, the application of Zn fertilizer as a basal fertilizer in rice (most typically as zinc sulphate, ZnSO4) at rates of 5–10 kg Zn/ha has been adequate to correct soil Zn deficiency (Qadar Reference Qadar2002). As shown in paddy rice, Zn accumulation in grains mainly originates through Zn uptake by roots after flowering (Verma & Tripathi Reference Verma and Tripathi1983). During grain filling, roots and stems are the primary sources of Zn that is distributed to the grain. However, grain can also accumulate Zn from the leaves, as has also been demonstrated in soybean (Khan & Weaver Reference Khan and Weaver1989), wheat (Pearson & Rengel Reference Pearson and Rengel1995; Zhao et al. Reference Zhao, Lu, Chen, Tian and Yang2011) and aerobic rice (Jiang et al. Reference Jiang, Struik, Lingna, van Keulen, Ming and Stomph2007). It has also been reported recently that grain contents of Zn and Fe could be enhanced by increasing the nitrogen (N) supply and that Zn and N applications have a synergistic effect on the grain Zn content of durum wheat (Kutman et al. Reference Kutman, Yildiz, Ozturk and Cakmak2010; Shi et al. Reference Shi, Zhang, Chen, Sun, Zhang, Römheld and Zou2010).
In the present study, it was proposed that Zn fertilizer application could improve rice grain yield and Zn contents. Changing the Zn fertilizer application method, especially at the right time and with the right products or improving N fertilizer application could increase root uptake, transportation and remobilization of Zn in rice, thereby improving the accumulation of Zn in grain. The major objective of the present study was to evaluate the effects of different N fertilizer application levels, different Zn fertilizer rates and application methods on grain yield and Zn content of rice from Zn-sufficient/potentially deficient flooded rice cultivation systems in Southern China. An additional goal was to provide guidelines and a theoretical basis for the agronomic management of Zn levels in rice grain.
MATERIALS AND METHODS
Experiment design
Description of the experiment fields
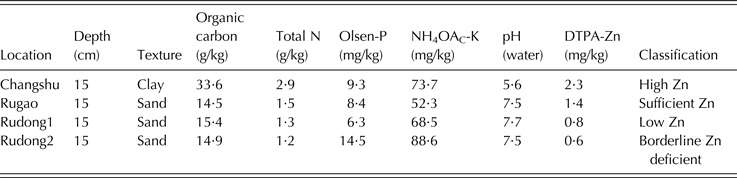
To examine the effect of Zn fertilizer application on rice productivity, four field experiments were carried out from May to November in both 2010 and 2011 in Changshu (31°57′N, 120°63′E, 5 m a.s.l.), Rugao (32°39′N, 120°49′E, 10 m a.s.l.) and Rudong (32°52′N, 120°90′E, 4 m a.s.l.) Counties, Jiangsu Province, China. The fields were located in a rain agro-ecological system used for a wheat–rice rotation, which is were typical of crop production areas in southern China. The rice cultivar ‘Zhendao 11’ (a normal japonica variety), an un-hybridized, round-grained rice with a growth duration of approximately 150 days, widely grown in Southern China, was used in these experiments. Seedlings (20–30 days old) were transplanted on June 20–25 in each year. The rice transplanting intensity was 1·7 × 104 hill/ha, the hill spacing was 28 (row) × 14 (plants) cm, and each hill contained two seedlings in Rugao and Changshu Counties in 2010. In Rudong County in 2011, the rice-transplanting intensity was 1·9 × 104 hill/ha, the hill spacing was 27 (row) × 13 (plants) cm, and each hill contained three seedlings. The plot size was 30 m2 (10 × 3 m). The plots were kept free of weeds by the application of a pre-emergence herbicide and hand weeding after crop establishment. Soil properties are presented in Table 1.
Physical and chemical properties of the basal soil

N, nitrogen; P, phosphorus; NH4OAC, ammonium acetate; DTPA, diethylene triamine pentaacetate acid; Zn, zinc.
Experiments 1 and 2: The effects of zinc application method on rice yield and grain zinc content at high and low nitrogen
To study the effects of Zn application method on rice yield and grain Zn content, two field experiments were conducted from May to November in 2010 in Rugao and Changshu Counties, Jiangsu Province, China. The experiments were designed as split-plot arrangements. The main plots were allocated different N fertilizer rates, i.e. high: 300 kg N/ha (N300) and low: 200 kg N/ha (N200), and then each main plot was split into four sub-plots which were allocated four different Zn fertilizer application methods: 1: CK, Zn-free control; 2: S50, 50 kg Zn/ha (applied to the soil as zinc sulphate heptahydrate (ZnSO4·7H2O)); 3: F24, 24 kg Zn/ha (applied as a foliar application × 2 of 1·3% ZnSO4·7H2O); 4: S50 + F24, 50 kg Zn/ha soil applied +24 kg Zn/ha foliar applied (application to the soil as ZnSO4·7H2O in addition to foliar application × 2 of 1·3% ZnSO4·7H2O). A total of eight treatments were carried out in Expts 1 and 2 and each treatment contained four replicates. In the third and fourth treatments, Zn was applied twice by foliar spray, at the jointing and full flowering stages (growth stages (GS) 34 and 65, respectively, on the BBCH scale; Lancashire et al. Reference Lancashire, Bleiholder, Van Den Boom, Langelüddeke, Stauss, Weber and Witzenberger1991). The concentration was set at 1·3% ZnSO4·7H2O by dissolving ZnSO4·7H2O in tap water (900 litres/ha) containing 0·01% Tween-20 (a leaf surface wetting agent), and the solution was sprayed onto leaves using a knapsack sprayer. At the same time, the first and second treatments were foliar-sprayed with the same volume of tap water containing 0·01% Tween-20. The time of foliar applications was in the afternoon near dusk or on a cloudy afternoon without wind. All of the P (phosphorus pentoxide (P2O5)), 75 kg/ha as calcium dihydrogen phosphate (Ca(H2PO4)2), K (potassium oxide (K2O)) 120 kg/ha as potassium chloride (KCl), 40% of the N (as urea) and Zn (applied to the soil) fertilizers were evenly blended with the soil before transplanting. Of the remaining N fertilizer, 30% was applied at the three tillers detectable stage (GS 23), and the remaining 30% was applied at the jointing stage (GS 34).
Experiments 3 and 4: The effects of zinc application level and method on rice yield and grain zinc content
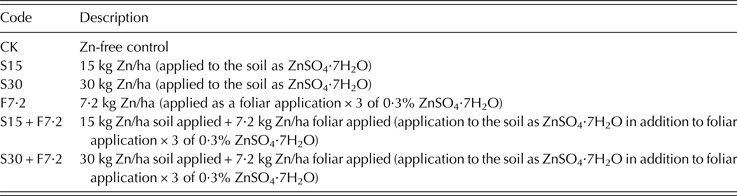
To study the effects of Zn application level and method on rice yield and grain Zn content, two similar field experiments were conducted from May to November in 2011 in Rudong County, Jiangsu Province, China. The experiments were arranged in a split-plot design. The main plots were treated with two Zn fertilizer application methods, i.e. soil application (S) and foliar spay (F), and then each main plot was split into three sub-plots which were treated with three different Zn fertilizer levels (soil application of 0 (CK), 15 (S15) and 30 (S30) kg ZnSO4·7H2O/ha). A total of six treatments are presented in Table 2. Each treatment contained four replicates. The foliar spray of ZnSO4·7H2O was applied three times, during the max-tillering, jointing and full flowering stages (GS 29, 34 and 65, respectively). The 0·3% ZnSO4·7H2O solution was obtained (as described above) by dissolving ZnSO4·7H2O in tap water (800 litres/ha) with 0·01% Tween-20. At each application, the treatments without Zn were foliar-sprayed with the same volume of tap water containing 0·01% Tween-20. The applications of N (200 kg/ha as urea), P (P2O5 75 kg/ha as Ca(H2PO4)2), K (K2O 120 kg/ha as KCl) and Zn fertilizer in soil were performed similarly to the applications in Expts 1 and 2.
Total of six treatments of the Experiment 3 and 4
Measurements
During the maturation stage, three hills of rice plants were sampled and dissected into leaves, stems (including leaf sheaths) and spikes for mineral analysis. Additionally, a 5 m2 (5·0 m × 1·0 m) micro-plot was harvested to determine the grain yield and other yield components. All of the samples were collected from the centre of each plot to avoid edge effects and were washed briefly with both tap and distilled water.
Mineral analysis
The dry weights of all rice plant samples (leaves, stems and spikes) were determined after heating in an oven at 105 °C for 30 min and then at 70 °C until they reached a constant weight. The grain yield was determined from a 5 m2 area at maturity after adjusting the grain to a moisture content of 0·15 g H2O/g fresh weight. For mineral analysis, the grain sample was brown rice. For Zn analysis, the dry samples were ground into a powder and then digested in nitric:perchloric acid (4:1 v/v). The methodologies applied in these experiments have been described previously by Waters et al. (Reference Waters, Uauy, Dubcovsky and Grusak2009). Zinc content was determined using an Atomic Absorption Spectrophotometer (Varian, SpectrAA-220FS, American) at a wavelength of 213·9 nm. For the determination of N content, dried and ground samples were digested with H2SO4–H2O2 at 260–270 °C and an Autoanalyzer 3 digital colorimeter (Bran + Luebbe, AA3, Germany) was used to determine the total N content according to the method of Guo et al. (Reference Guo, Chen, Zhou and Shen2007). The measurements were checked using certified standard reference materials obtained from the Institute for Environmental Reference Materials of the Ministry of Environmental Protection (Beijing, China).
Diphenylthiocarbazone staining
To visually assess the Zn content of brown grains under different Zn fertilizer application methods, a staining method was developed using diphenylthiocarbazone (DTZ), which produces a red-purple Zn-dithizonate complex (Ozturk et al. Reference Ozturk, Yazici, Yucel, Torun, Cekic, Bagci, Ozkan, Braun, Sayers and Cakmak2006). The brown grains were submerged for 30 min in freshly prepared DTZ solution, obtained by dissolving 1,5-diphenylthiocarbazone (Merck) (500 mg/l) in methanol (AR grade), as described previously by Ozturk et al. (Reference Ozturk, Yazici, Yucel, Torun, Cekic, Bagci, Ozkan, Braun, Sayers and Cakmak2006). After 30 min submersion, the samples were rinsed thoroughly with distilled, deionized water and blotted dry with tissue paper. The staining intensity (red colour), representing the relative Zn density in the grains, was assessed using an optical microscope (Olympus, DFM-50, Japan).
Statistical analysis
All of the data were analysed with the SAS 9.3 statistical software package. The significance and the interactions between the treatments were evaluated by one-, two- or multi-way ANOVA according to the experimental design, following which the significant differences between means were determined using Duncan's multiple range test (Duncan's test) at P < 0·05.
RESULTS
Four locations were selected due to their differences in soil Zn status. The amounts of diethylene triamine pentacetate acid (DTPA) extractable Zn ranged from 0·60 mg Zn/kg in Rudong County to 2·32 mg Zn/kg in Changshu County, Jiangsu, China (Table 1). A threshold for Zn deficiency is widely accepted to be 0·5 mg Zn/kg, which was established from the standard DTPA method (Sims & Johnson Reference Sims, Johnson, Mortvedt, Cox, Shuman and Welch1991). Based on the data, the four locations were classified as borderline Zn-deficient (Rudong 2), low Zn (Rudong 1), sufficient Zn (Rugao) and high Zn (Changshu) (Table 1).
The effect of location and zinc application level on the grain yield and zinc content of rice
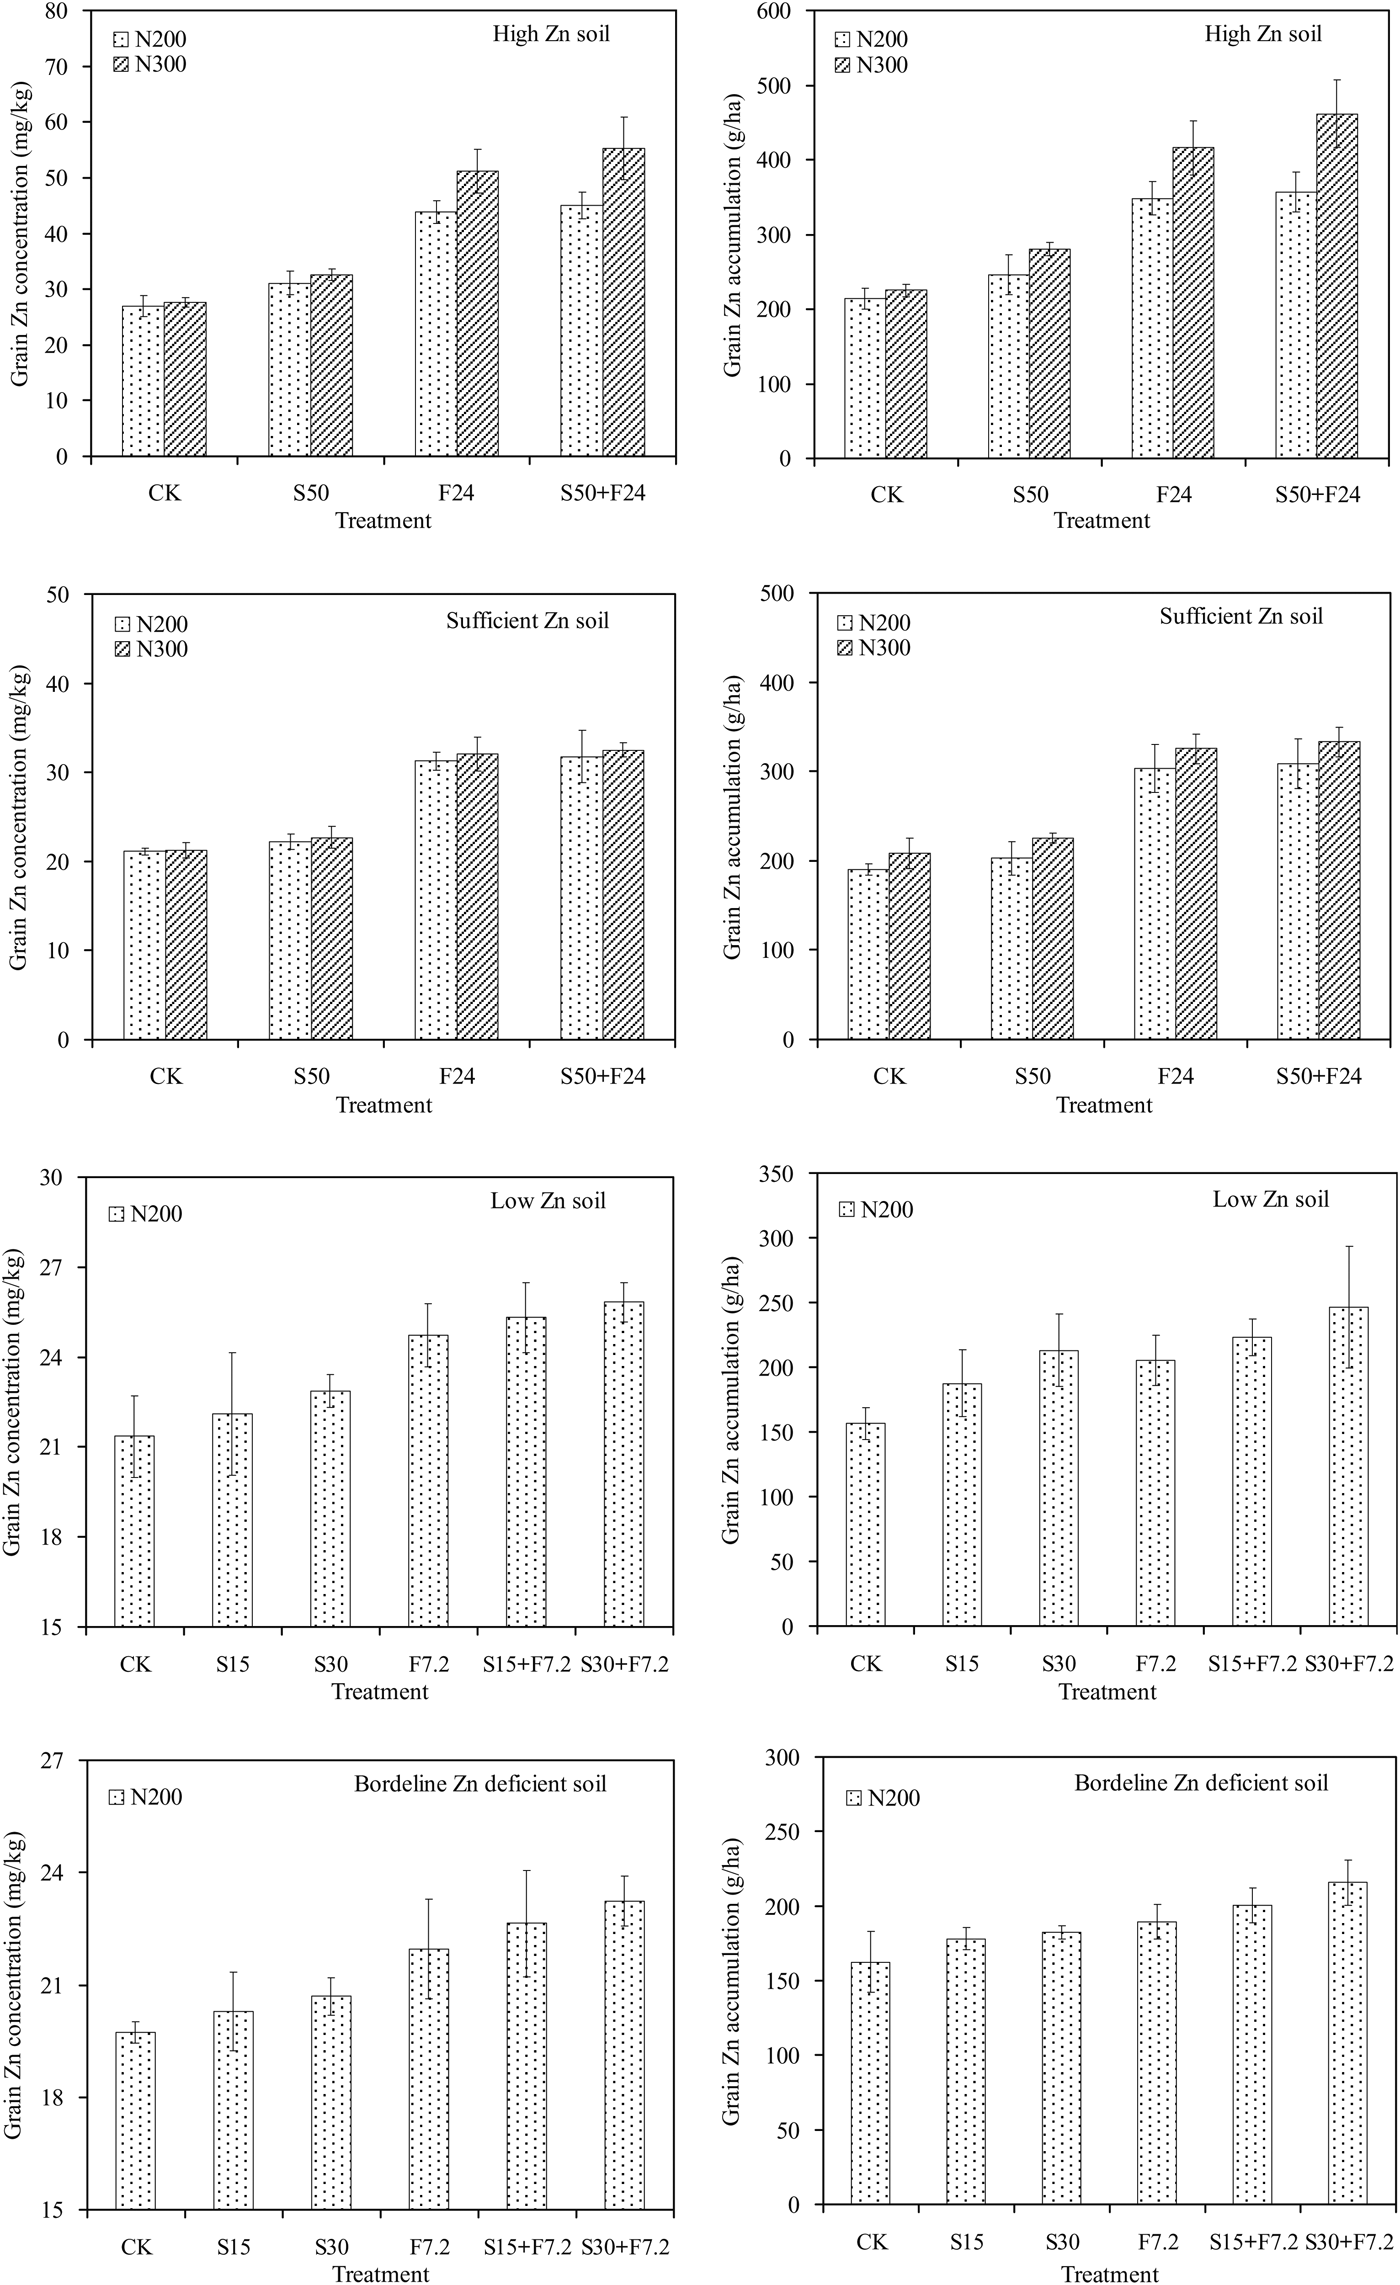
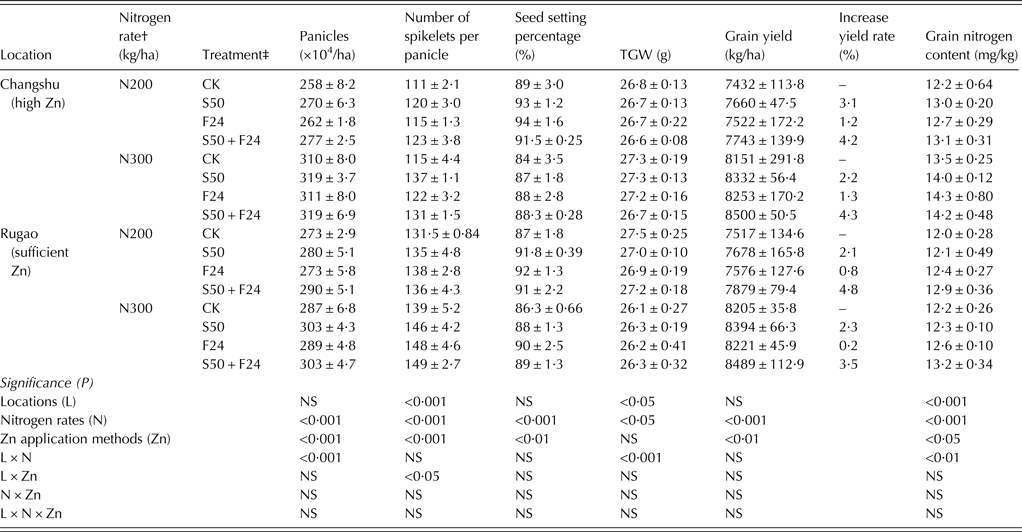
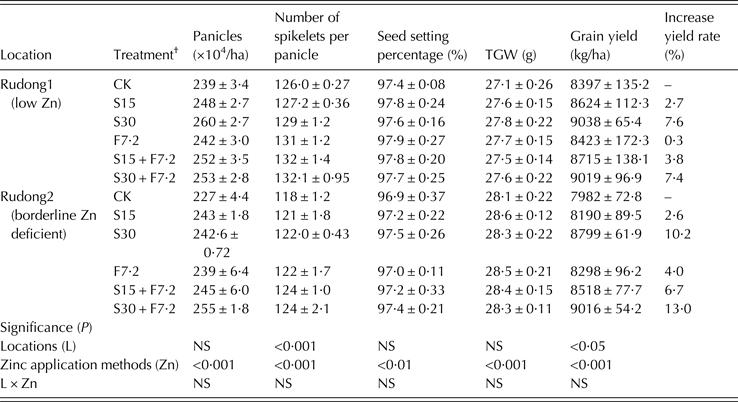
Four field experiments were conducted at four different locations in two consecutive years (2010 and 2011). There was a significant positive effect of Zn application on grain yield and rice Zn content in each year (Tables 2 and 3; Fig. 1). Additionally, the effect of Zn application on grain yield was limited by location, indicating that the increase in yield was affected by the background content of soil-available Zn. The grain yield increased significantly with increasing Zn application rate in low and borderline Zn-deficient soils in 2011 (Rudong location). However, in the previous year, the yields at Changshu and Rugao were significantly different (P < 0·01) for each Zn treatment with high and sufficient background Zn status of these soils (Table 3). There was a clear correlation between grain yield and yield components among the different Zn treatments. The yield components (panicle number, number of spikelets per panicle, seed setting percentage and thousand grain weight (TGW)) increased with an increase in Zn application level (Table 4) and were also associated with soil Zn-associated DTPA (DTPA-Zn) level. For all of the parameters, the values varied under different Zn fertilizer application treatments; however, all values were higher than the Zn-free control treatment.
Effects of soil zinc (Zn) status (high, sufficient, low and borderline Zn-deficient soils) and Zn fertilizer application method (CK = Zn-free control; S50 = 50 kg Zn/ha (applied to the soil as ZnSO4·7H2O); F24 = 24 kg Zn/ha (applied as a foliar application × 2 of 1·3% ZnSO4·7H2O); S50 + F24 = 50 kg Zn/ha soil applied + 24 kg Zn/ha foliar applied (application to the soil as ZnSO4·7H2O in addition to foliar application × 2 of 1·3% ZnSO4·7H2O); S15 = 15 kg Zn/ha (applied to the soil as ZnSO4·7H2O); S30 = 30 kg Zn/ha (applied to the soil as ZnSO4·7H2O); F7·2 = 7·2 kg Zn/ha (applied as a foliar application × 3 of 0·3% ZnSO4·7H2O); S15 + F7·2 = 15 kg Zn/ha soil applied + 7·2 kg Zn/ha foliar applied (application to the soil as ZnSO4·7H2O in addition to foliar application × 3 of 0·3% ZnSO4·7H2O); S30 + F7·2 = 30 kg Zn/ha soil applied + 7·2 kg Zn/ha foliar applied (application to the soil as ZnSO4·7H2O in addition to foliar application × 3 of 0·3% ZnSO4·7H2O)) on grain Zn content and accumulation of the ‘Zhendao 11’ rice crop under different N rates (N200 = 200 kg N/ha; N300 = 300 kg N/ha) in 2010–2011. Each data point represents the mean value of four replicates. Bars represent the standard errors of the mean (n = 4).
Effect of nitrogen fertilizer rate and zinc fertilizer application method on yield and yield components of the Zhendao 11 rice crop in 2010. The values are the means of four independent replicates*
Zn, zinc; NS, not significant.
* Significant differences were determined according to a multi-way ANOVA followed by Duncan's multiple range test.
† N200 = 200 kg N/ha; N300 = 300 kg N/ha.
‡ CK = Zn-free control; S50 = 50 kg Zn/ha (applied to the soil as ZnSO4·7H2O); F24 = 24 kg Zn/ha (applied as a foliar application × 2 of 1·3% ZnSO4·7H2O); S50 + F24 = 50 kg Zn/ha soil applied +24 kg Zn/ha foliar applied (application to the soil as ZnSO4·7H2O in addition to foliar application × 2 of 1·3% ZnSO4·7H2O).
Effects of zinc fertilizer rate and application method on yield and yield components of the Zhendao 11 rice crop in 2011. The values are the means of four independent replicates*
NS, not significant.
* Significant differences were determined according to a two-way ANOVA followed by Duncan's multiple range test.
† CK = Zn-free control; S15 = 15 kg Zn/ha (applied to the soil as ZnSO4·7H2O); S30 = 30 kg Zn/ha (applied to the soil as ZnSO4·7H2O); F7·2 = 7·2 kg Zn/ha (applied as a foliar application × 3 of 0·3% ZnSO4·7H2O); S15 + F7·2 = 15 kg Zn/ha soil applied + 7·2 kg Zn/ha foliar applied (application to the soil as ZnSO4·7H2O in addition to foliar application × 3 of 0·3% ZnSO4·7H2O); S30 + F7·2 = 30 kg Zn/ha soil applied + 7·2 kg Zn/ha foliar applied (application to the soil as ZnSO4·7H2O in addition to foliar application × 3 of 0·3% ZnSO4·7H2O).
The statistical analysis of the data from 2010/11 revealed a clear location effect. This is illustrated by the observation that the grain Zn content with a given N rate (i.e., 200 kg/ha) ranged from 19·74 mg/kg in the borderline Zn-deficient soil to 26·93 mg/kg in the high Zn soil in the Zn-free treatment (Fig. 1). However, the Zn fertilizer application method had a much larger effect than location and was the dominant factor in determining Zn content and accumulation in the grain (Fig. 1). Furthermore, no significant interactions between Zn fertilizer treatments and locations were observed.
Effects of zinc fertilizer application method on rice grain yield and grain zinc content
The method of Zn application also exhibited an obvious influence on grain yield and yield components, grain Zn content and accumulation, and Zn fertilizer efficacy. The results at each experimental location showed that soil Zn application had a much greater effect on rice grain yield than application by foliar spray (Tables 2 and 3). Comparing all yields with that of the control, the average increase in grain yield from soil Zn application ranged from 2·1 to 10·2% and 0·2 to 4·0% in the foliar application (Tables 2 and 3). It was concluded that the soil Zn application contributed to the increase in grain yield more than the foliar spray based on an increase in the number of developed spikes. Compared with the control treatment, under the same N fertilizer level (200 kg N/ha), grain Zn content increased by 62·7 and 48·3% from F24 and by 15·6 and 5·3% from S50 in the high Zn and Zn sufficient soils, respectively. Additionally, grain Zn content increased by 15·7 and 11·3% from F7·2 and by 3·5 and 2·9% from S15 in low Zn and borderline Zn-deficient soils, respectively. Therefore, to improve the grain Zn content, the Zn foliar spray was more effective than the soil application, and a high Zn content of foliar spray (F24) was more effective than a low Zn content (F7·2). However, the method of soil Zn application plus a Zn foliar spray was the best method for increasing grain yield and grain Zn content.
The Zn content of the brown grain from the field experiment with the high Zn soil (Changshu) under different Zn application methods was detected by staining with DTZ (Fig. 2). Zinc reacts with DTZ to form a red Zn–DTZ complex. The intensity of staining (red colour) represents the relative density of Zn in the grain and the results were consistent with the mineral analysis of Zn content (Fig. 1).
Brown rice grains from different zinc (Zn) application methods with diphenylthiocarbazone staining under 300 kg N/ha in Changshu site. (a: CK = Zn-free control; S50 = 50 kg Zn/ha (applied to the soil as ZnSO4·7H2O); F24 = 24 kg Zn/ha (applied as a foliar application × 2 of 1·3% ZnSO4·7H2O); S50 + F24 = 50 kg Zn/ha soil applied + 24 kg Zn/ha foliar applied (application to the soil as ZnSO4·7H2O in addition to foliar application × 2 of 1·3% ZnSO4·7H2O). b: CK = The ‘−’ symbol indicates grain DTZ staining in the Zn-free control; S50 = The ‘+’ symbol indicates grain DTZ staining in the 50 kg Zn/ha (applied to the soil as ZnSO4·7H2O); F24 = The ‘+’ symbol indicates grain DTZ staining in the 24 kg Zn/ha (applied as a foliar application × 2 of 1·3% ZnSO4·7H2O), picture upper right.) (Colour online).
Interaction of the effects of nitrogen and zinc fertilizers on rice grain
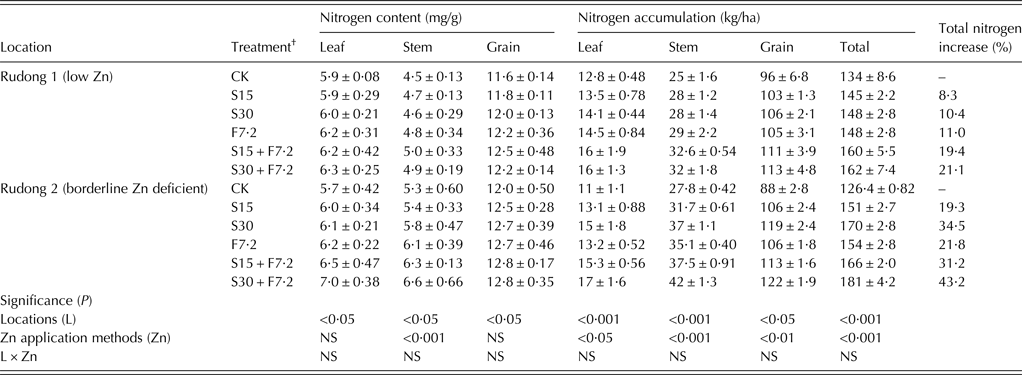
A clear positive interaction between N and Zn fertilizers on rice grain yield and nutrient content was demonstrated under the experimental conditions. The increased N application rate had a significant effect on the grain yield of rice in 2010 (Table 3). Furthermore, it was observed that the grain Zn content and accumulation increased slightly when the N fertilizer rate increased from 200 to 300 kg/ha; however, these two N fertilizer treatments were not significantly different (Fig. 1). The effect of Zn application on the grain nutrient content also showed that the increase of Zn fertilizer could significantly increase the N content and accumulation in individual plant organs at harvest (Table 5). There was a very close correlation between Zn and N content in rice grain (Figs 3 and 4).
Relationship between nitrogen (N) and zinc (Zn) contents of rice grains under two different N rates (N200 = 200 kg N/ha; N300 = 300 kg N/ha).
Relationship between nitrogen and zinc (Zn) contents of rice grains under two different soil Zn statuses (low Zn or borderline Zn-deficient soils).
Effects of zinc fertilizer rate and application method on nitrogen content and accumulations in leaves, stems and grains of rice at harvest in 2011. The values are the means of four replicates*
NS, not significant.
* Significant differences were determined according to a two-way ANOVA followed by Duncan's multiple range test.
† CK = Zn-free control; S15 = 15 kg Zn/ha (applied to the soil as ZnSO4·7H2O); S30 = 30 kg Zn/ha (applied to the soil as ZnSO4·7H2O); F7·2 = 7·2 kg Zn/ha (applied as a foliar application × 3 of 0·3% ZnSO4·7H2O); S15 + F7·2 = 15 kg Zn/ha soil applied + 7·2 kg Zn/ha foliar applied (application to the soil as ZnSO4·7H2O in addition to foliar application × 3 of 0·3% ZnSO4·7H2O); S30 + F7·2 = 30 kg Zn/ha soil applied + 7·2 kg Zn/ha foliar applied (application to the soil as ZnSO4·7H2O in addition to foliar application × 3 of 0·3% ZnSO4·7H2O).
DISCUSSION
Biofortification is the process of increasing the natural content of bioavailable nutrients in crop plants (Welch Reference Welch2005; White & Broadley Reference White and Broadley2005; Nestel et al. Reference Nestel, Bouis, Meenakshi and Pfeiffer2006; Mayer et al. Reference Mayer, Pfeiffer and Beyer2008). The Zn biofortification of cereals has been a focus of research and is becoming more important for crops and humans in recent years. It has recently been reported that grain yield and Zn content could be enhanced by Zn fertilizer application either to the soil or by foliar spray in rice (Hossain et al. Reference Hossain, Jahiruddin, Islam and Mian2008; Wissuwa et al. Reference Wissuwa, Ismail and Graham2008; Singh et al. Reference Singh, Manibhushan, Meena and Upadhyaya2012), wheat (Shivay et al. Reference Shivay, Kumar and Prasad2008), maize and mung bean (Hossain et al. Reference Hossain, Jahiruddin, Islam and Mian2008).
To study the effects of different Zn fertilizer rates and application methods on Zn uptake, translocation and accumulation of grain Zn in rice, four field experiments were conducted in two consecutive years (2010/11). These experiments suggest that, in four soils with different Zn availabilities in Southern China, the grain yield of rice can be improved by increasing Zn application rate and by employing appropriate application methods. The yield components (panicles, number of spikelets per panicle, etc.) increased significantly with Zn application. Sui et al. (Reference Sui, Feng, Tian, Hu, Shen and Guo2013) reported that an effective spike number was the principal factor and that the number of spikelets per panicle and the TGW were second in importance with regard to effects on rice yield. In contrast, the current results showed that soil Zn application at transplanting has a much more significant effect on rice grain yield than foliar spray during the spike emergence to flowering stages. This observation results from the greater number of spikes per unit area in the soil Zn treatment than in the treatment with Zn foliar spray. As the tiller number is completely established at spike emergence in rice, the Zn nutrition improvement caused by the foliar spray at the mid-growth period could only contribute to an increase in tiller and panicle characteristics. The improvement of grain yield by Zn fertilizer application differed with soil DTPA-Zn content at the different experimental locations, and the improvements from Zn fertilizer application were more noticeable in soils with low background levels of DTPA-Zn. However, there was no significant effect on rice grain yield from Zn fertilizer application to soils with high or sufficient background levels of DTPA-Zn. The present work was based on locations with different background levels of DTPA-Zn, rather than an independent experiment conducted in an independent location with a single DTPA-Zn level. Therefore, the current results evaluate the improvement of rice grain yield from Zn fertilizer application objectively and systemically.
At the same time, there was a clear improvement in grain Zn content and accumulation in rice with Zn fertilizer application. The effects of Zn fertilizer were different with different Zn application methods, and these results demonstrated that Zn foliar spray was more effective than soil application on grain Zn content and accumulation. The different native soil pH, zinc availabilities and N fertilizer rates could also play a critical role on the effect of Zn application on rice. Marschner (Reference Marschner and Marschner1993) reported that an increase in the soil pH value from 6 to 7 could reduce the chemical solubility of Zn in the soil by nearly 30-fold and that a split application of ZnSO4 could perform better than a single basal application. This could be attributed to the improved availability of Zn in the soil solution for rice plants (Naik & Das Reference Naik and Das2008) or to the elimination of the rapid dissociation of Zn2+ from ZnSO4 resulting in the precipitation of Zn as ZnCO3 and Zn5(CO3)2(OH)2 (Brar & Sekhon Reference Brar and Sekhon1976). These results were similar to those of the present study; the effects of Zn application on rice were more pronounced in the meta-acidic soil (pH 5·60; Changshu) than in the meta-alkaline soil (pH 7·54; Rugao), and the soil DTPA-Zn content was consistent with this result in the two soils at different pH values. Wissuwa et al. (Reference Wissuwa, Ismail and Graham2008) suggested that Zn uptake was increased by soil Zn fertilizer application and that Zn accumulated in the shoot tissue, with little translocation to the grain. Although the soil Zn application did not obviously impact the rice grain Zn content, the Zn foliar spay did. In addition, the rice grain Zn content increased with the increase in Zn content or fortification rate resulting from the Zn foliar spray. In recent reports, surfactants can increase the penetration of many substances through the leaf cuticle (Stock & Holloway Reference Stock and Holloway1993), and therefore are frequently added to foliar sprays. This addition could explain the greater biological availability of Zn supplied via foliar spray: it is taken up directly into the plant tissue, whereas in the roots it has to be taken up in soluble form and so is dependent on soil moisture. In addition, as the foliar Zn application rates were significantly less than the soil Zn rates and the journey from the soil to grain is much further than from leaf to grain, the foliar application of Zn seems to be an important alternative strategy to overcome grain Zn deficiency in cereal plants and will contribute to the improved nutritional quality of grain for human consumption (Wissuwa et al. Reference Wissuwa, Ismail and Graham2008; Cakmak et al. Reference Cakmak, Pfeiffer and McClafferty2010).
Although the routine grain yield increase with application of fertilizers, especially N fertilizers, is well-established (Ehdaie & Waines Reference Ehdaie and Waines2001), the effect of N fertilizer on the Zn nutritional quality of rice grain is not well understood. The current experiments indicated that the N application rate greatly affects grain yield and the Zn content of rice grain. The results were similar to those reported by Hao et al. (Reference Hao, Wei, Yang, Feng and Wu2007), who found in a pot experiment that the N application rates of up to 160 kg N/ha could increase the Fe, Mn, Cu and Zn contents in brown rice. Shi et al. (Reference Shi, Zhang, Chen, Sun, Zhang, Römheld and Zou2010) reported that wheat grain Zn content increased continually with increasing N rate in long-term (1999–2007) field experiments in the North Plain of China. It was possible that the content of a micronutrient in the grain could increase with increasing N application rate until reaching a critical N rate, at which point it would stop increasing and remain at a steady level (Hao et al. Reference Hao, Wei, Yang, Feng and Wu2007; Shi et al. Reference Shi, Zhang, Chen, Sun, Zhang, Römheld and Zou2010). Because there were only two N application rates in the field experiments of the current, it was impossible to identify this critical rate. In addition, the current results showed that the N content and accumulation in individual rice organs increased at harvest with increasing Zn rates. The combination of these results illustrates a clear positive interaction between N and Zn fertilizers for the improvement of rice grain yield and nutrient content: the higher N could enhance crop growth and increase the demand for micronutrients. In addition, the supply of Zn fertilizer could also enhance the demand and uptake of other nutrients over Zn-deficient conditions. Although the relationship between N and Zn in the plants is unclear, many studies have indicated that N influences the translocation of Zn in plants. Erenoglu et al. (Reference Erenoglu, Kutman, Ceylan, Yildiz and Cakmak2011) reported that improved N nutrition enhanced the root uptake, root-to-shoot translocation and remobilization of zinc (65Zn) in wheat. Finkemeier et al. (Reference Finkemeier, Kluge, Metwally, Georgi, Grotjohann and Dietz2003) discovered that the expression of a heavy metal transport-related gene was N-dependent in barley. Most likely, a number of transport proteins, such as zinc-regulated transporter/Fe-regulated transporter-like proteins (ZIP), yellow stripe-like (YSL) transporters and heavy metal ATPase (HMA) family proteins, can be implicated in the root uptake, xylem loading and unloading, xylem-to-phloem exchange, phloem loading and unloading and grain deposition of Zn or nicotianamine (NA)-chelated Zn (Waters et al. Reference Waters, Chu, DiDonato, Roberts, Eisley, Lahner, Salt and Walker2006; Haydon & Cobbett Reference Haydon and Cobbett2007; Borg et al. Reference Borg, Brinch-Pedersen, Tauris and Holm2009; Curie et al. Reference Curie, Cassin, Couch, Divol, Higuchi, le Jean, Misson, Schikora, Czernic and Mari2009; Palmer & Guerinot Reference Palmer and Guerinot2009; Pedas et al. Reference Pedas, Schjoerring and Husted2009). The synthesis of some unknown proteins could be enhanced by increasing tissue N content with the application of N fertilizer. Furthermore, in recent reports, positive physiological effects were clearly documented, showing that Zn significantly affected the biosynthesis and structural and functional integrity of proteins (Cakmak Reference Cakmak2000; Broadley et al. Reference Broadley, White, Hammond, Zelko and Lux2007). Many proteins in biological systems are Zn-dependent. For example, in eukaryotic cells, Zn-binding proteins make up nearly 10% of the proteome (Andreini et al. Reference Andreini, Banci, Bertini and Rosato2006). It has been reported that proteins in grain are considered to be a pool for Zn, and, under Zn-sufficient conditions, there was a strong positive correlation between grain Zn content and grain N content (Cakmak et al. Reference Cakmak, Pfeiffer and McClafferty2010; Kutman et al. Reference Kutman, Yildiz, Ozturk and Cakmak2010). Therefore, the present results suggest that the balance of Zn content or accumulation in rice grain might be increased by the suitable application of N fertilizer based on the optimal yield and economic/environmental efficiency.
In the present work, the Zn content of the brown grain could be detected by staining with DTZ, and the staining intensity (red colour) was consistent with the results of the mineral analysis of Zn. These results further confirmed that the DTZ method is useful in studying the content, localization and mobilization of Zn in seeds, and can be applied as a rapid method for ranking genotypes for seed Zn content (Ozturk et al. Reference Ozturk, Yazici, Yucel, Torun, Cekic, Bagci, Ozkan, Braun, Sayers and Cakmak2006).
In conclusion, the results of the present study have proposed reasonable methods for both soil and foliar spray applications of Zn fertilizer to increase rice grain yield and grain Zn content. The effects of Zn application varied according to native soil Zn availability, N fertilizer rate and Zn fertilizer application method. The grain yield increased significantly with increasing Zn fortification rates in low Zn or Zn-deficient soils. Zinc application method also exhibited a significant influence on grain yield. Soil Zn application displayed a much greater improvement on rice grain yield compared with foliar application; however, the Zn foliar spray was much more effective at increasing the grain Zn content than the soil Zn application. Additionally, the impact of Zn application method with regard to grain Zn content revealed the following trend: soil application + foliar spay > foliar spay > soil application > control. Furthermore, these results could be increased by a high rate of N application. Therefore, it is suggested that soil Zn application in addition to a Zn foliar spray should be considered an important alternative strategy to overcome Zn deficiency of rice in soils with low background levels of DTPA-Zn. Additionally, this strategy of using both soil and foliar spray for Zn fertilizer application rather than either one alone can optimize Zn management for a variety of soil Zn contents for which it may be necessary to improve both the grain yield and grain Zn content. However, much more attention should be given to the interaction between N and Zn fertilizer to adjust fertilization practices.
The present study was financially supported by the Special Fund for Agriculture Profession of China (grant no. 201103003), the National Natural Science Foundation of China (grant no.41071160), the HarvestPlus Programme (www.harvestplus.org), the International Zinc Association Project (Zinc Nutrient Initiative MD-86) and the Jiangsu Agriculture Science and Technology Innovation Fund (JASTIF), CX(12)3037. The authors are grateful to Prof Zou Chunqin of China Agricultural University for assistance with the experimental design, and also to Professor Zhou Yi of Anhui Science and Technology University for the very valuable comments and suggestions on the manuscript. Excellent technical support in the field experiments was provided by the Institute of Agriculture Science Research at Rugao County and the Technology Instructions Station of Soil and Fertilizer at Rudong County, Jiangsu.