1 Introduction
Melting of mantle rock fuels volcanism in Hawaii and Iceland, as well as along the plate-tectonic boundaries where oceanic plates spread apart. Typically, this melt is understood to come from mantle decompression: as the solid rock slowly upwells, it experiences decreasing pressure, which lowers its solidus temperature and drives quasi-isentropic melting (Ramberg Reference Ramberg1972; Asimow, Hirschmann & Stolper Reference Asimow, Hirschmann and Stolper1997). The magma produced in this way segregates from its source and rises buoyantly through the interconnected pores of the polycrystalline mantle (McKenzie Reference McKenzie1984). The equilibrium chemistry of magma is a function of pressure. Rising magma, produced in equilibrium with the mantle, becomes undersaturated in a component of the mantle as it ascends (O’Hara Reference O’Hara1965; Stolper Reference Stolper1980; Elthon & Scarfe Reference Elthon and Scarfe1984). The magma reacts with adjacent solid mantle grains, and the result is a net increase in liquid mass (Kelemen Reference Kelemen1990). This reactive melting (or, equivalently, reactive dissolution) augments decompression melting. The corrosivity of vertically segregating melt is thought to promote localization into high-flux magmatic channels (Quick Reference Quick1982; Kelemen, Dick & Quick Reference Kelemen, Dick and Quick1992; Kelemen, Shimizu & Salters Reference Kelemen, Shimizu and Salters1995a ). These probably correspond to zones observed in exhumed mantle rock where all soluble minerals have been replaced with olivine (Kelemen, Braun & Hirth Reference Kelemen, Braun and Hirth2000; Braun & Kelemen Reference Braun and Kelemen2002). Such channelized transport has important consequences for magma chemistry (Spiegelman & Kelemen Reference Spiegelman and Kelemen2003) and, in particular, may explain the observed chemical disequilibrium between erupted lavas and the shallowest mantle (Kelemen et al. Reference Kelemen, Shimizu and Salters1995a ; Braun & Kelemen Reference Braun and Kelemen2002). Laboratory experiments at high temperature and pressure confirm that magma–mantle interactions can lead to a channelization instability (Pec et al. Reference Pec, Holtzman, Zimmerman and Kohlstedt2015, Reference Pec, Holtzman, Zimmerman and Kohlstedt2017). Here, we analyse a simplified model of this system to better understand the character of the instability.
The association of reactive flow with channelization was established by early theoretical work that considered a corrosive aqueous fluid propagating through a soluble porous medium (Hoefner & Fogler Reference Hoefner and Fogler1988; Ortoleva Reference Ortoleva1994, and references therein). A general feature of porous media is that permeability increases with porosity. If an increase of fluid flux enhances the dissolution of the solid matrix, increasing the porosity, then a positive feedback ensues. This drives a channelization instability, in either the presence or absence of a propagating reaction front (Szymczak & Ladd Reference Szymczak and Ladd2012, Reference Szymczak and Ladd2013, Reference Szymczak and Ladd2014). Aharonov et al. (Reference Aharonov, Whitehead, Kelemen and Spiegelman1995) adapted the previous theory to model reactive magmatic segregation. In their adaptation, two key differences from earlier work arise. The first is that reaction is not limited to a moving front (as in, for example, Hinch & Bhatt Reference Hinch and Bhatt1990), but rather occurs pervasively within the domain. The second is that mantle rocks are ductile and undergo creeping flow in response to stress. This includes isotropic compaction, whereby grains squeeze together and the interstitial melt is expelled (or vice versa). Equations governing the mechanics of partially molten rock were established by McKenzie (Reference McKenzie1984). We will see that the compaction of the solid phase plays a crucial role in modifying and even stabilizing the instability, and so this is a key aspect of our study.
Aharonov et al. (Reference Aharonov, Whitehead, Kelemen and Spiegelman1995) obtained numerical results showing the systematic dependence on reaction rate (Damköhler number) and diffusion rate (Péclet number), but did not consider the covariation of these parameters. They obtained numerical results indicative of the effect of compaction when the stiffness parameter, defined in our § 2.2, is
 $O(1)$
. However, they did not present scalings when the stiffness parameter is much smaller than 1, which is an interesting and geologically relevant regime. Spiegelman, Kelemen & Aharonov (Reference Spiegelman, Kelemen and Aharonov2001) performed two-dimensional numerical calculations of the instability and used a similar analysis to Aharonov et al. (Reference Aharonov, Whitehead, Kelemen and Spiegelman1995) to interpret the results. Hewitt (Reference Hewitt2010) considered the reaction-infiltration instability in the context of thermochemical modelling of mantle melting. The problem was again considered by Hesse et al. (Reference Hesse, Schiemenz, Liang and Parmentier2011), but their focus was mostly on an instability to compaction–dissolution waves, which were first studied by Aharonov et al. (Reference Aharonov, Whitehead, Kelemen and Spiegelman1995). While interesting theoretically, there is no geological evidence for these waves. Schiemenz, Liang & Parmentier (Reference Schiemenz, Liang and Parmentier2011) performed high-order numerical calculations of channelized flow in the presence of sustained perturbations at the bottom of the domain.
In the present paper, we describe the physical problem and its mathematical expression (§ 2), perform a linear stability analysis and give numerical solutions (§ 3), and, by asymptotic analysis, elucidate the control of physical processes (§ 4). The asymptotics provide scalings that are difficult to obtain numerically. They hence allow us to explore a broader parameter space, crucially including the regime in which compaction is significant. Finally, we discuss the geological implications of our analysis (§ 5).
2 Governing equations
2.1 Dimensional equations
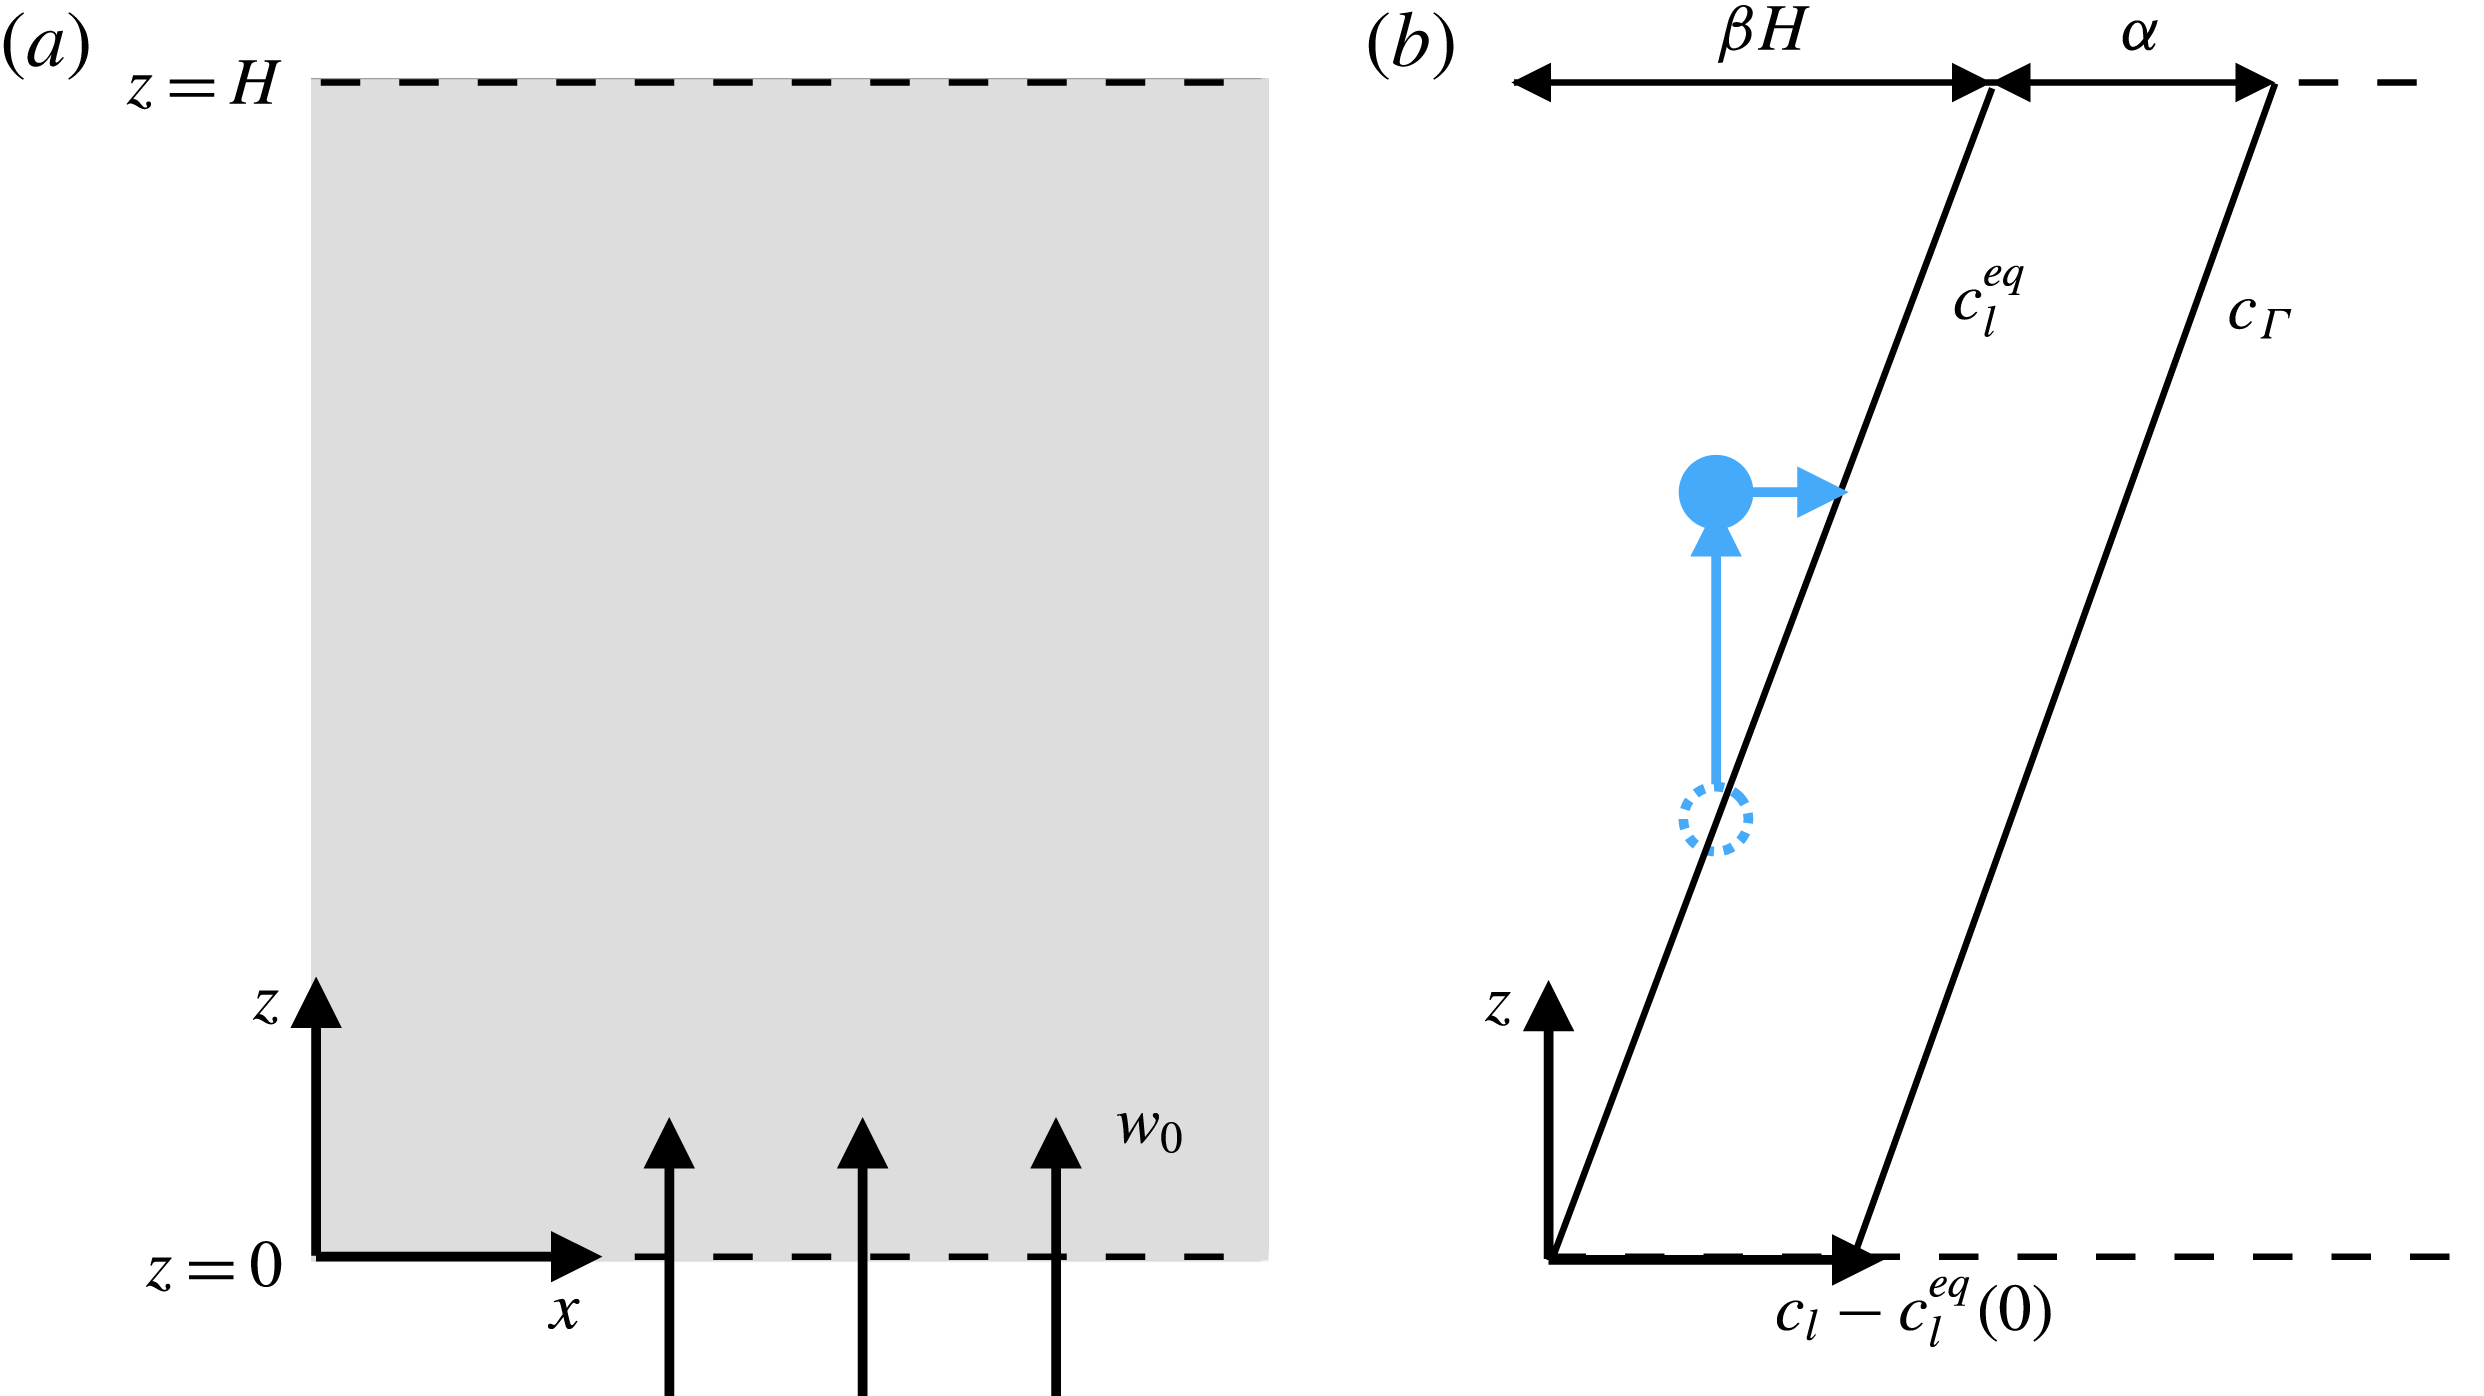
Figure 1 shows a schematic diagram of the domain: a region of partially molten rock of height
 $H$
in the
 $z$
direction, composed of a solid phase (
 $s$
, matrix, mantle rock) and a liquid phase (
 $l$
, magma).
Diagram of the problem. (a) A region of partially molten rock of depth
 $H$
with a flux of liquid phase from beneath and free-flux boundary condition above. (b) The gradient
 $\unicode[STIX]{x1D6FD}$
of the equilibrium composition of the liquid phase
 $c_{l}^{eq}$
. When a parcel of liquid (dashed blue circle) is raised (full blue circle), it has a concentration below the equilibrium, leading to reactive melting along the horizontal blue arrow. The composition of reactively produced melts
 $c_{\unicode[STIX]{x1D6E4}}$
is greater than equilibrium by a constant offset
 $\unicode[STIX]{x1D6FC}$
.

We account for conservation in both phases. Mass conservation in the solid and liquid is given by respectively
 $$\begin{eqnarray}\displaystyle & \displaystyle \frac{\unicode[STIX]{x2202}(1-\unicode[STIX]{x1D719})}{\unicode[STIX]{x2202}t}+\unicode[STIX]{x1D735}\boldsymbol{\cdot }((1-\unicode[STIX]{x1D719})\boldsymbol{v}_{s})=-\unicode[STIX]{x1D6E4}, & \displaystyle\end{eqnarray}$$
 $$\begin{eqnarray}\displaystyle & \displaystyle \frac{\unicode[STIX]{x2202}\unicode[STIX]{x1D719}}{\unicode[STIX]{x2202}t}+\unicode[STIX]{x1D735}\boldsymbol{\cdot }(\unicode[STIX]{x1D719}\boldsymbol{v}_{l})=\unicode[STIX]{x1D6E4}, & \displaystyle\end{eqnarray}$$
 $t$
is time,
 $\unicode[STIX]{x1D719}$
is the volume fraction of liquid phase (termed porosity),
 $(1-\unicode[STIX]{x1D719})$
is the fraction of solid phase,
 $\boldsymbol{v}_{l}$
is the liquid velocity,
 $\boldsymbol{v}_{s}$
is the solid velocity and
 $\unicode[STIX]{x1D6E4}$
is the volumetric melting rate (the rate at which volume is transferred from solid to liquid phase).
We use conservation of momentum to determine the solid and liquid velocities (McKenzie Reference McKenzie1984). In general, the solid phase (mantle) can deform viscously by both deviatoric shear and isotropic compaction. The latter is related to the pressure difference between the liquid and solid phases. We neglect deviatoric stresses on the solid phase and consider only the isotropic part of the stress and strain-rate tensors. The compaction rate
 $\unicode[STIX]{x1D735}\boldsymbol{\cdot }\boldsymbol{v}_{s}$
is related to the compaction pressure
 ${\mathcal{P}}$
according to the linear constitutive law
 $$\begin{eqnarray}\unicode[STIX]{x1D735}\boldsymbol{\cdot }\boldsymbol{v}_{s}={\mathcal{P}}/\unicode[STIX]{x1D701},\end{eqnarray}$$
where
 $\unicode[STIX]{x1D701}$
is an effective compaction or bulk viscosity. The solid matrix behaves like a rigid porous matrix when the bulk viscosity is sufficiently large (an idea we will relate to a non-dimensional matrix stiffness later). The effective compaction or bulk viscosity
 $\unicode[STIX]{x1D701}$
can be estimated using micromechanical models of partially molten rocks, and may depend on the porosity (Sleep Reference Sleep1988). The most recent calculations show that the bulk viscosity depends only weakly on porosity (Rudge Reference Rudge2017). Therefore, we make the simplifying assumption that
 $\unicode[STIX]{x1D701}$
is constant. We discuss this issue further in appendix C.
Fluid flow is given by Darcy’s law,
 $$\begin{eqnarray}\unicode[STIX]{x1D719}(\boldsymbol{v}_{l}-\boldsymbol{v}_{s})=K[(1-\unicode[STIX]{x1D719})\unicode[STIX]{x0394}\unicode[STIX]{x1D70C}g\hat{\boldsymbol{z}}-\unicode[STIX]{x1D735}{\mathcal{P}}].\end{eqnarray}$$
A Darcy flux
 $\unicode[STIX]{x1D719}(\boldsymbol{v}_{l}-\boldsymbol{v}_{s})$
is driven by gravity
 $g\hat{\boldsymbol{z}}$
associated with the density difference between the phases
 $\unicode[STIX]{x0394}\unicode[STIX]{x1D70C}$
and by compaction pressure gradients. Crucially, the mobility
 $K$
(
 $\equiv$
permeability divided by liquid viscosity) of the liquid depends on the porosity,
 $$\begin{eqnarray}K=K_{0}(\unicode[STIX]{x1D719}/\unicode[STIX]{x1D719}_{0})^{n},\end{eqnarray}$$
where
 $K_{0}$
is a reference mobility at a reference porosity
 $\unicode[STIX]{x1D719}_{0}$
(equal to the porosity at the base of the column,
 $z=0$
) and
 $n$
is a constant (we take
 $n=3$
in our numerical calculations). It is thought that
 $2\leqslant n\leqslant 3$
for the geological systems of interest (von Bargen & Waff Reference von Bargen and Waff1986; Miller et al.
Reference Miller, Zhu, Montési and Gaetani2014; Rudge Reference Rudge2018).
Finally, we must determine the melting or reaction rate
 $\unicode[STIX]{x1D6E4}$
. The focus of this paper is the mechanics of the instability, so we adopt a fairly simple treatment of its chemistry, largely following Aharonov et al. (Reference Aharonov, Whitehead, Kelemen and Spiegelman1995). The reaction associated with the reaction-infiltration instability is one of chemical dissolution. At a simple level, this can be described as follows. As magma rises, its pressure decreases and it becomes undersaturated in silica. This, in turn, drives a reaction in which pyroxene is dissolved from the solid while olivine is precipitated (cf. figure 8 in Longhi Reference Longhi2002). Schematically, the dissolution reaction can be written as
 $$\begin{eqnarray}\text{magma}_{1}(l)+\text{pyroxene}(s)\rightarrow \text{magma}_{2}(l)+\text{olivine}(s),\end{eqnarray}$$
where (
 $l$
) denotes a component in the liquid phase and (
 $s$
) a component in the solid phase, and we use subscripts 1 and 2 to indicate magmas of slightly different compositions. Crucially, this reaction involves a net transfer of mass from solid to liquid (Kelemen Reference Kelemen1990), and hence it is typically called a melting reaction. Because the reaction replaces pyroxene with olivine, geological observations of tabular dunite bodies in exhumed mantle rock are interpreted as evidence for the reaction-infiltration instability (dunites are mantle rocks, residual after partial melting, that are nearly pure olivine) (Kelemen et al.
Reference Kelemen, Dick and Quick1992).
We now formulate the reactive chemistry in terms of the simplest possible mathematics. We assume that
 $\unicode[STIX]{x1D6E4}$
is proportional to the undersaturation of a soluble component in the melt. The concentration of this component in the melt is denoted
 $c_{l}$
; the equilibrium concentration is denoted
 $c_{l}^{eq}$
. Hence, the melting rate is written as
 $$\begin{eqnarray}\unicode[STIX]{x1D6E4}=-R(c_{l}-c_{l}^{eq}),\end{eqnarray}$$
where
 $R$
is a kinetic coefficient with units 1/time. We assume that
 $R$
is a constant, independent of the concentration of the soluble component in the solid phase. This is valid for the purposes of studying the onset of instability if the soluble component is abundant and homogeneously distributed, both reasonable assumptions (Liang et al.
Reference Liang, Schiemenz, Hesse, Parmentier and Hesthaven2010).
In this formulation, the chemical reaction rate depends on the composition of the liquid phase
 $c_{l}$
. Chemical species conservation in the liquid phase is given by
 $$\begin{eqnarray}\frac{\unicode[STIX]{x2202}}{\unicode[STIX]{x2202}t}(\unicode[STIX]{x1D719}c_{l})+\unicode[STIX]{x1D735}\boldsymbol{\cdot }(\unicode[STIX]{x1D719}\boldsymbol{v}_{l}c_{l})=\unicode[STIX]{x1D735}\boldsymbol{\cdot }(\unicode[STIX]{x1D719}D\unicode[STIX]{x1D735}c_{l})+\unicode[STIX]{x1D6E4}c_{\unicode[STIX]{x1D6E4}},\end{eqnarray}$$
where the effective diffusivity of chemical species is
 $\unicode[STIX]{x1D719}D$
(diffusivity in the liquid phase is written
 $D$
; diffusion through the solid phase is negligible) and
 $c_{\unicode[STIX]{x1D6E4}}$
is the concentration of reactively produced melts. We then expand out the partial derivatives and simplify using (2.1b
) to obtain
 $$\begin{eqnarray}\unicode[STIX]{x1D719}\frac{\unicode[STIX]{x2202}c_{l}}{\unicode[STIX]{x2202}t}+\unicode[STIX]{x1D719}\boldsymbol{v}_{l}\boldsymbol{\cdot }\unicode[STIX]{x1D735}c_{l}=\unicode[STIX]{x1D735}\boldsymbol{\cdot }(\unicode[STIX]{x1D719}D\unicode[STIX]{x1D735}c_{l})+(c_{\unicode[STIX]{x1D6E4}}-c_{l})\unicode[STIX]{x1D6E4}.\end{eqnarray}$$
To close the system, we suppose that the equilibrium concentration has a constant gradient
 $\unicode[STIX]{x1D6FD}\hat{\mathbf{z}}$
, as shown in figure 1. If we define (without loss of generality) the equilibrium concentration at the base of the region (
 $z=0$
) to be zero, then
 $$\begin{eqnarray}c_{l}^{eq}=\unicode[STIX]{x1D6FD}z.\end{eqnarray}$$
We suppose further that the concentration
 $c_{\unicode[STIX]{x1D6E4}}$
of the reactively produced melts is offset from the equilibrium concentration by
 $\unicode[STIX]{x1D6FC}$
, a positive constant, so
 $$\begin{eqnarray}c_{\unicode[STIX]{x1D6E4}}=\unicode[STIX]{x1D6FD}z+\unicode[STIX]{x1D6FC}.\end{eqnarray}$$
A scaling argument clarifies the meaning of the compositional parameters: for a fast reaction (
 $R\rightarrow \infty$
), and hence for a liquid that is close to equilibrium, a vertical liquid flux
 $f_{0}$
would cause reactive melting at a characteristic rate
 $\unicode[STIX]{x1D6E4}_{0}\sim f_{0}\unicode[STIX]{x1D6FD}/\unicode[STIX]{x1D6FC}$
, so
 $\unicode[STIX]{x1D6FD}/\unicode[STIX]{x1D6FC}$
is the rate of reactive melting per unit of liquid flux. Our formulation of
 $c_{\unicode[STIX]{x1D6E4}}$
is slightly different from that of Aharonov et al. (Reference Aharonov, Whitehead, Kelemen and Spiegelman1995), who take
 $c_{\unicode[STIX]{x1D6E4}}=1$
. Their resulting simplified equations are equivalent to ours when
 $\unicode[STIX]{x1D6FC}=1$
(following the non-dimensionalization in our § 2.2).
At this point, we remark briefly on two simplifications inherent in the approach described above. First, we assume that the equilibrium chemistry of the liquid phase is a function of depth. A fuller treatment might consider the chemistry of the liquid as a function of pressure (Longhi Reference Longhi2002). However, to an excellent approximation, the liquid pressure is equal to the lithostatic pressure
 $\unicode[STIX]{x1D70C}_{s}g(H-z)$
, in which case pressure and depth are linearly related. Indeed, the dimensionless error in making this approximation is
 $O({\mathcal{S}}\unicode[STIX]{x0394}\unicode[STIX]{x1D70C}/\unicode[STIX]{x1D70C}_{s})$
, where
 ${\mathcal{S}}$
is the matrix stiffness parameter introduced below. Thus, we neglect the difference relative to lithostatic pressure consistent with a Boussinesq approximation
 $\unicode[STIX]{x0394}\unicode[STIX]{x1D70C}/\unicode[STIX]{x1D70C}_{s}\ll 1$
, where
 $\unicode[STIX]{x1D70C}_{s}$
is the density of the solid phase.
Second, we use a very simple treatment of melting that neglects, for example, latent heat and temperature variations. Hewitt (Reference Hewitt2010) developed a consistent thermodynamic model of melting and showed that latent heat may suppress instability because it reduces the melting rate. Such an effect can be represented within our simpler model by reducing the melting-rate factor
 $\unicode[STIX]{x1D6FD}/\unicode[STIX]{x1D6FC}$
(see further discussion in appendix C).
2.2 Simplified non-dimensional equations
The governing equations (2.1a ), (2.1b ), (2.3) and (2.8) can be non-dimensionalized according to the characteristic scales
 $$\begin{eqnarray}\left.\begin{array}{@{}c@{}}\displaystyle [x,z]=H,\quad [\unicode[STIX]{x1D719}]=\unicode[STIX]{x1D719}_{0},\\ \displaystyle [\boldsymbol{v}_{l}]=w_{0}\equiv K_{0}\unicode[STIX]{x0394}\unicode[STIX]{x1D70C}g/\unicode[STIX]{x1D719}_{0},\quad [\boldsymbol{v}_{s}]=\unicode[STIX]{x1D719}_{0}w_{0},\quad [t]=\unicode[STIX]{x1D6FC}/(w_{0}\unicode[STIX]{x1D6FD}),\\ \displaystyle [{\mathcal{P}}]=\unicode[STIX]{x1D701}\unicode[STIX]{x1D719}_{0}w_{0}\unicode[STIX]{x1D6FD}/\unicode[STIX]{x1D6FC},\quad [c_{l}]=\unicode[STIX]{x1D6FD}H,\quad [\unicode[STIX]{x1D6E4}]=\unicode[STIX]{x1D719}_{0}w_{0}\unicode[STIX]{x1D6FD}/\unicode[STIX]{x1D6FC}.\end{array}\right\}\end{eqnarray}$$
The dimensionless parameters of the system are as follows. First,
 ${\mathcal{M}}=\unicode[STIX]{x1D6FD}H/\unicode[STIX]{x1D6FC}\ll 1$
, which is the change in solubility across the domain height and characterizes the reactivity of the system. Second, stiffness
 ${\mathcal{S}}={\mathcal{M}}\unicode[STIX]{x1D6FF}^{2}/H^{2}$
, which characterizes the rigidity of the medium, where
 $\unicode[STIX]{x1D6FF}=\sqrt{K_{0}\unicode[STIX]{x1D701}}$
is the dimensional compaction length, an emergent length scale (e.g. Spiegelman Reference Spiegelman1993). Third,
 $Da=\unicode[STIX]{x1D6FC}RH/(\unicode[STIX]{x1D719}_{0}w_{0})\gg 1$
is the Damköhler number, which characterizes the importance of reaction relative to advection. Fourth,
 $Pe=w_{0}H/D\gg 1$
is the Péclet number, which characterizes the importance of advection relative to diffusion.
Then, the equations can be simplified by taking the limit of small porosity,
 $\unicode[STIX]{x1D719}_{0}\ll {\mathcal{M}}\ll 1$
, and considering only horizontal diffusion (because we expect channelized features with a short horizontal wavelength compared with their vertical structure). We also assume that the reaction rate is fast, so we neglect terms of
 $O({\mathcal{M}}/Da)\ll 1$
. We also expand out the divergence term in (2.1a
) using (2.2). Thus, the four governing equations (2.1a
), (2.1b
), (2.3) and (2.8) become
 $$\begin{eqnarray}\displaystyle & \displaystyle \frac{\unicode[STIX]{x2202}\unicode[STIX]{x1D719}}{\unicode[STIX]{x2202}t}={\mathcal{P}}+\unicode[STIX]{x1D712}, & \displaystyle\end{eqnarray}$$
 $$\begin{eqnarray}\displaystyle & \displaystyle {\mathcal{M}}\frac{\unicode[STIX]{x2202}\unicode[STIX]{x1D719}}{\unicode[STIX]{x2202}t}+\unicode[STIX]{x1D735}\boldsymbol{\cdot }(\unicode[STIX]{x1D719}\boldsymbol{v}_{l})={\mathcal{M}}\unicode[STIX]{x1D712}, & \displaystyle\end{eqnarray}$$
 $$\begin{eqnarray}\displaystyle & \displaystyle \unicode[STIX]{x1D719}\boldsymbol{v}_{l}=K[\hat{\boldsymbol{z}}-{\mathcal{S}}\unicode[STIX]{x1D735}{\mathcal{P}}], & \displaystyle\end{eqnarray}$$
 $$\begin{eqnarray}\displaystyle & \displaystyle \unicode[STIX]{x1D719}\boldsymbol{v}_{l}\boldsymbol{\cdot }\left[\frac{\unicode[STIX]{x1D735}\unicode[STIX]{x1D712}}{Da}-\hat{\boldsymbol{z}}\right]=\frac{1}{DaPe}\frac{\unicode[STIX]{x2202}}{\unicode[STIX]{x2202}x}\left(\unicode[STIX]{x1D719}\frac{\unicode[STIX]{x2202}\unicode[STIX]{x1D712}}{\unicode[STIX]{x2202}x}\right)-\unicode[STIX]{x1D712}, & \displaystyle\end{eqnarray}$$
 $K=\unicode[STIX]{x1D719}^{n}$
, and we have introduced a scaled undersaturation
 $\unicode[STIX]{x1D712}$
of the chemical composition of the liquid phase,
 $$\begin{eqnarray}\unicode[STIX]{x1D712}=Da(z-c_{l}).\end{eqnarray}$$
The dimensionless reactive melting rate is equal to the scaled undersaturation
 $\unicode[STIX]{x1D712}$
.
A set of appropriate boundary conditions is
 $$\begin{eqnarray}\unicode[STIX]{x1D719}=1,\quad \unicode[STIX]{x1D712}=1,\quad \frac{\unicode[STIX]{x2202}{\mathcal{P}}}{\unicode[STIX]{x2202}z}=0,\quad (z=0),\end{eqnarray}$$
 $$\begin{eqnarray}\frac{\unicode[STIX]{x2202}{\mathcal{P}}}{\unicode[STIX]{x2202}z}=0,\quad (z=1).\end{eqnarray}$$
The boundary conditions at
 $z=0$
combine with (2.12c
) to give an incoming vertical liquid velocity
 $w=1$
. At the upper boundary, there is no driving compaction pressure gradient (a ‘free-flux’ condition).
3 Linear stability analysis
We expand the variables as the sum of a
 $z$
-dependent
 $O(1)$
term and an
 $(x,z,t)$
-dependent perturbation,
 $$\begin{eqnarray}\displaystyle & \displaystyle \unicode[STIX]{x1D719}=\unicode[STIX]{x1D719}_{0}(z)+\unicode[STIX]{x1D719}_{1}(x,z,t), & \displaystyle\end{eqnarray}$$
 $$\begin{eqnarray}\displaystyle & \displaystyle {\mathcal{P}}={\mathcal{P}}_{0}(z)+{\mathcal{P}}_{1}(x,z,t), & \displaystyle\end{eqnarray}$$
 $$\begin{eqnarray}\displaystyle & \displaystyle \unicode[STIX]{x1D712}=\unicode[STIX]{x1D712}_{0}(z)+\unicode[STIX]{x1D712}_{1}(x,z,t), & \displaystyle\end{eqnarray}$$
 $$\begin{eqnarray}\displaystyle & \displaystyle \boldsymbol{v}_{l}=w_{0}(z)\hat{\mathbf{z}}+\boldsymbol{v}_{1}(x,z,t). & \displaystyle\end{eqnarray}$$
3.1 The base state
The leading-order flow is purely vertical. The conservation equations at this order are
 $$\begin{eqnarray}\displaystyle & \displaystyle 0={\mathcal{P}}_{0}+\unicode[STIX]{x1D712}_{0}, & \displaystyle\end{eqnarray}$$
 $$\begin{eqnarray}\displaystyle & \displaystyle \frac{\text{d}}{\text{d}z}(\unicode[STIX]{x1D719}_{0}w_{0})={\mathcal{M}}\unicode[STIX]{x1D712}_{0}, & \displaystyle\end{eqnarray}$$
 $$\begin{eqnarray}\displaystyle & \displaystyle \unicode[STIX]{x1D719}_{0}w_{0}=K_{0}\left[1-{\mathcal{S}}\frac{\text{d}{\mathcal{P}}_{0}}{\text{d}z}\right], & \displaystyle\end{eqnarray}$$
 $$\begin{eqnarray}\displaystyle & \displaystyle \unicode[STIX]{x1D719}_{0}w_{0}\left[\frac{1}{Da}\frac{\text{d}\unicode[STIX]{x1D712}_{0}}{\text{d}z}-1\right]=-\unicode[STIX]{x1D712}_{0}, & \displaystyle\end{eqnarray}$$
 $K_{0}=\unicode[STIX]{x1D719}_{0}^{n}$
. In the limit of large
 $Da$
, an exact solution is
 ${\mathcal{P}}_{0}=-\unicode[STIX]{x1D712}_{0}$
, where
 $\unicode[STIX]{x1D712}_{0}=\exp ({\mathcal{M}}z)$
. The prefactor is unity to satisfy (2.14b
). We can then rearrange (3.2) for
 $\unicode[STIX]{x1D719}_{0}$
and
 $w_{0}$
. Since
 ${\mathcal{M}}\ll 1$
,
 $\exp ({\mathcal{M}}z)\approx 1$
, and so we work in terms of a uniform base state,
 $$\begin{eqnarray}-{\mathcal{P}}_{0}=\unicode[STIX]{x1D712}_{0}=\unicode[STIX]{x1D719}_{0}=w_{0}=1.\end{eqnarray}$$
The uniformity of the base state significantly simplifies the subsequent analysis.
3.2 Perturbation equations
The equations governing the perturbations can be written as
 $$\begin{eqnarray}\displaystyle & \displaystyle \frac{\unicode[STIX]{x2202}\unicode[STIX]{x1D719}_{1}}{\unicode[STIX]{x2202}t}={\mathcal{P}}_{1}+\unicode[STIX]{x1D712}_{1}, & \displaystyle\end{eqnarray}$$
 $$\begin{eqnarray}\displaystyle & \displaystyle {\mathcal{M}}\frac{\unicode[STIX]{x2202}\unicode[STIX]{x1D719}_{1}}{\unicode[STIX]{x2202}t}+\unicode[STIX]{x1D719}_{0}\unicode[STIX]{x1D735}\boldsymbol{\cdot }\boldsymbol{v}_{1}+w_{0}\frac{\unicode[STIX]{x2202}\unicode[STIX]{x1D719}_{1}}{\unicode[STIX]{x2202}z}={\mathcal{M}}\unicode[STIX]{x1D712}_{1}, & \displaystyle\end{eqnarray}$$
 $$\begin{eqnarray}\displaystyle & \displaystyle \unicode[STIX]{x1D719}_{0}\boldsymbol{v}_{1}=-{\mathcal{S}}K_{0}\unicode[STIX]{x1D735}{\mathcal{P}}_{1}+(n-1)w_{0}\unicode[STIX]{x1D719}_{1}\hat{\boldsymbol{z}}, & \displaystyle\end{eqnarray}$$
 $$\begin{eqnarray}\displaystyle & \displaystyle (\unicode[STIX]{x1D719}_{0}w_{1}+\unicode[STIX]{x1D719}_{1}w_{0})\left[\frac{1}{Da}\frac{\text{d}\unicode[STIX]{x1D712}_{0}}{\text{d}z}-1\right]+\frac{\unicode[STIX]{x1D719}_{0}w_{0}}{Da}\frac{\unicode[STIX]{x2202}\unicode[STIX]{x1D712}_{1}}{\unicode[STIX]{x2202}z}=\frac{\unicode[STIX]{x1D719}_{0}}{DaPe}\frac{\unicode[STIX]{x2202}^{2}\unicode[STIX]{x1D712}_{1}}{\unicode[STIX]{x2202}x^{2}}-\unicode[STIX]{x1D712}_{1}. & \displaystyle\end{eqnarray}$$
 $K_{0}=\unicode[STIX]{x1D719}_{0}^{n}$
and hence that
 $K_{0}^{\prime }=nK_{0}/\unicode[STIX]{x1D719}_{0}$
.
We eliminate
 $\unicode[STIX]{x1D712}_{1}$
using (3.4a
) and
 $\boldsymbol{v}_{1}$
using (3.4c
). We also use (3.2d
) to simplify the expressions and obtain
 $$\begin{eqnarray}\displaystyle & \displaystyle -{\mathcal{S}}K_{0}\unicode[STIX]{x1D6FB}^{2}{\mathcal{P}}_{1}+nw_{0}\frac{\unicode[STIX]{x2202}\unicode[STIX]{x1D719}_{1}}{\unicode[STIX]{x2202}z}=-{\mathcal{M}}{\mathcal{P}}_{1}, & \displaystyle\end{eqnarray}$$
 $$\begin{eqnarray}\displaystyle & \displaystyle \left(-{\mathcal{S}}K_{0}\frac{\unicode[STIX]{x2202}{\mathcal{P}}_{1}}{\unicode[STIX]{x2202}z}+nw_{0}\unicode[STIX]{x1D719}_{1}\right)\left[\frac{-\unicode[STIX]{x1D712}_{0}}{\unicode[STIX]{x1D719}_{0}w_{0}}\right]=-\!\left[\frac{\unicode[STIX]{x1D719}_{0}w_{0}}{Da}\frac{\unicode[STIX]{x2202}}{\unicode[STIX]{x2202}z}-\frac{\unicode[STIX]{x1D719}_{0}}{DaPe}\frac{\unicode[STIX]{x2202}^{2}}{\unicode[STIX]{x2202}x^{2}}+1\right]\left(\frac{\unicode[STIX]{x2202}\unicode[STIX]{x1D719}_{1}}{\unicode[STIX]{x2202}t}-{\mathcal{P}}_{1}\right).\qquad & \displaystyle\end{eqnarray}$$
 $O({\mathcal{M}})$
term and cross differentiate to eliminate
 $\unicode[STIX]{x1D719}_{1}$
,
 $$\begin{eqnarray}\left[\frac{1}{Da}\unicode[STIX]{x2202}_{tz}-\frac{1}{DaPe}\unicode[STIX]{x2202}_{txx}+\unicode[STIX]{x2202}_{t}-n\right]\unicode[STIX]{x1D6FB}^{2}{\mathcal{P}}_{1}=\frac{n}{{\mathcal{S}}}\left[\left(\frac{1}{Da}-{\mathcal{S}}\right)\unicode[STIX]{x2202}_{z}-\frac{1}{DaPe}\unicode[STIX]{x2202}_{xx}+1\right]\unicode[STIX]{x2202}_{z}{\mathcal{P}}_{1}.\end{eqnarray}$$
For brevity in this equation, subscripts are used to denote partial derivatives.
We seek normal-mode solutions
 ${\mathcal{P}}_{1}\propto \exp (\unicode[STIX]{x1D70E}t+\text{i}kx+mz)$
of this linear equation, where
 $\unicode[STIX]{x1D70E}$
is the growth rate and
 $k$
is a horizontal wavenumber. Thus, we obtain the characteristic polynomial (dispersion relationship),
 $$\begin{eqnarray}\frac{\unicode[STIX]{x1D70E}}{Da}m^{3}+\left(\unicode[STIX]{x1D70E}{\mathcal{K}}-\frac{n}{Da{\mathcal{S}}}\right)m^{2}-\left(\frac{n{\mathcal{K}}}{{\mathcal{S}}}+\frac{\unicode[STIX]{x1D70E}}{Da}k^{2}\right)m+\left(n-\unicode[STIX]{x1D70E}{\mathcal{K}}\right)k^{2}=0,\end{eqnarray}$$
where
 ${\mathcal{K}}=1+k^{2}/DaPe$
. Equation (3.7) has three roots
 $m_{j}$
 $(j=1,2,3)$
, and hence the compaction pressure perturbation will be given by
 $$\begin{eqnarray}{\mathcal{P}}_{1}=\mathop{\sum }_{j=1}^{3}A_{j}\exp (\unicode[STIX]{x1D70E}t+\text{i}kx+m_{j}z).\end{eqnarray}$$
The three unknown prefactors
 $A_{j}$
are determined by the boundary conditions.
3.3 Boundary conditions on the perturbation
We previously eliminated
 $\unicode[STIX]{x1D712}_{1}$
and
 $\unicode[STIX]{x1D719}_{1}$
in favour of the compaction pressure
 ${\mathcal{P}}_{1}$
. The corresponding boundary conditions on
 ${\mathcal{P}}_{1}$
, derived from (2.14a-c
) and (3.4a
), are
 $$\begin{eqnarray}\displaystyle & \displaystyle {\mathcal{P}}_{1}=0\quad \text{at }z=0, & \displaystyle\end{eqnarray}$$
 $$\begin{eqnarray}\displaystyle & \displaystyle \frac{\unicode[STIX]{x2202}{\mathcal{P}}_{1}}{\unicode[STIX]{x2202}z}=0\quad \text{at }z=0. & \displaystyle\end{eqnarray}$$
The upper boundary condition (2.14d ) is
 $$\begin{eqnarray}\frac{\unicode[STIX]{x2202}{\mathcal{P}}_{1}}{\unicode[STIX]{x2202}z}=0\quad \text{at }z=1.\end{eqnarray}$$
The boundary conditions can be expressed in matrix form in terms of the coefficients of the normal-mode expansion (3.8) as
 $$\begin{eqnarray}\left(\begin{array}{@{}ccc@{}}1 & 1 & 1\\ m_{1} & m_{2} & m_{3}\\ m_{1}\text{e}^{m_{1}} & m_{2}\text{e}^{m_{2}} & m_{3}\text{e}^{m_{3}}\end{array}\right)\left(\begin{array}{@{}c@{}}A_{1}\\ A_{2}\\ A_{3}\end{array}\right)=\left(\begin{array}{@{}c@{}}0\\ 0\\ 0\end{array}\right).\end{eqnarray}$$
A necessary (but not sufficient) condition for a non-trivial solution
 $A_{j}$
to exist is that the boundary-condition matrix
 $\unicode[STIX]{x1D648}$
has zero determinant.
3.4 Analysis of the dispersion relationship
We analyse the characteristic polynomial (3.7) for the case of real growth rate
 $\unicode[STIX]{x1D70E}$
(that is, we look for channel modes rather than compaction–dissolution waves, as discussed in § 1). The characteristic polynomial, a cubic, has three roots
 $m_{j}$
 $(j=1,2,3)$
. The character of these roots is controlled by the cubic discriminant. If the discriminant is strictly positive, the roots are distinct and real. If the discriminant is zero, the roots are real but at least one root is repeated (degenerate). If the discriminant is strictly negative, then there is one real root (
 $m_{1}$
, say) and a pair of complex conjugate roots (
 $m_{2},m_{3}$
).
For the case of real and distinct roots, the columns of
 $\unicode[STIX]{x1D648}$
are linearly independent, the determinant of
 $\unicode[STIX]{x1D648}$
is non-zero and the only solution has
 $A_{j}=0$
. When the roots are real but degenerate,
 $\det \unicode[STIX]{x1D648}=0$
, but there is no set of coefficients
 $A_{j}$
that can satisfy the boundary condition at
 $z=1$
(3.9c
). Hence, there are physically meaningful roots only when the cubic discriminant of (3.7) is strictly negative.
In this latter case, with one real root and two complex conjugate roots,
 $\det \unicode[STIX]{x1D648}$
is purely imaginary. A proof of this follows. Consider a
 $2\times 2$
matrix whose columns are complex conjugate, say
 $\unicode[STIX]{x1D654}=(\boldsymbol{X},\boldsymbol{X}^{\ast })$
, where
 $\boldsymbol{X}=[X_{1},X_{2}]^{\text{T}}$
. Then,
 $\det \unicode[STIX]{x1D654}=X_{1}X_{2}^{\ast }-X_{2}X_{1}^{\ast }$
, so
 $\det \unicode[STIX]{x1D654}+\det \unicode[STIX]{x1D654}^{\ast }=0$
, i.e.
 $\det Y$
is pure imaginary. The boundary-condition matrix
 $\unicode[STIX]{x1D648}$
is
 $3\times 3$
, but
 $\det \unicode[STIX]{x1D648}$
can be written as the sum of purely imaginary determinants of
 $2\times 2$
submatrices, multiplied by purely real numbers; hence,
 $\det \unicode[STIX]{x1D648}$
is pure imaginary.
With
 $m_{1}$
real, and
 $m_{2}$
and
 $m_{3}=m_{2}^{\ast }$
complex, there are eigenvalues of
 $\unicode[STIX]{x1D70E}$
for which the imaginary part of
 $\det \unicode[STIX]{x1D648}$
vanishes. At these eigenvalues,
 $\det \unicode[STIX]{x1D648}=0$
, and there exists an eigenvector
 $A_{j}$
such that the boundary conditions are satisfied. We find these eigenvalues/vectors by numerically solving the coupled problem of the cubic polynomial (3.7) and
 $\det \unicode[STIX]{x1D648}=0$
.
3.5 Physical discussion of instability mechanism (part I: growth rate)
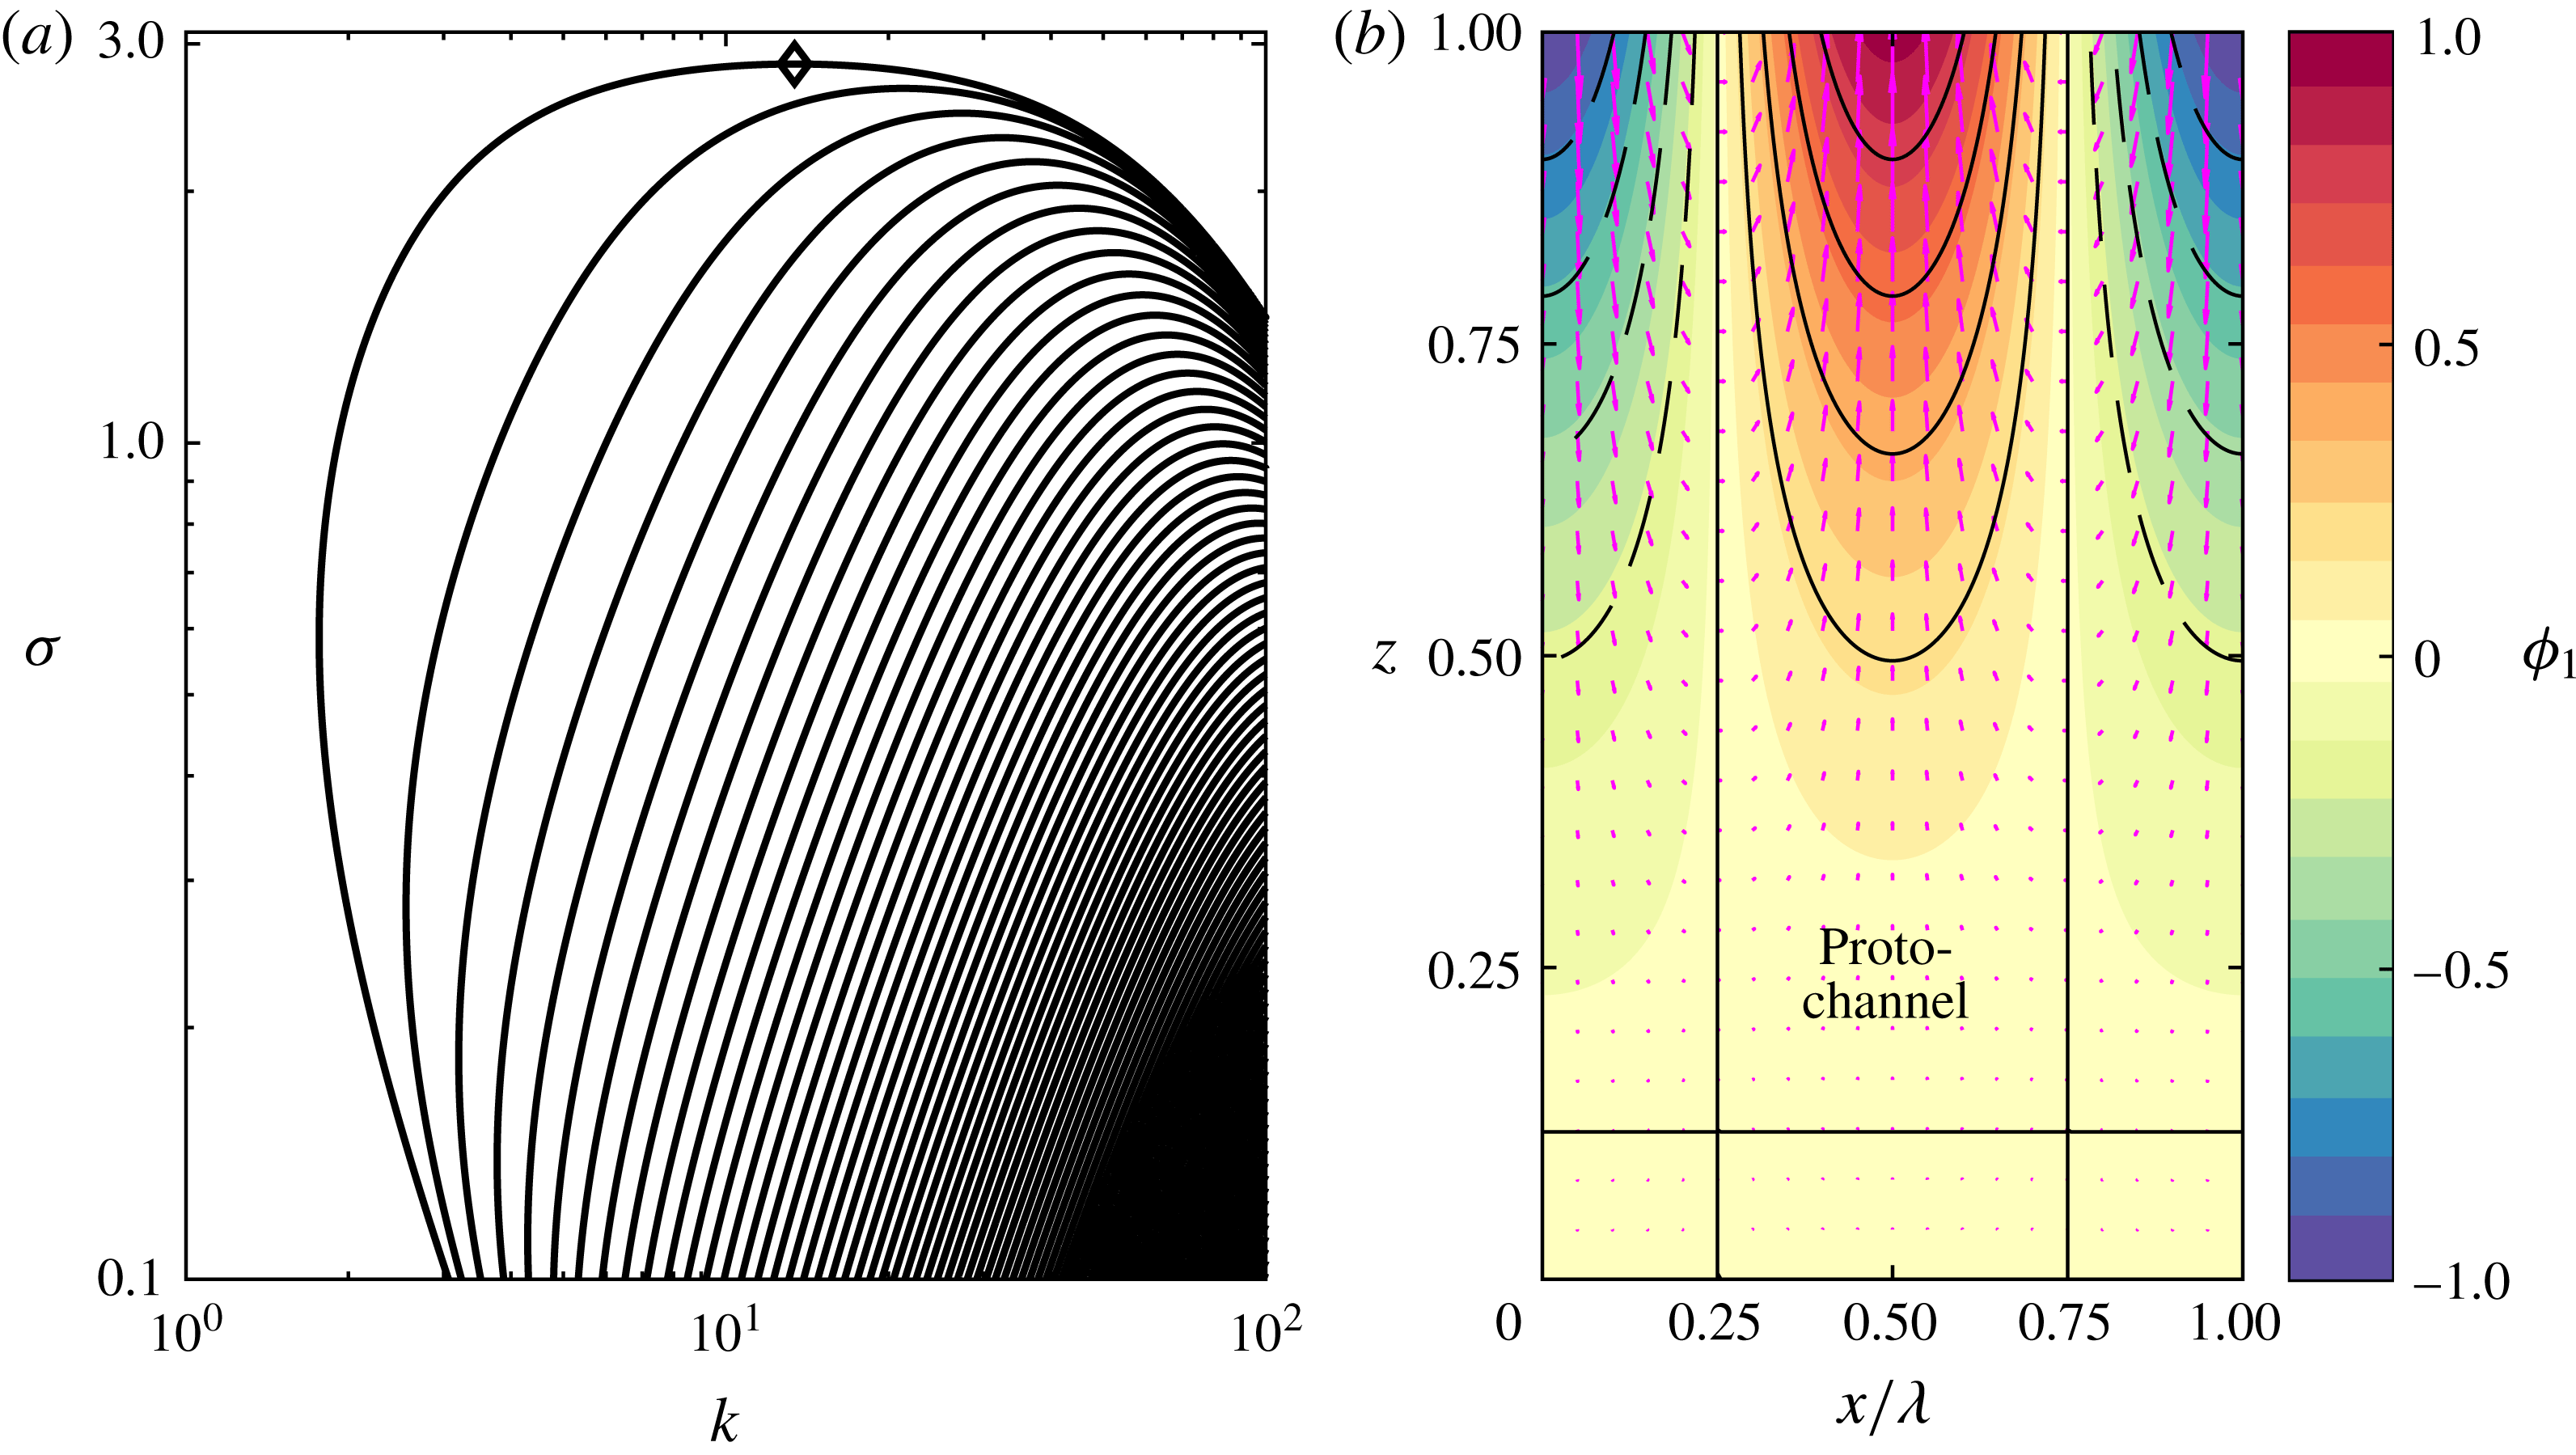
Figure 2(a) shows an example of the dispersion relationship
 $\unicode[STIX]{x1D70E}(k)$
. The curves are a series of valid solutions. The solutions on the uppermost dispersion curve have the largest growth rate
 $\unicode[STIX]{x1D70E}$
and are monotonic in
 $z$
. Curves below this fundamental mode are higher order, with increasing numbers of turning points in
 $z$
as
 $\unicode[STIX]{x1D70E}$
decreases at fixed
 $k$
. In this example, the instability is only present at
 $k\gtrsim 1$
, which roughly translates to channels that are narrower than the domain height. Hence, we expect that the lateral wavelength will always be smaller than the domain height.
(a) Example dispersion relationship calculated at
 $Da=10^{2}$
,
 $Pe=10^{2}$
,
 ${\mathcal{S}}=1$
,
 $n=3$
. (b) Perturbation corresponding to the most unstable wavenumber (indicated by a diamond symbol in a). The background colour scale shows the porosity perturbation
 $\unicode[STIX]{x1D719}_{1}$
(normalized to have a maximum value of 1). The black curves are contours of liquid undersaturation
 $\unicode[STIX]{x1D712}_{1}$
, which is positively correlated with
 $\unicode[STIX]{x1D719}_{1}$
(solid
 $=$
positive, dashed
 $=$
negative). The magenta arrows show the perturbation liquid velocity
 $\boldsymbol{v}_{1}$
. One can note the flow into the proto-channels (regions of elevated porosity
 $\unicode[STIX]{x1D719}_{1}>0$
). The compaction pressure
 ${\mathcal{P}}_{1}$
(not shown) is anti-correlated with
 $\unicode[STIX]{x1D719}_{1}$
, consistent with flow direction from high to low pressure.

We now explain the physical mechanism that gives rise to the instability. Figure 2(b) shows an example of the structure of the fastest-growing perturbation (most unstable mode). Regions of positive porosity perturbation
 $\unicode[STIX]{x1D719}_{1}$
(which we call proto-channels) create a positive perturbation of the vertical flux, according to (3.4c
). For didactic purposes, we consider the case of no compaction pressure (which is directly applicable to a rigid porous medium). Then,
 $$\begin{eqnarray}\unicode[STIX]{x1D719}_{0}w_{1}+\unicode[STIX]{x1D719}_{1}w_{0}=nw_{0}\unicode[STIX]{x1D719}_{1}.\end{eqnarray}$$
It should be noted that the positive vertical flux perturbation only occurs because the permeability increases with porosity (
 $n>0$
); this is a crucial aspect of the instability.
Positive vertical advection against the background equilibrium concentration gradient leads to positive liquid undersaturation
 $\unicode[STIX]{x1D712}_{1}$
, according to (3.4d
). In more physical terms, the enhanced vertical flux advects corrosive liquid from below. Thus, the equilibrium concentration gradient is the other crucial aspect of the instability, alongside the porosity-dependent permeability. For didactic purposes, we consider the case of very fast reaction (
 $Da\gg 1$
), in which the leading-order balance in (3.4d
) gives
 $$\begin{eqnarray}\unicode[STIX]{x1D712}_{1}=\unicode[STIX]{x1D719}_{0}w_{1}+\unicode[STIX]{x1D719}_{1}w_{0}=nw_{0}\unicode[STIX]{x1D719}_{1}.\end{eqnarray}$$
Positive liquid undersaturation in turn causes reactive melting and hence increasing porosity by (3.4a
), so the proto-channel emerges. Again, neglecting compaction pressure, replacing
 $\unicode[STIX]{x2202}_{t}\rightarrow \unicode[STIX]{x1D70E}$
and substituting (3.12), we find
 $$\begin{eqnarray}\unicode[STIX]{x1D70E}\unicode[STIX]{x1D719}_{1}=nw_{0}\unicode[STIX]{x1D719}_{1}\quad \Rightarrow \quad \unicode[STIX]{x1D70E}=n,\end{eqnarray}$$
where we used
 $w_{0}=1$
. It should be noted that the maximum growth rate in figure 2(a) is approximately
 $n=3$
. Recalling the non-dimensionalization of time in (2.11), we see that the time scale for channel growth is the time scale for reactive melting (
 $\unicode[STIX]{x1D6FC}/\unicode[STIX]{x1D6FD}w_{0}$
) multiplied by the sensitivity of melt flux to porosity (
 $n$
).
Further consideration of (3.4d
) reveals two stabilizing mechanisms. The instability is weakened by diffusion, especially at high wavenumber, since diffusion acts to smooth out lateral gradients in the undersaturation. It is also weakened by advection of the liquid undersaturation, because the undersaturation in the proto-channel increases with height (
 $\unicode[STIX]{x2202}\unicode[STIX]{x1D712}_{1}/\unicode[STIX]{x2202}z>0$
). The subsequent analysis shows that this latter mechanism is also more important at large wavenumber, so both advection and diffusion of liquid undersaturation play a role in wavelength selection (see §§ 4.2 and 4.3 respectively). Indeed, figure 2(a) shows that the growth rate decreases at large
 $k$
.
Finally, we consider the effect of compaction, which is a further stabilizing mechanism at both large and small wavenumbers (Aharonov et al.
Reference Aharonov, Whitehead, Kelemen and Spiegelman1995) (see §§ 4.1, 4.4 and appendix A). The instability only occurs if the matrix stiffness exceeds some critical value (see §§ 4.5 and 4.6). To leading order (
 ${\mathcal{M}}\ll 1$
), if we consider (3.4b
) governing liquid mass conservation, then
 $$\begin{eqnarray}\unicode[STIX]{x1D719}_{0}\unicode[STIX]{x1D735}\boldsymbol{\cdot }\boldsymbol{v}_{1}=-w_{0}\frac{\unicode[STIX]{x2202}\unicode[STIX]{x1D719}_{1}}{\unicode[STIX]{x2202}z}\quad \Rightarrow \quad K_{0}\unicode[STIX]{x1D6FB}^{2}{\mathcal{P}}_{1}=\frac{nw_{0}}{{\mathcal{S}}}\frac{\unicode[STIX]{x2202}\unicode[STIX]{x1D719}_{1}}{\unicode[STIX]{x2202}z},\end{eqnarray}$$
where we substitute in (3.4c
) to achieve the last expression (cf. (3.5a
)). Proto-channels are regions of increasing porosity perturbation (
 $\unicode[STIX]{x2202}\unicode[STIX]{x1D719}_{1}/\unicode[STIX]{x2202}z>0$
). Thus, by liquid mass conservation, they are regions of convergence of the perturbation velocity
 $\boldsymbol{v}_{1}$
. Therefore, proto-channels are regions of negative compaction pressure perturbation, which reduces the porosity perturbation, according to the equation of solid mass conservation (3.4a
). Again, this stabilizing mechanism is wavelength-dependent through the Laplacian in (3.14). It should be noted further that the perturbation to the compaction pressure decreases with increasing matrix stiffness
 ${\mathcal{S}}$
, so we recover the rigid porous medium case as
 ${\mathcal{S}}\gg 1$
. We return to the physical discussion of the instability in § 4.7 to explain the wavelength selection and the critical matrix stiffness.
4 Asymptotic analysis of the large-
 $Da$
limit

In this section, we use asymptotic analysis to estimate the maximum growth rate
 $\unicode[STIX]{x1D70E}^{\ast }$
and the wavenumber
 $k^{\ast }$
of the most unstable mode. The analysis allows us to understand the physical controls on the instability, particularly the wavelength selection.
The cubic dispersion relation (3.7) has a structure that simplifies in the limit of large
 $Da$
. There is one real root of
 $O(Da)$
and a pair of complex conjugate roots. If we take
 $m_{1}\sim O(Da)$
as ansatz, we obtain
 $$\begin{eqnarray}m_{1}\sim -{\mathcal{K}}Da.\end{eqnarray}$$
If we take
 $m_{2,3}\sim O(1)$
as ansatz, we obtain
 $$\begin{eqnarray}\left(\unicode[STIX]{x1D70E}{\mathcal{K}}-\frac{n}{Da{\mathcal{S}}}\right)m^{2}-\left(\frac{n{\mathcal{K}}}{{\mathcal{S}}}+\frac{\unicode[STIX]{x1D70E}}{Da}k^{2}\right)m+(n-\unicode[STIX]{x1D70E}{\mathcal{K}})k^{2}=0.\end{eqnarray}$$
The boundary condition (3.9b
) is accommodated by a boundary layer of thickness
 $O(1/Da)$
associated with the root
 $m_{1}$
. The remaining boundary conditions (3.9a
) and (3.9c
) can be written as
 $$\begin{eqnarray}\left(\begin{array}{@{}cc@{}}1 & 1\\ m_{2}\text{e}^{m_{2}} & m_{3}\text{e}^{m_{3}}\end{array}\right)\left(\begin{array}{@{}c@{}}A_{2}\\ A_{3}\end{array}\right)=\left(\begin{array}{@{}c@{}}0\\ 0\end{array}\right).\end{eqnarray}$$
As before, we require the determinant of this boundary-condition matrix to be zero. Noting that
 $m_{3}=m_{2}^{\ast }$
, we find that
 $$\begin{eqnarray}0=\text{imag}[m_{2}\exp (m_{2})].\end{eqnarray}$$
We write
 $m_{2}$
in terms of its real and imaginary parts,
 $m_{2}=a+\text{i}b$
, then
 $$\begin{eqnarray}0=\tan b+b/a.\end{eqnarray}$$
This algebraic equation has an infinite family of solutions corresponding to the multiple roots shown in figure 2(a). The perturbation compaction pressure can be written as
 $$\begin{eqnarray}{\mathcal{P}}_{1}\propto \exp (az)\sin (bz).\end{eqnarray}$$
It should be noted that there is no part of the solution proportional to
 $\exp (az)\cos (bz)$
because of boundary condition (3.9a
). Equation (4.5) is equivalent to boundary condition (3.9c
).
The real and imaginary parts of
 $m_{2}$
can be found using a variant of the quadratic formula,
 $$\begin{eqnarray}px^{2}+qx+r=0\Rightarrow x=\frac{-q}{2p}\pm \text{i}\sqrt{\frac{r}{p}-\left(\frac{q}{2p}\right)^{2}},\end{eqnarray}$$
where we assume that the quantity within the square root is real for the reasons discussed above (§ 3.4). We use (4.7) to obtain the exact expressions
 $$\begin{eqnarray}\displaystyle & \displaystyle a=\frac{\displaystyle \left(\frac{n{\mathcal{K}}}{{\mathcal{S}}}+\frac{\unicode[STIX]{x1D70E}}{Da}k^{2}\right)}{\displaystyle 2\left(\unicode[STIX]{x1D70E}{\mathcal{K}}-\frac{n}{Da{\mathcal{S}}}\right)}, & \displaystyle\end{eqnarray}$$
 $$\begin{eqnarray}\displaystyle & \displaystyle b^{2}+a^{2}=\frac{(n-\unicode[STIX]{x1D70E}{\mathcal{K}})k^{2}}{\displaystyle \left(\unicode[STIX]{x1D70E}{\mathcal{K}}-\frac{n}{Da{\mathcal{S}}}\right)}. & \displaystyle\end{eqnarray}$$
 $\unicode[STIX]{x1D70E}$
numerically (cf. dashed blue curve in figure 3), but it is instructive to make the additional ansatz
 $\unicode[STIX]{x1D70E}\sim n(1-\unicode[STIX]{x1D716})$
, where
 $\unicode[STIX]{x1D716}\ll 1$
. This allows us to approximate the behaviour near the maximum growth rate, where
 $\unicode[STIX]{x1D70E}\sim n$
. We also assume that
 $(Da{\mathcal{S}})^{-1}\ll 1$
but retain terms
 $O(k^{2}Da^{-1})$
since the latter are important at large wavenumber. In general,
 ${\mathcal{K}}\sim 1$
, except on the right-hand side of (4.8b
), where we obtain a term proportional to
 $[(1-\unicode[STIX]{x1D716})^{-1}-{\mathcal{K}}]\sim \unicode[STIX]{x1D716}-k^{2}/DaPe$
. We test all of the results obtained using these approximations against the full numerical solution of the cubic dispersion relation. Under the simplifying assumptions,
 $$\begin{eqnarray}\displaystyle & \displaystyle a\sim \frac{1}{2{\mathcal{S}}}+\frac{k^{2}}{2Da}, & \displaystyle\end{eqnarray}$$
 $$\begin{eqnarray}\displaystyle & \displaystyle \unicode[STIX]{x1D716}\sim \frac{b^{2}+a^{2}}{k^{2}}+\frac{k^{2}}{DaPe}. & \displaystyle\end{eqnarray}$$
 $\unicode[STIX]{x1D716}$
represent a series of stabilizing mechanisms that reduce the growth rate
 $\unicode[STIX]{x1D70E}$
, namely compaction (through the
 $1/2{\mathcal{S}}$
term in (4.9a
)), advection of undersaturation (through the
 $k^{2}/2Da$
term in (4.9a
)) and diffusion (through the
 $k^{2}/DaPe$
term in (4.9b
)). We show an example dispersion relationship at moderately high
 $Da$
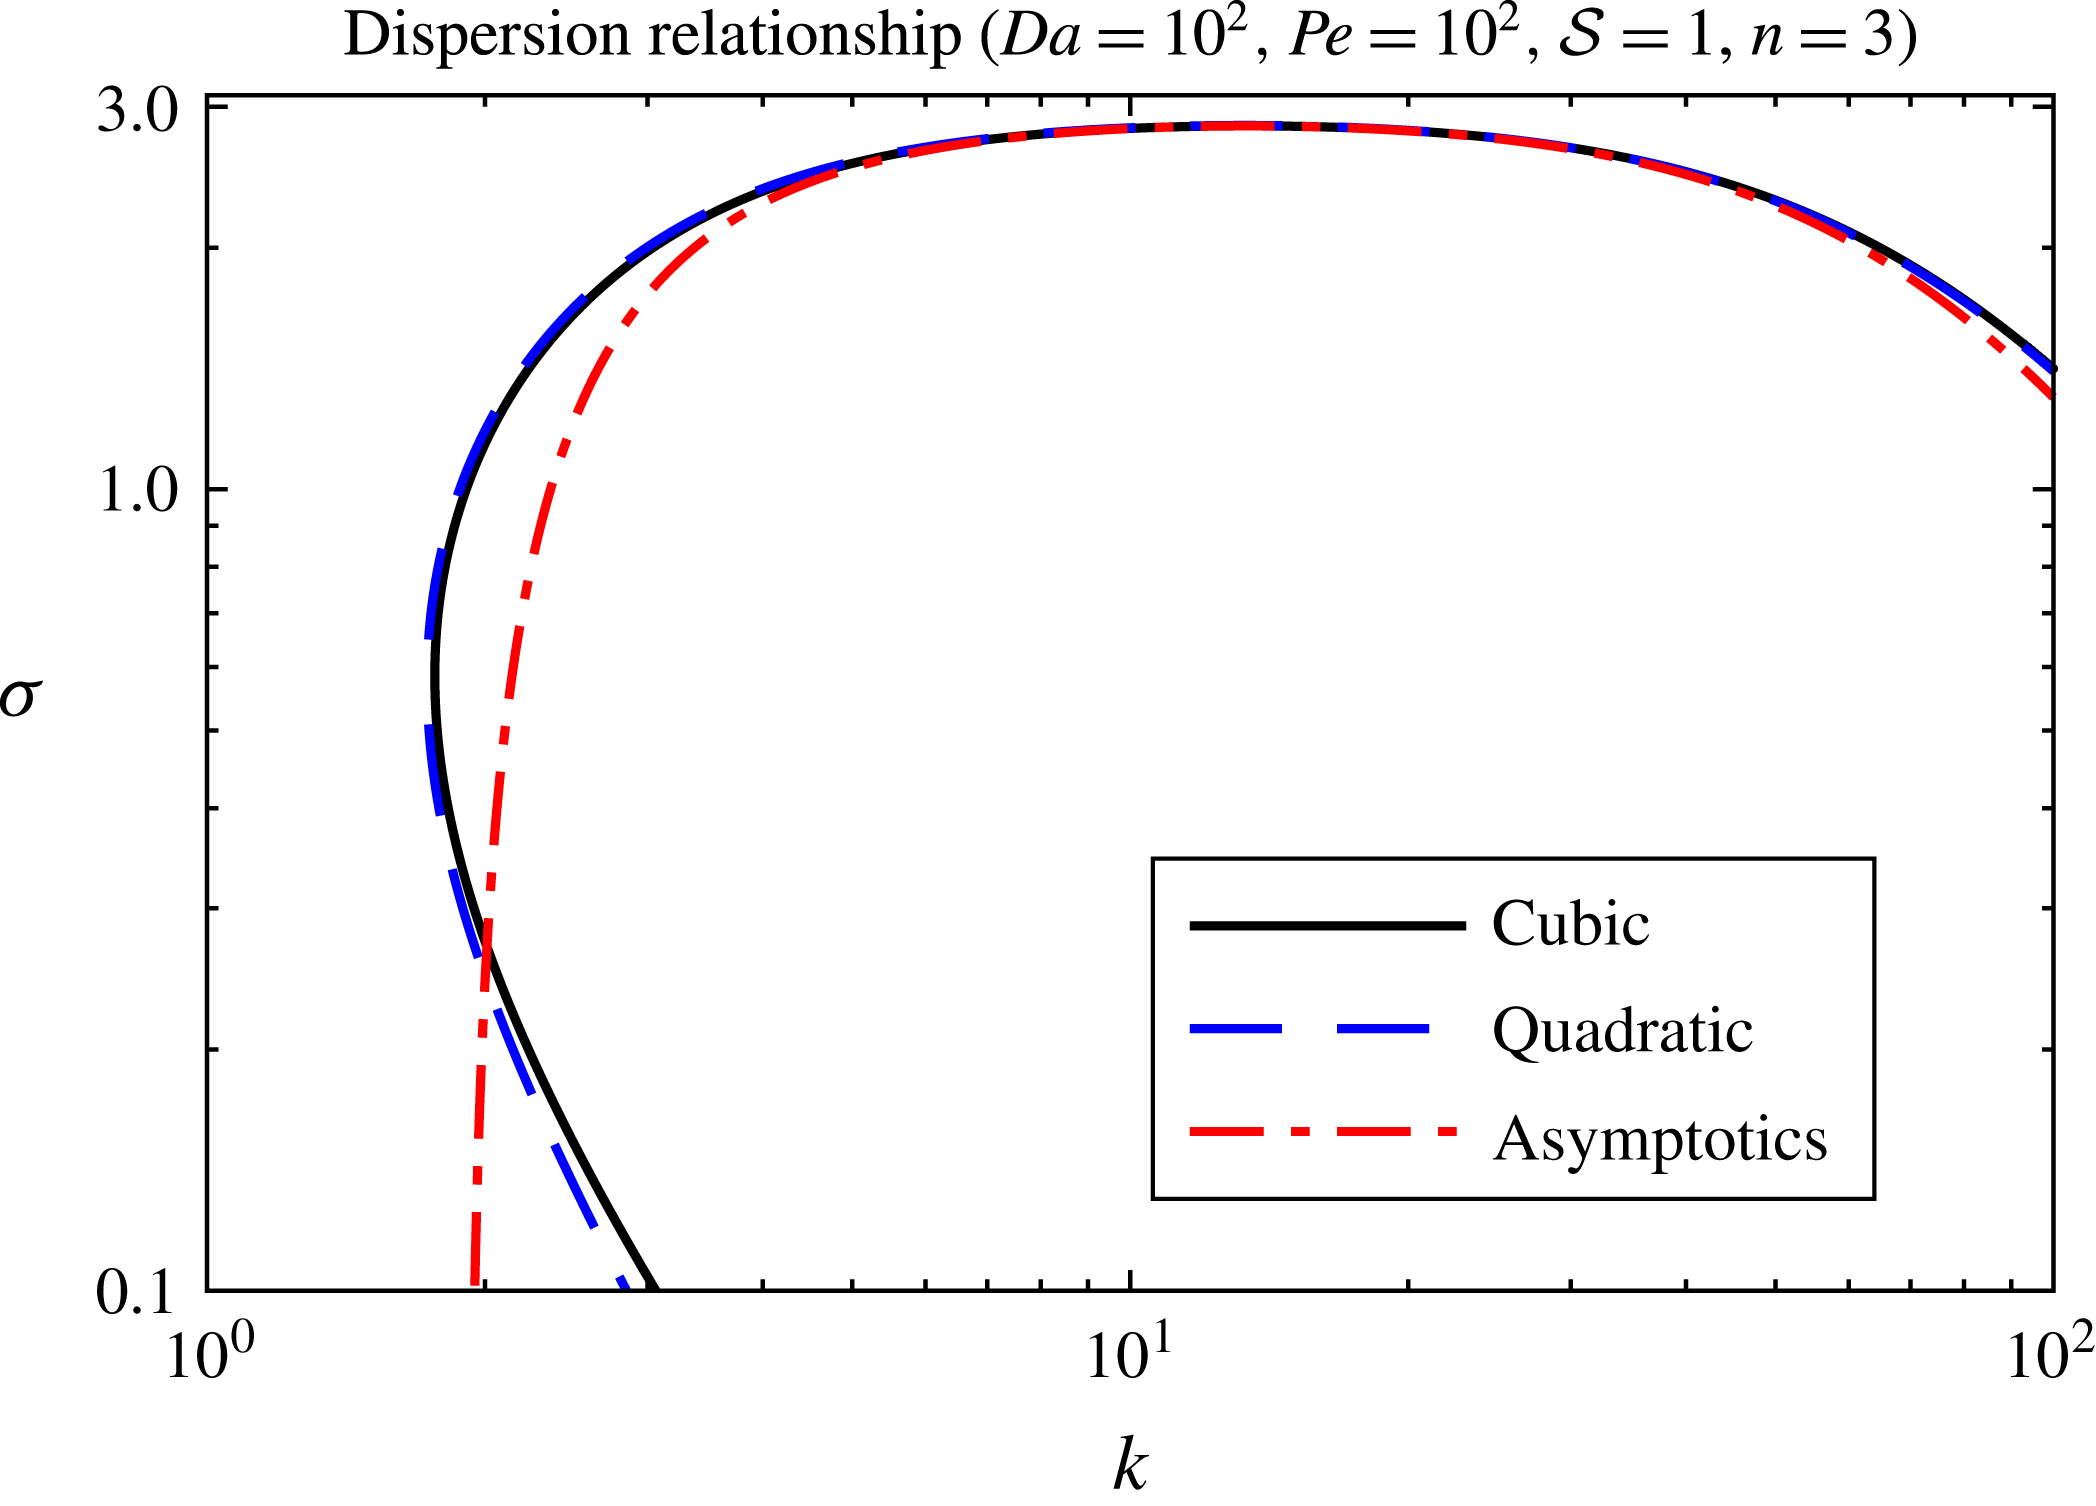
in figure 3.
High-
 $Da$
dispersion relationship with scaling relationships overlaid. Solid black: full numerical calculation of cubic dispersion relationship (3.7), only showing the most unstable mode. Dashed blue: solution of (4.8a
), (4.8b
) from the simplified quadratic dispersion relationship. Dot-dashed red: solution of (4.9b
). The blue curve agrees well everywhere; the red curve is only valid when
 $n-\unicode[STIX]{x1D70E}$
is small, consistent with the asymptotic approximations.

4.1 Dependence on wavenumber
$k$

Starting at small
 $k$
,
 $\unicode[STIX]{x1D716}$
initially decreases with
 $k$
, reaches some minimum value
 $\unicode[STIX]{x1D716}^{\ast }$
at
 $k=k^{\ast }$
(corresponding to the most unstable mode with maximum growth rate
 $\unicode[STIX]{x1D70E}^{\ast }=n(1-\unicode[STIX]{x1D716}^{\ast })$
) and then increases as
 $k\rightarrow \infty$
.
Scaling arguments make these statements more precise. When
 $k\ll k^{\ast }$
,
 $$\begin{eqnarray}\displaystyle & \displaystyle a\sim \frac{1}{2{\mathcal{S}}}, & \displaystyle\end{eqnarray}$$
 $$\begin{eqnarray}\displaystyle & \displaystyle \unicode[STIX]{x1D716}\sim \frac{b^{2}+a^{2}}{k^{2}}. & \displaystyle\end{eqnarray}$$
 ${\mathcal{B}}({\mathcal{S}})=b^{2}+a^{2}$
, where
 $a=1/2{\mathcal{S}}$
and
 $b$
satisfies (4.5). Then, a small-wavenumber ‘cutoff’ occurs when
 $\unicode[STIX]{x1D716}=O(1)$
(which is outside the bounds of our previous assumption
 $\unicode[STIX]{x1D716}\ll 1$
) when
 $k\sim {\mathcal{B}}^{1/2}$
. We use ‘cutoff’ to refer to the wavenumber at which the growth rate departs significantly from its maximum value, not the strict minimum wavelength, which we discuss below.
Conversely, at large
 $k$
,
 $k\gg k^{\ast }$
,
 $$\begin{eqnarray}\displaystyle & \displaystyle a\sim \frac{1}{2{\mathcal{S}}}+\frac{k^{2}}{2Da}, & \displaystyle\end{eqnarray}$$
 $$\begin{eqnarray}\displaystyle & \displaystyle \unicode[STIX]{x1D716}\sim k^{2}\left(\frac{1}{(2Da)^{2}}+\frac{1}{DaPe}\right). & \displaystyle\end{eqnarray}$$
 $Da\gg Pe$
, then
 $\unicode[STIX]{x1D716}\sim k^{2}/DaPe$
, so the large-wavenumber ‘cutoff’ occurs when
 $k\sim (DaPe)^{1/2}$
. Physically, the small scale of the instability is limited by the distance a chemical component can diffuse over the reaction time scale (Spiegelman et al.
Reference Spiegelman, Kelemen and Aharonov2001). Conversely, if
 $Pe\gg Da$
, then
 $\unicode[STIX]{x1D716}\sim k^{2}/(2Da)^{2}$
, so the large-wavenumber ‘cutoff’ occurs when
 $k\sim 2Da$
. Physically, the small scale of the instability is limited by the distance a chemical component is transported by the background liquid flow over the reaction time scale. These two limits also affect the maximum growth rate of the instability. In the next sections we consider each limit in turn.
It is also possible to determine strict minimum and maximum wavenumbers for instability, although this is more technical so we leave the details for appendix A. In summary, we find
 $$\begin{eqnarray}k_{min}\sim \frac{1.5171}{{\mathcal{S}}^{1/2}}\quad ({\mathcal{S}}\gg 1),\quad k_{min}\sim \frac{1}{{\mathcal{S}}}\quad ({\mathcal{S}}\ll 1),\end{eqnarray}$$
 $$\begin{eqnarray}k_{max}\sim {\mathcal{S}}DaPe.\end{eqnarray}$$
The dependence on the matrix stiffness
 ${\mathcal{S}}$
means that compaction stabilizes the system at both large and small wavenumbers (Aharonov et al.
Reference Aharonov, Whitehead, Kelemen and Spiegelman1995). Indeed, in a rigid medium (
 ${\mathcal{S}}\gg 1$
), there is no minimum or maximum wavenumber.
4.2 Advection-controlled instability,
$Pe\gg Da\gg 1$

We first consider the case of negligible diffusion. In this case, it is natural to introduce a change of variables:
 $\tilde{k}=kDa^{-1/2}$
,
 $\tilde{\unicode[STIX]{x1D716}}=\unicode[STIX]{x1D716}Da$
. Then, to leading order,
 $$\begin{eqnarray}\displaystyle & \displaystyle a\sim \frac{1}{2{\mathcal{S}}}+\frac{\tilde{k}^{2}}{2}, & \displaystyle\end{eqnarray}$$
 $$\begin{eqnarray}\displaystyle & \displaystyle \tilde{\unicode[STIX]{x1D716}}\sim \frac{a^{2}+b^{2}}{\tilde{k}^{2}}. & \displaystyle\end{eqnarray}$$
 $b$
and
 $a$
, and hence
 $\tilde{\unicode[STIX]{x1D716}}$
, are functions of
 $(\tilde{k},{\mathcal{S}})$
alone.
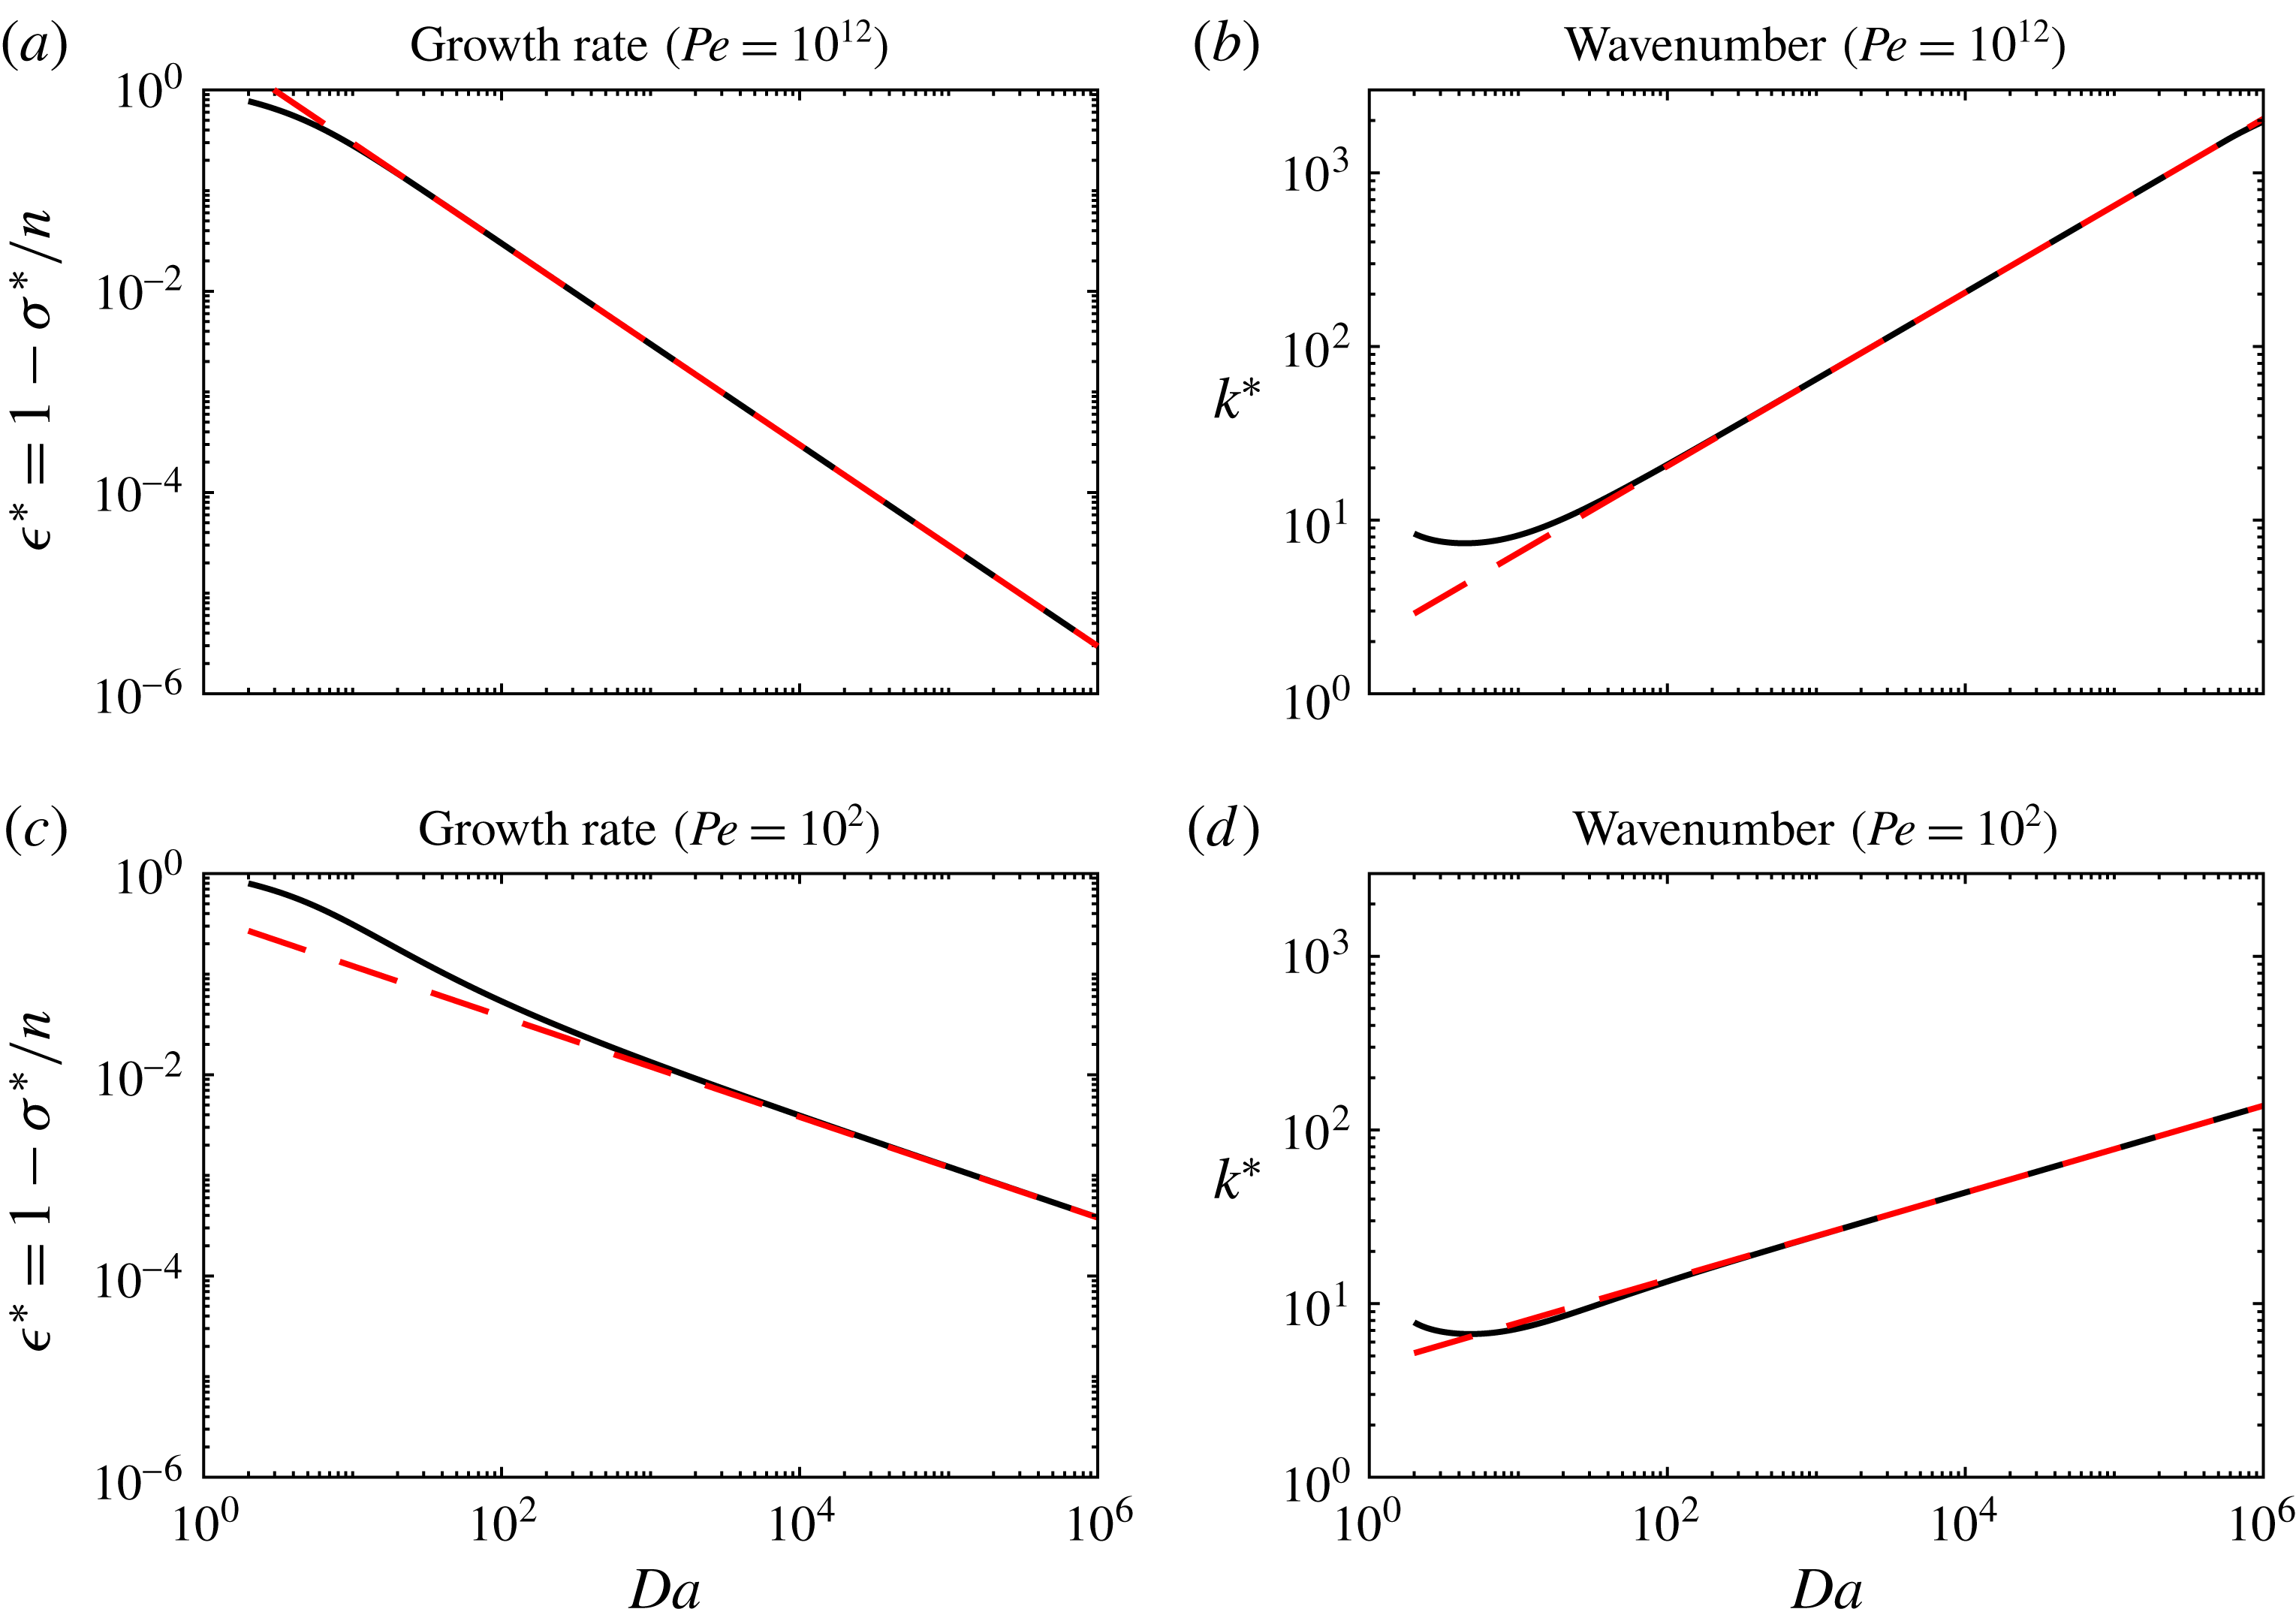
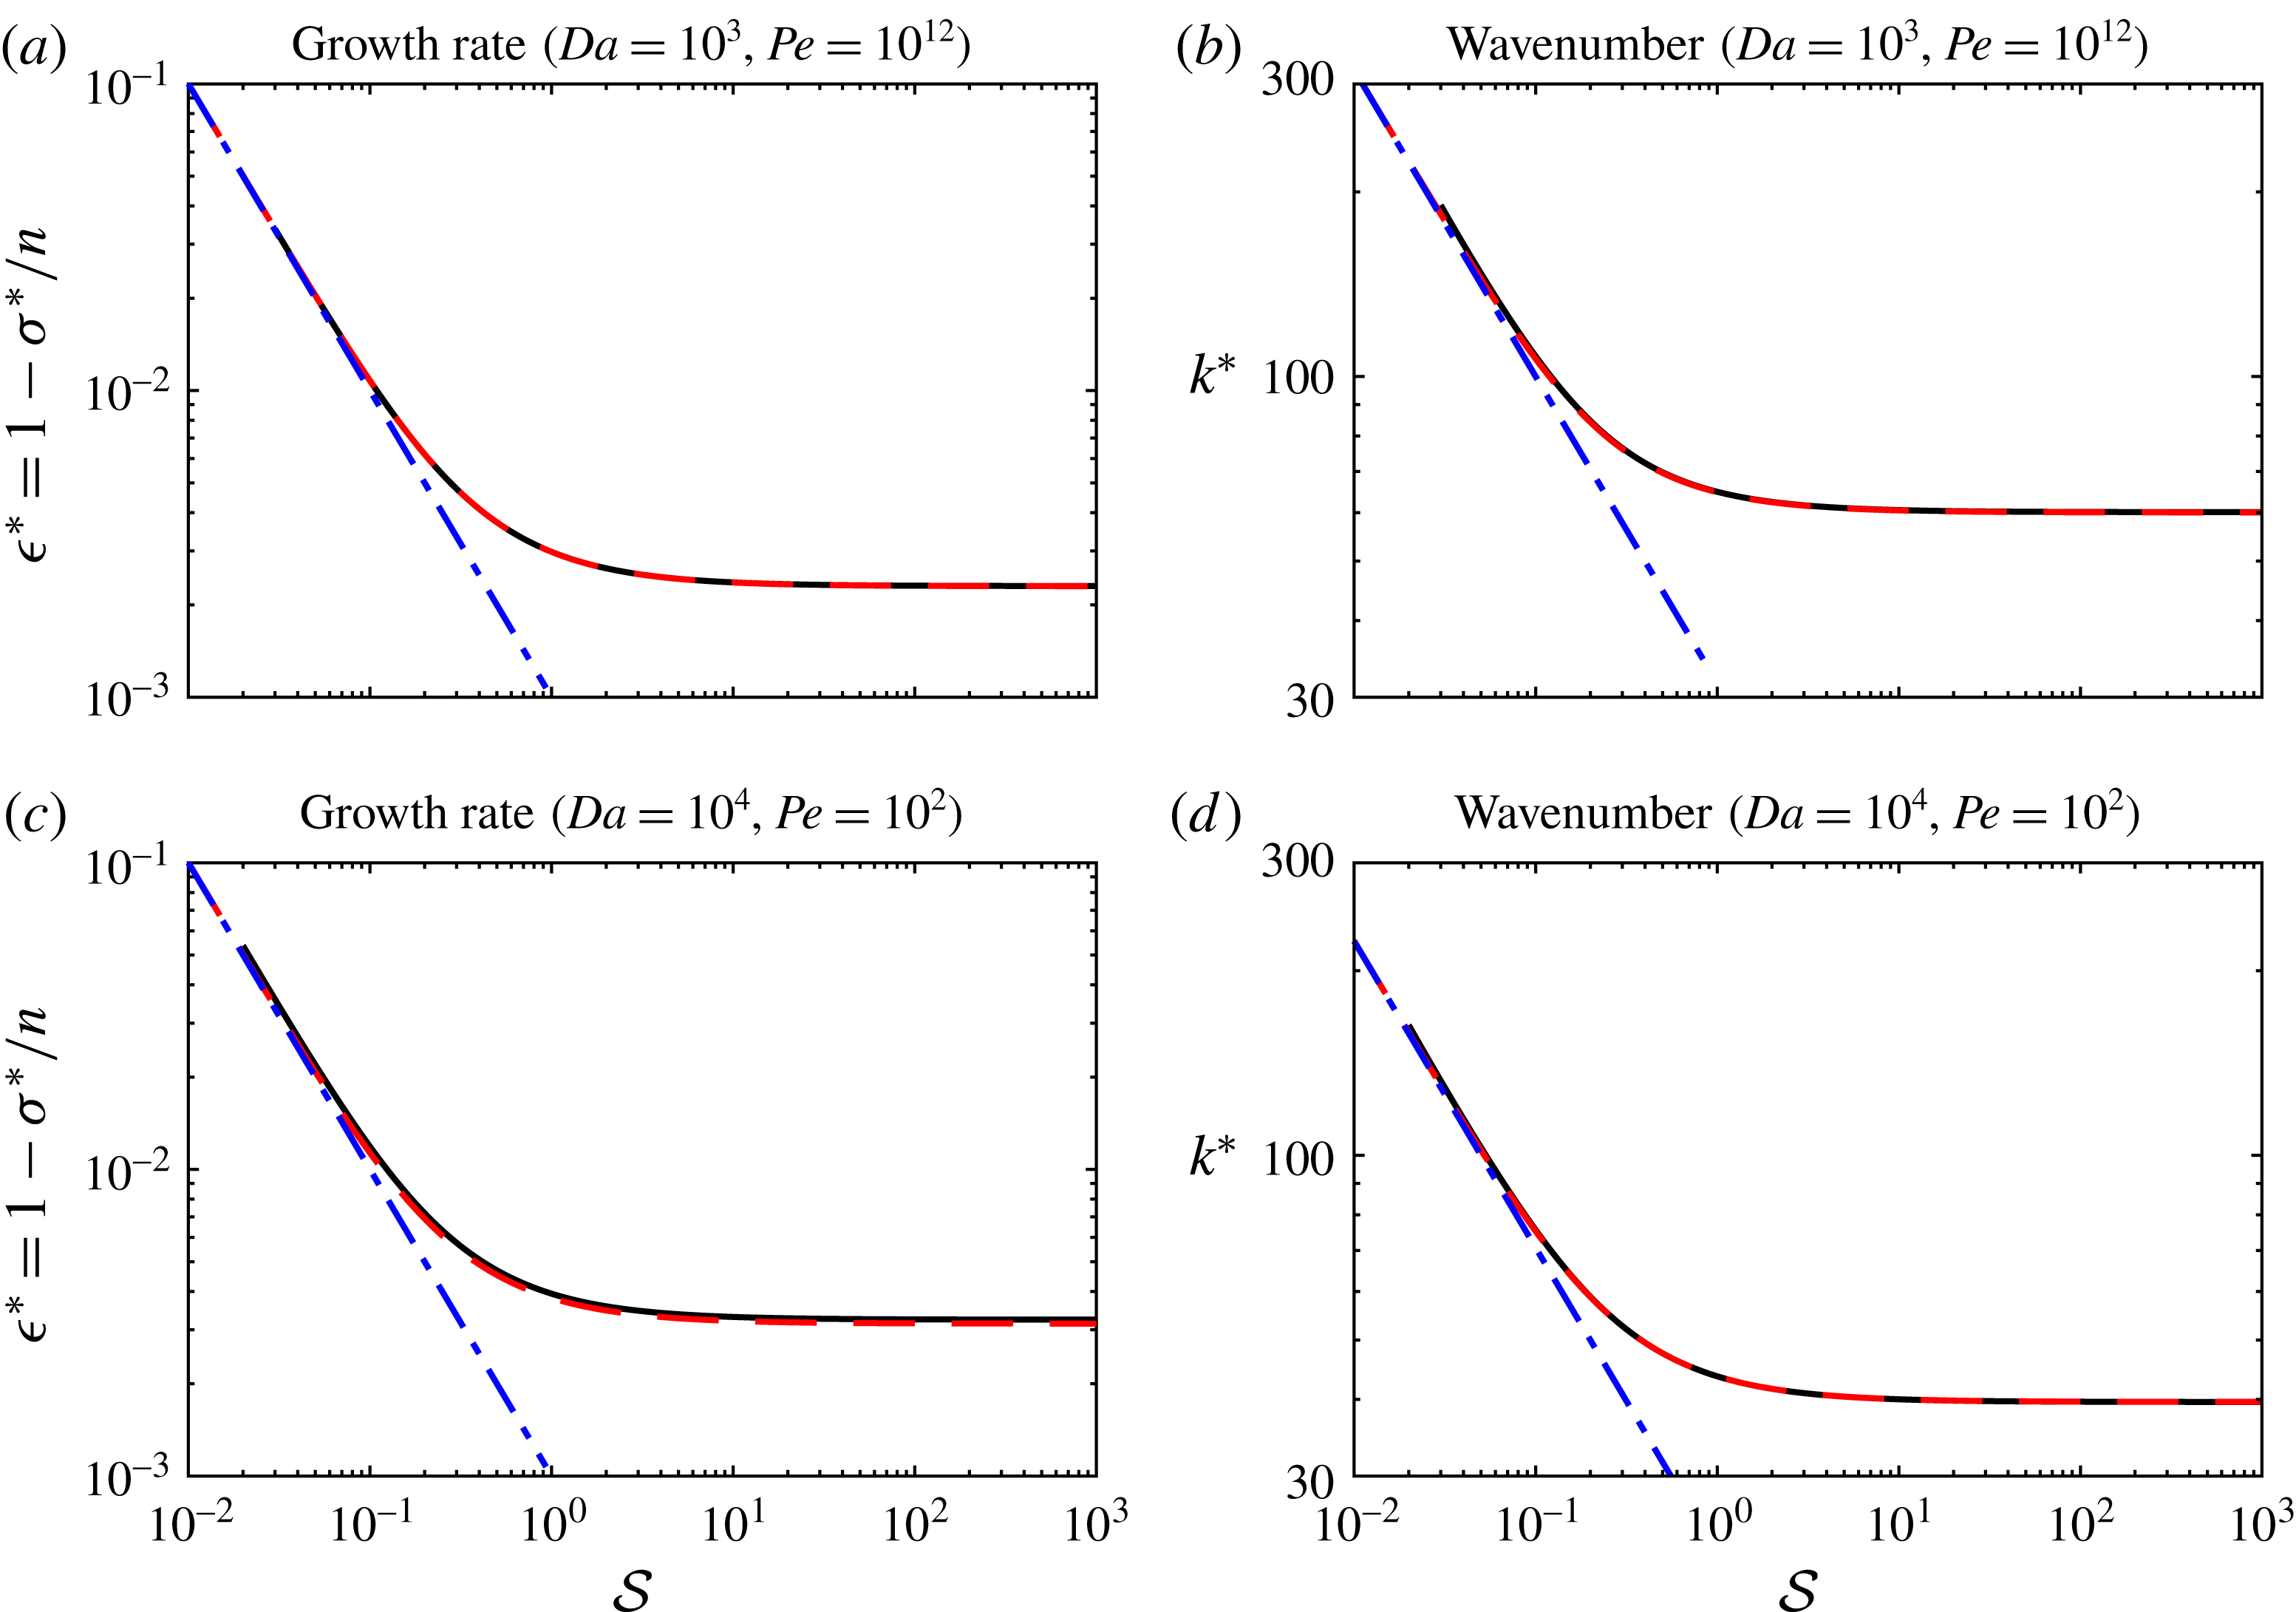
Numerical calculations of the full cubic dispersion relation (3.7) (solid black curves) compared with power-law scalings (dashed red lines) for the maximum growth rate and the corresponding wavenumber as a function of
 $Da$
, at fixed
 $Pe=10^{12}$
(a,b) and
 $Pe=10^{2}$
(c,d). For all calculations,
 ${\mathcal{S}}=1$
.

We find the maximum growth rate by differentiating (4.14b ) and seeking the (unique) turning point, which satisfies
 $$\begin{eqnarray}b^{2}+(\tilde{k}^{2}-1)b\cos (b)\sin (b)-\tilde{k}^{2}\sin ^{2}(b)=0.\end{eqnarray}$$
We solve numerically to obtain the solution
 $\tilde{k}^{\ast }=\tilde{k}^{\ast }({\mathcal{S}})$
. The corresponding growth rate is
 $\tilde{\unicode[STIX]{x1D716}}^{\ast }({\mathcal{S}})$
. In summary, the most unstable wavelength
 $k^{\ast }\sim \tilde{k}^{\ast }Da^{1/2}$
(consistent with the numerical results of Aharonov et al.
Reference Aharonov, Whitehead, Kelemen and Spiegelman1995) and the corresponding growth rate
 $\unicode[STIX]{x1D70E}^{\ast }\sim n[1-\tilde{\unicode[STIX]{x1D716}}^{\ast }Da^{-1}]$
. These scaling results are shown in figure 4(a,b). The dependence on compaction through the matrix stiffness
 $({\mathcal{S}})$
is shown in figure 5(a,b). The wavenumber is controlled by advection of liquid undersaturation (see § 4.7).
4.3 Diffusion-controlled instability,
$Da\gg Pe$

The other limit occurs when diffusion is significant. For this case, it is natural to introduce a different change of variables:
 $\hat{k}=k(DaPe)^{-1/4}$
,
 $\hat{\unicode[STIX]{x1D716}}=\unicode[STIX]{x1D716}(DaPe)^{1/2}$
. Then,
 $$\begin{eqnarray}\displaystyle & \displaystyle a\sim \frac{1}{2{\mathcal{S}}}, & \displaystyle\end{eqnarray}$$
 $$\begin{eqnarray}\displaystyle & \displaystyle \hat{\unicode[STIX]{x1D716}}\sim \frac{{\mathcal{B}}+\hat{k}^{4}}{\hat{k}^{2}}, & \displaystyle\end{eqnarray}$$
 ${\mathcal{B}}({\mathcal{S}})$
was defined previously.
Dependence on matrix compaction (stiffness
 ${\mathcal{S}}$
) in the two regimes
 $Pe\gg Da$
(a,b) and
 $Da\gg Pe$
(c,d). Panels (a,c) show the maximum growth rate and (b,d) show the corresponding wavenumber. The solid black curves are numerical calculations of the full cubic dispersion relation (3.7). The dashed red curves (which are almost indistinguishable) are asymptotic results in the limit of large
 $Da$
. The blue dot-dashed lines are asymptotic results in the limit of small
 ${\mathcal{S}}$
.

This dispersion relation is simple enough to analyse by hand. The minimum of
 $\hat{\unicode[STIX]{x1D716}}^{\ast }=2{\mathcal{B}}^{1/2}$
and occurs when
 $\hat{k}^{\ast }={\mathcal{B}}^{1/4}$
. Thus, the maximum growth rate
 $\unicode[STIX]{x1D70E}^{\ast }$
that occurs at wavenumber
 $k^{\ast }$
satisfies
 $$\begin{eqnarray}\displaystyle & \displaystyle k^{\ast }\sim (PeDa{\mathcal{B}})^{1/4}, & \displaystyle\end{eqnarray}$$
 $$\begin{eqnarray}\displaystyle & \displaystyle \unicode[STIX]{x1D70E}^{\ast }\sim n\left[1-\frac{2\sqrt{{\mathcal{B}}}}{\sqrt{DaPe}}\right]. & \displaystyle\end{eqnarray}$$
 $k^{\ast }\sim Pe^{1/4}$
was observed numerically by Aharonov et al. (Reference Aharonov, Whitehead, Kelemen and Spiegelman1995), although they did not obtain the dependence on
 $Da$
or
 ${\mathcal{S}}$
. Thus, the instability grows most rapidly at some wavelength controlled by diffusion. The analysis is consistent with numerical results (figure 4
c,d). The dependence on compaction through the function
 ${\mathcal{B}}({\mathcal{S}})$
is shown in figure 5(c,d). Increasing the matrix stiffness
 ${\mathcal{S}}$
increases the growth rate and reduces the wavenumber of the most unstable mode. The wavenumber is controlled by diffusion (see § 4.7).
4.4 Effect of compaction (dependence on
${\mathcal{S}}$
)

Asymptotic estimates of the dependence on
 ${\mathcal{S}}$
are obtained by analysing the roots of (4.5):
 $\tan b+b/a=0$
. The first non-trivial root
 $b$
of this equation occurs for
 $b\in (\unicode[STIX]{x03C0}/2,\unicode[STIX]{x03C0})$
. At small
 $a$
(large
 ${\mathcal{S}}$
), the root
 $b\rightarrow \unicode[STIX]{x03C0}/2^{+}$
. At large
 $a$
(small
 ${\mathcal{S}}$
), the root
 $b\rightarrow \unicode[STIX]{x03C0}^{-}$
.
Next, we determine the maximum growth rate for large and small
 ${\mathcal{S}}$
. First, we consider the case of advection-controlled growth (
 $Pe\gg Da\gg 1$
). At large
 ${\mathcal{S}}\gg 1$
,
 $a\sim \tilde{k}^{2}/2$
independent of
 ${\mathcal{S}}$
. Thus,
 $a,b,\tilde{k}^{\ast },\tilde{\unicode[STIX]{x1D716}}^{\ast }$
approach some limit that is independent of
 ${\mathcal{S}}$
. By solving (4.15) numerically, we find that
 $$\begin{eqnarray}\displaystyle & \displaystyle \tilde{k}^{\ast }\rightarrow 1.898, & \displaystyle\end{eqnarray}$$
 $$\begin{eqnarray}\displaystyle & \displaystyle \tilde{\unicode[STIX]{x1D716}}^{\ast }\rightarrow 2.302. & \displaystyle\end{eqnarray}$$
 ${\mathcal{S}}\ll 1$
, we obtain the following leading-order expressions:
 $$\begin{eqnarray}\displaystyle & \displaystyle a^{\ast }\sim {\mathcal{S}}^{-1}, & \displaystyle\end{eqnarray}$$
 $$\begin{eqnarray}\displaystyle & \displaystyle b^{\ast }\sim \unicode[STIX]{x03C0}(1-{\mathcal{S}}), & \displaystyle\end{eqnarray}$$
 $$\begin{eqnarray}\displaystyle & \displaystyle \tilde{k}^{\ast }\sim {\mathcal{S}}^{-1/2}, & \displaystyle\end{eqnarray}$$
 $$\begin{eqnarray}\displaystyle & \displaystyle \tilde{\unicode[STIX]{x1D716}}^{\ast }\sim {\mathcal{S}}^{-1}. & \displaystyle\end{eqnarray}$$
Second, we consider the case of diffusion-controlled growth (
 $Da\gg Pe$
). As before, the growth rate approaches a constant as
 ${\mathcal{S}}$
increases, namely
 $$\begin{eqnarray}\displaystyle & \displaystyle \hat{k}^{\ast }\rightarrow (\unicode[STIX]{x03C0}/2)^{1/2}, & \displaystyle\end{eqnarray}$$
 $$\begin{eqnarray}\displaystyle & \displaystyle \hat{\unicode[STIX]{x1D716}}^{\ast }\rightarrow \unicode[STIX]{x03C0}. & \displaystyle\end{eqnarray}$$
 ${\mathcal{S}}\ll 1$
, as before,
 $a\sim {\mathcal{S}}^{-1}$
, and we obtain
 $$\begin{eqnarray}\displaystyle & \displaystyle \hat{k}^{\ast }\sim (2{\mathcal{S}})^{-1/2}, & \displaystyle\end{eqnarray}$$
 $$\begin{eqnarray}\displaystyle & \displaystyle \hat{\unicode[STIX]{x1D716}}^{\ast }\sim {\mathcal{S}}^{-1}. & \displaystyle\end{eqnarray}$$
 ${\mathcal{S}}\rightarrow \infty$
. The numerical calculations show that the rigid-medium limit is approximately attained when
 ${\mathcal{S}}\gtrsim 1$
.
The scalings for wavenumber and growth rate are the same in terms of the power-law dependence on
 ${\mathcal{S}}$
. In either case, a compactible medium is less unstable than a rigid medium. That is, compaction stabilizes the system. We can interpret (4.19d
) and (4.21b
) in terms of a critical stiffness such that the instability occurs when
 ${\mathcal{S}}\geqslant {\mathcal{S}}_{crit}$
, where
 $$\begin{eqnarray}\displaystyle & \displaystyle {\mathcal{S}}_{crit}\propto \frac{1}{Da}\quad (Pe\gg Da), & \displaystyle\end{eqnarray}$$
 $$\begin{eqnarray}\displaystyle & \displaystyle {\mathcal{S}}_{crit}\propto \frac{1}{\sqrt{DaPe}}\quad (Da\gg Pe). & \displaystyle\end{eqnarray}$$
We can also estimate the aspect ratio
 ${\mathcal{A}}$
of the instability for the case
 ${\mathcal{S}}\ll 1$
by noting that
 $a\sim {\mathcal{S}}^{-1}$
. The ratio of horizontal to vertical length scale is approximately
 ${\mathcal{A}}\sim a/k^{\ast }$
. Substituting in the wavenumber scalings, we find
 $$\begin{eqnarray}\displaystyle & \displaystyle {\mathcal{A}}\propto ({\mathcal{S}}Da)^{-1/2}\quad (Pe\gg Da), & \displaystyle\end{eqnarray}$$
 $$\begin{eqnarray}\displaystyle & \displaystyle {\mathcal{A}}\propto ({\mathcal{S}}^{2}DaPe)^{-1/4}\quad (Da\gg Pe). & \displaystyle\end{eqnarray}$$
 ${\mathcal{S}}_{crit}$
. Thus, our assumption that vertical diffusion is negligible compared with horizontal diffusion becomes less valid as we approach
 ${\mathcal{S}}_{crit}$
. However, for the rigid-medium case
 ${\mathcal{S}}\gtrsim 1$
, the aspect ratio is always small. Furthermore, for the geologically relevant parameters considered in § 5, the aspect ratio is predicted to be small, i.e. the horizontal scale is much smaller than the vertical one.
Behaviour as
 ${\mathcal{S}}\rightarrow {\mathcal{S}}_{crit}^{+}$
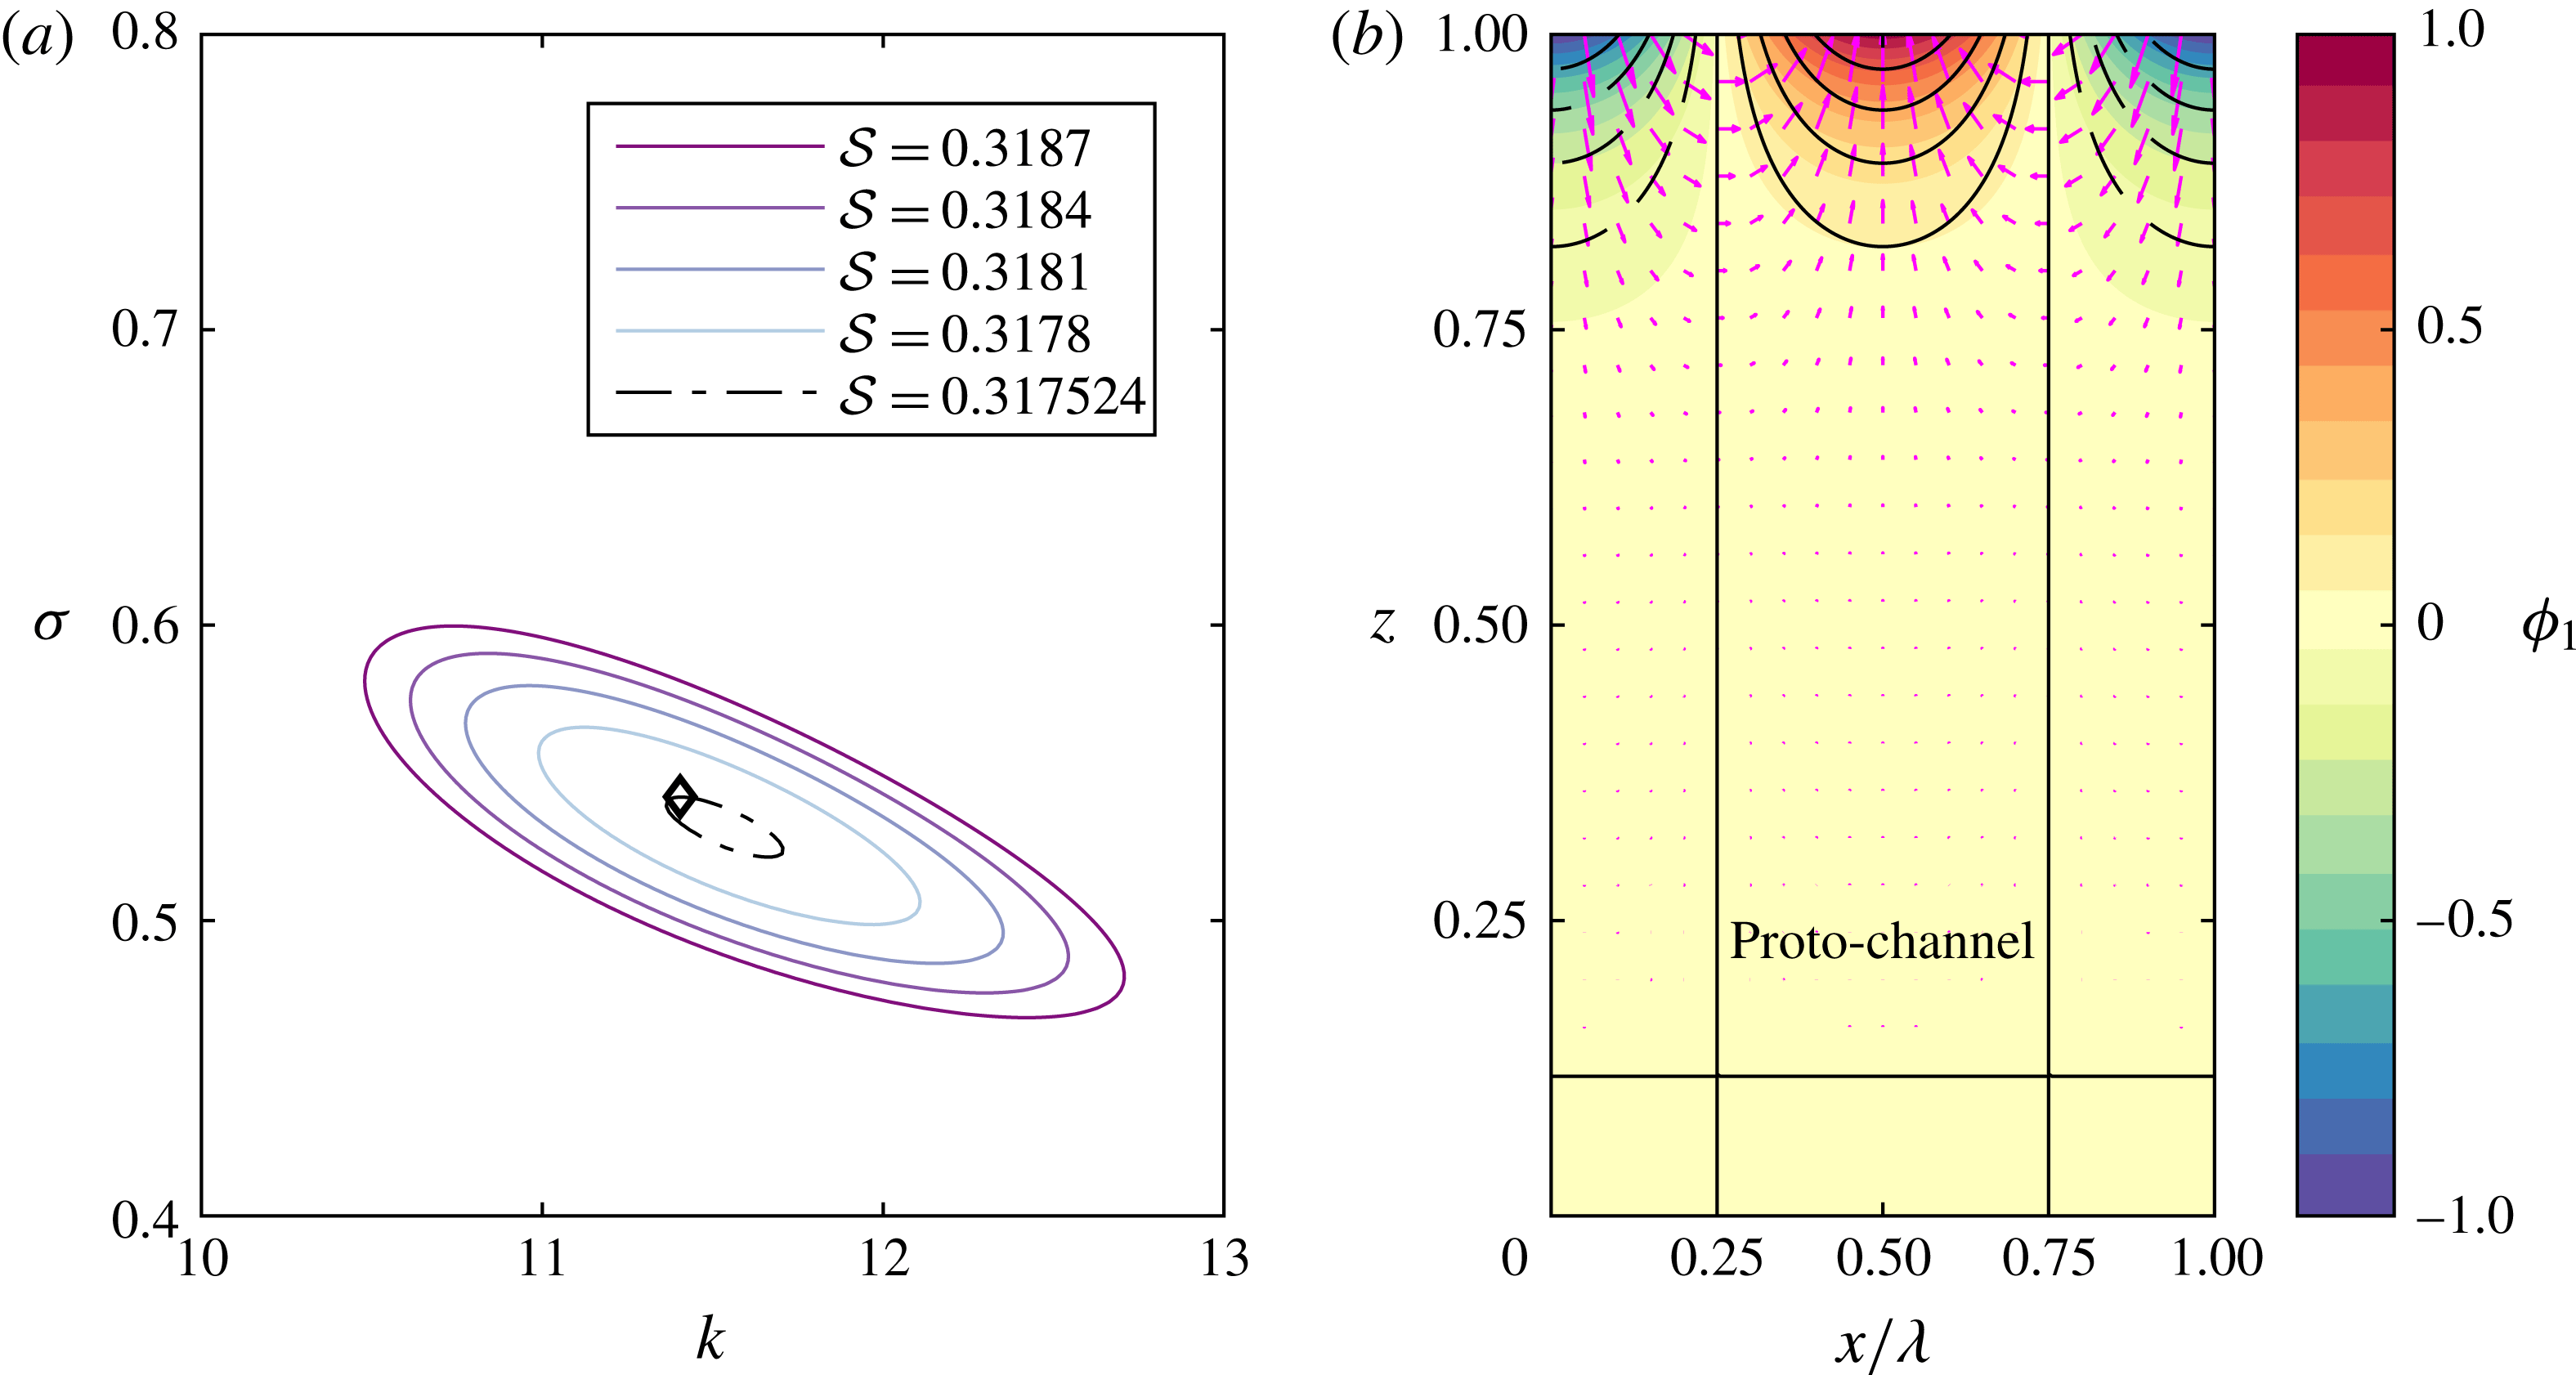
(example with
 $Da=Pe=10$
). (a) Series of closed loops in
 $(k,\unicode[STIX]{x1D70E})$
-space as
 ${\mathcal{S}}$
decreases towards the critical value (purple to light blue; black dot-dashed loop corresponds to the final iteration; method described in appendix B). (b) The porosity perturbation
 $\unicode[STIX]{x1D719}_{1}$
corresponding to the most unstable mode indicated by the diamond symbol in (a).

4.5 Numerical investigation of the critical stiffness
We next test these asymptotic predictions of a critical stiffness by numerically calculating the dispersion relationship at successive values of
 ${\mathcal{S}}\rightarrow {\mathcal{S}}_{crit}^{+}$
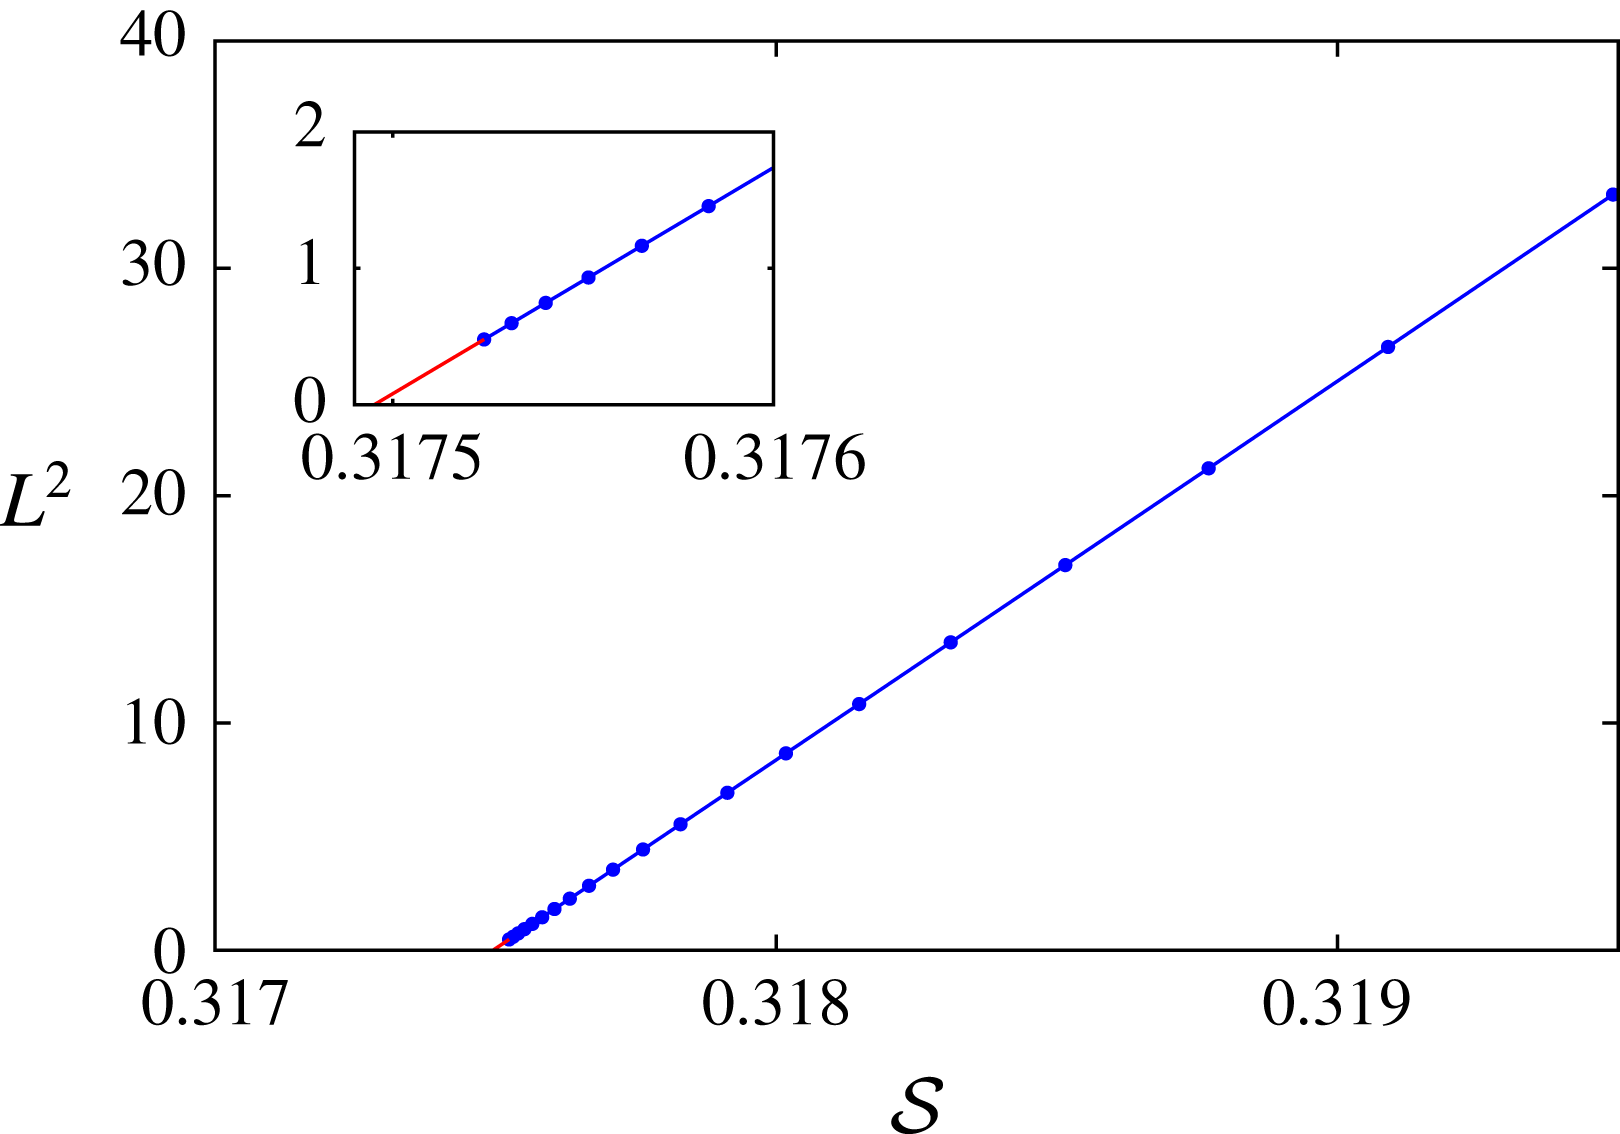
. Figure 6 shows that (a) the dispersion relationship forms closed loops whose size approaches zero, (b) the perturbation is localized in an
 $O({\mathcal{S}})$
boundary layer near the upper boundary. The latter observation is consistent with the asymptotic result that the vertical length scale
 $a^{-1}\sim {\mathcal{S}}$
. We estimate the critical value
 ${\mathcal{S}}_{crit}$
using the method described in appendix B, and map out the dependence on Damköhler number and Péclet number.
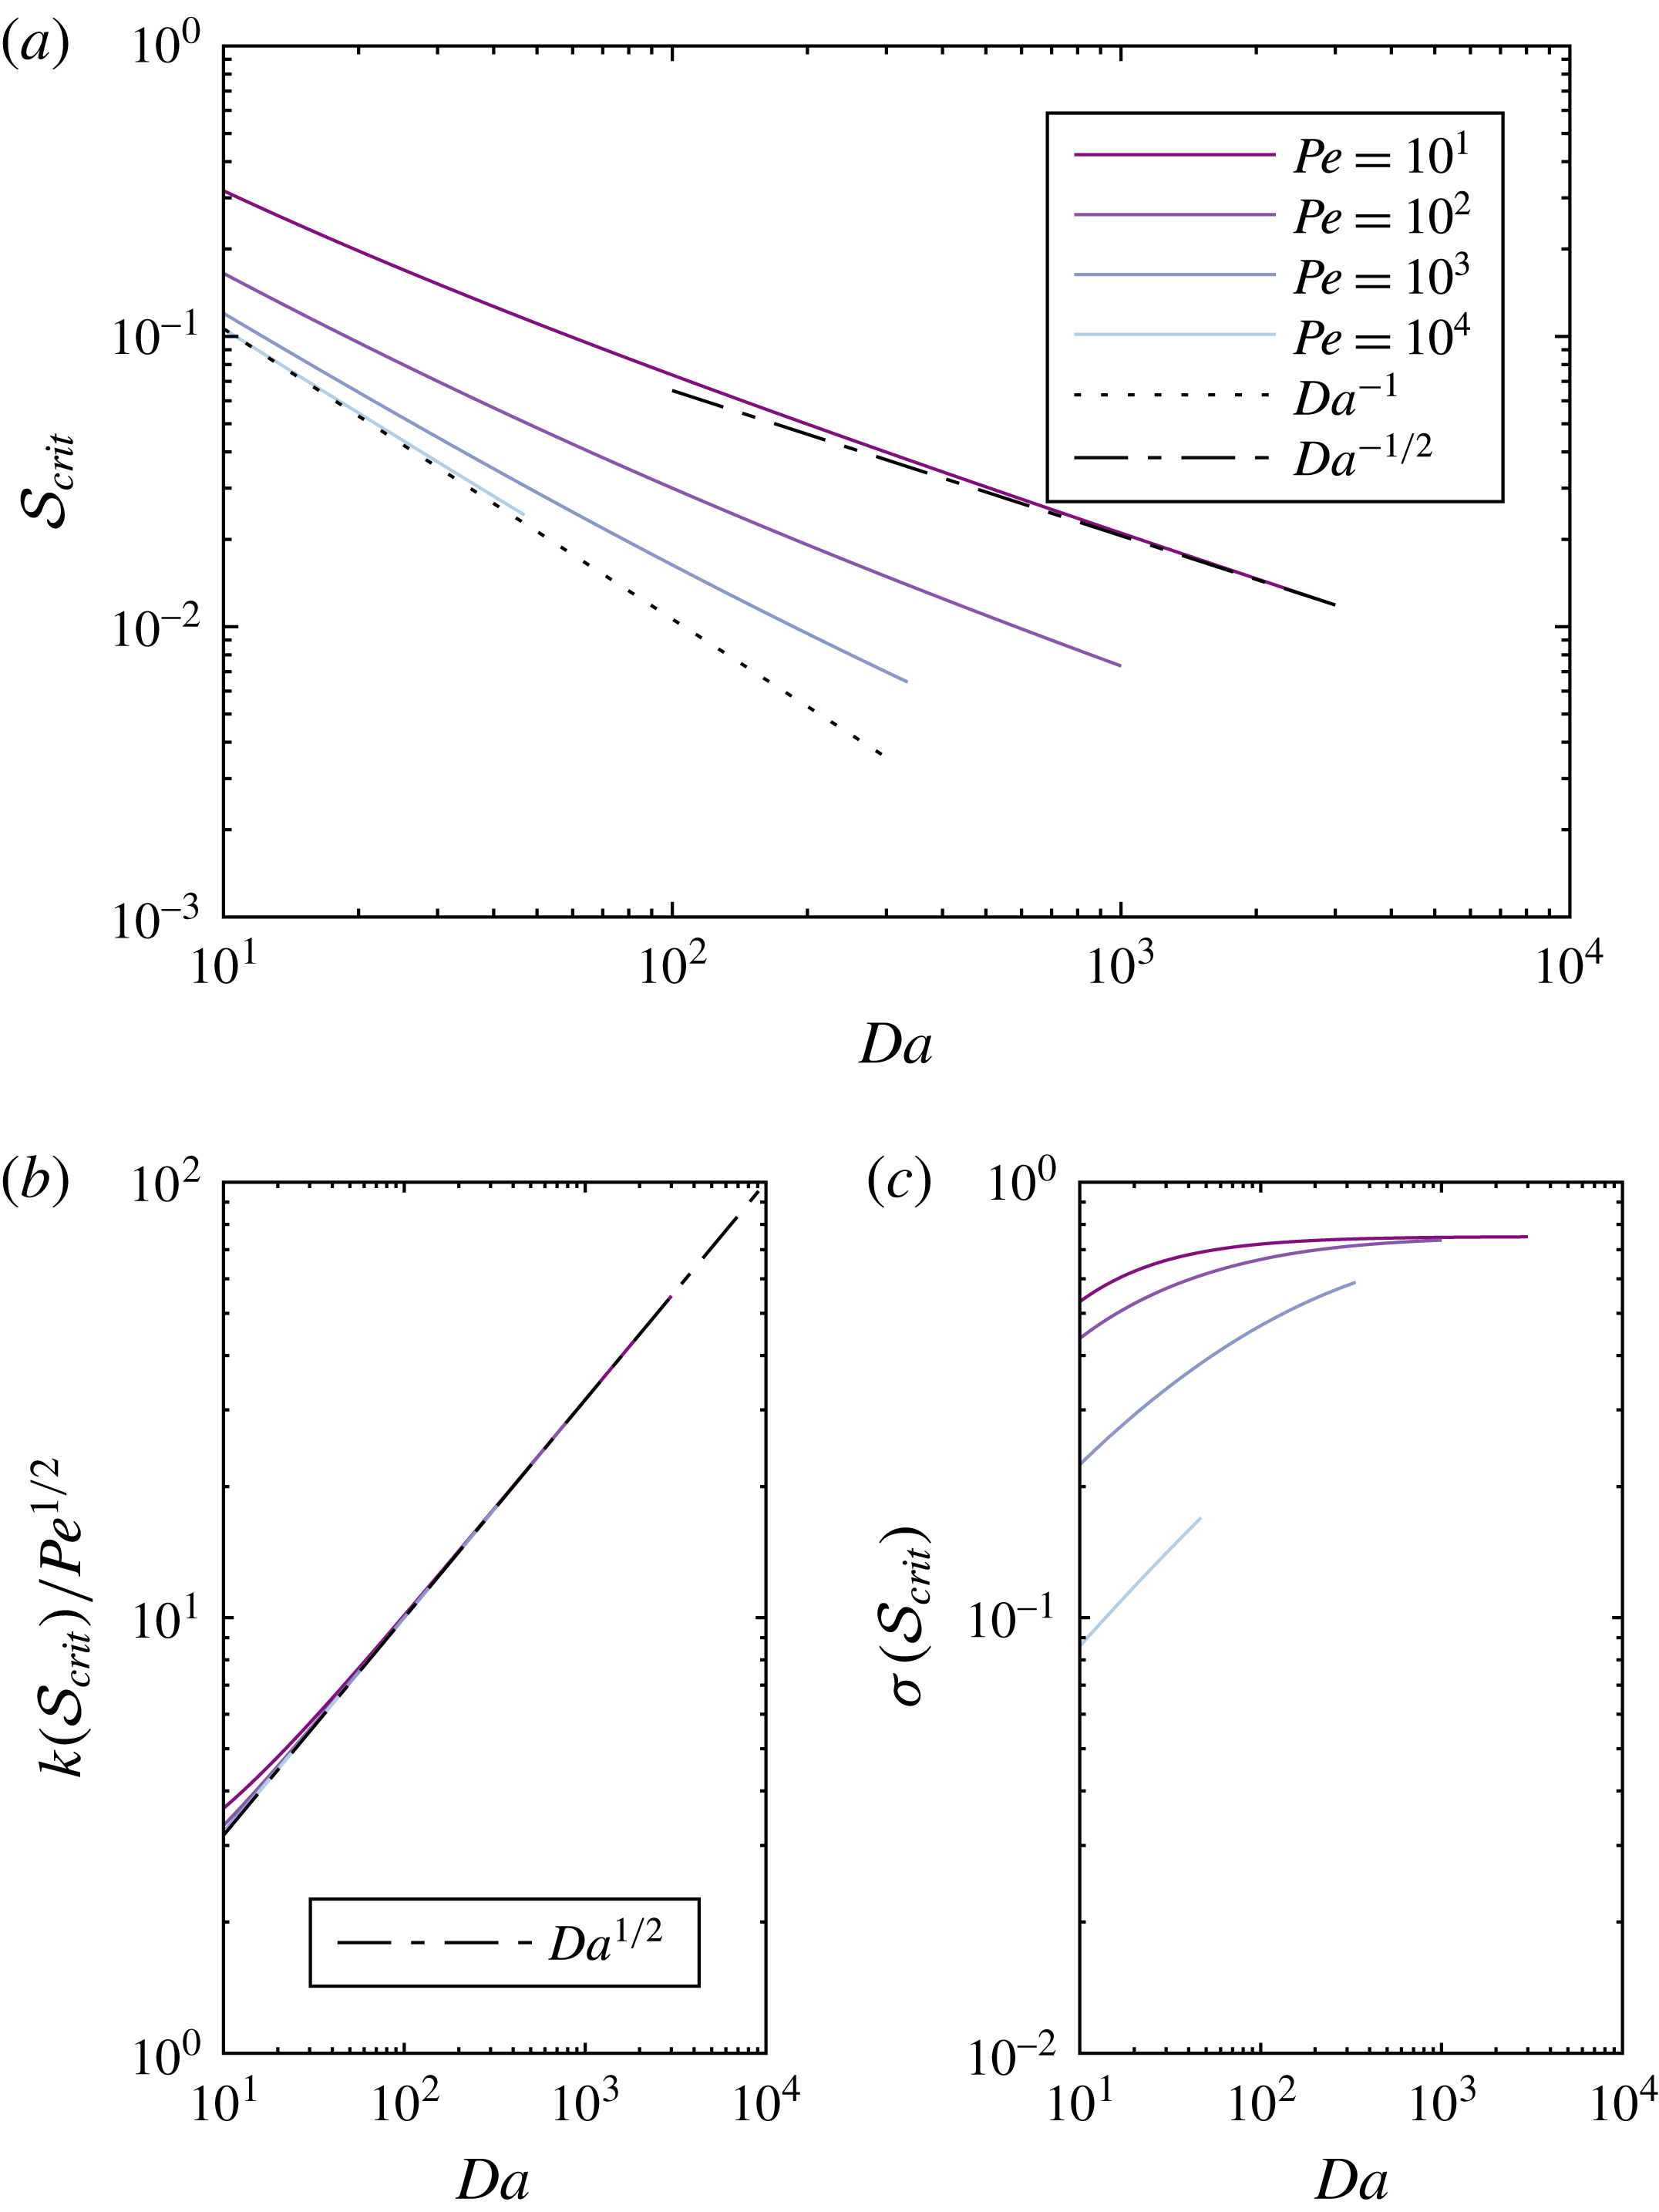
(a) The critical stiffness
 ${\mathcal{S}}_{crit}$
as a function of
 $Da$
at
 $Pe=10,10^{2},10^{3},10^{4}$
(from dark purple to light blue). We also show power-law scalings
 $Da^{-1}$
(dash-dotted) and
 $Da^{-1/2}$
(dotted). (b) The corresponding wavenumber, which obeys the scaling (4.25). (c) The corresponding growth rate, which appears to approach a constant at large
 $Da$
.

Figure 7(a) shows the dependence of
 ${\mathcal{S}}_{crit}$
on
 $Da$
at
 $Pe=10,10^{2},10^{3},10^{4}$
. The calculations with high
 $Pe$
support the prediction of (4.22a
) that
 ${\mathcal{S}}_{crit}\propto Da^{-1}$
when
 $Pe\gg Da$
. The calculations with lower
 $Pe$
support the prediction of (4.22b
) that
 ${\mathcal{S}}_{crit}\propto Da^{-1/2}$
when
 $Da\gg Pe$
; they are also consistent with the predicted
 $Pe^{-1/2}$
dependence. By estimating the prefactors numerically, we obtain the following scalings:
 $$\begin{eqnarray}\displaystyle & \displaystyle {\mathcal{S}}_{crit}\sim \frac{1}{Da}\quad (Pe\gg Da), & \displaystyle\end{eqnarray}$$
 $$\begin{eqnarray}\displaystyle & \displaystyle {\mathcal{S}}_{crit}\sim \frac{2}{\sqrt{DaPe}}\quad (Da\gg Pe). & \displaystyle\end{eqnarray}$$
 ${\mathcal{S}}=O(1)$
, although they did not obtain the other limit, (4.24b
).
Figure 7(b) shows that, across the range of parameters considered, the wavenumber at
 ${\mathcal{S}}_{crit}$
obeys the scaling
 $$\begin{eqnarray}k({\mathcal{S}}_{crit})\sim (DaPe)^{1/2}.\end{eqnarray}$$
This is the same as the scaling for the large-wavenumber cutoff when
 $Da\gg Pe$
, identified in § 4.1. However, we see in § 4.6 that a different scaling eventually emerges at higher
 $Pe$
.
Finally, figure 7(c) shows that the growth rate at
 ${\mathcal{S}}_{crit}$
appears to approach a (non-zero) constant at large
 $Da$
, which might be independent of
 $Pe$
, a hypothesis we confirm in § 4.6.
4.6 Analysis of behaviour near the critical stiffness
We now analyse the structure of the bifurcation at
 ${\mathcal{S}}_{crit}$
. Our goal is to complement the numerical results obtained previously by mapping out the bifurcation structure and obtaining asymptotic results at very large
 $Da$
and
 $Pe$
, regimes that were hard to achieve numerically.
We proceed by rescaling equations (4.8a
) and (4.8b
). As we have seen previously, there are two distinguished limits depending on the relative magnitude of
 $Da$
to
 $Pe$
.
4.6.1 Case
$Pe\gg Da\gg 1$

We first consider the case in which chemical diffusion is negligible. We use the rescaling
 $$\begin{eqnarray}\displaystyle & \displaystyle \tilde{x}=k^{2}Da^{-2}, & \displaystyle\end{eqnarray}$$
 $$\begin{eqnarray}\displaystyle & \displaystyle \tilde{a}=aDa^{-1}, & \displaystyle\end{eqnarray}$$
 $$\begin{eqnarray}\displaystyle & \displaystyle \tilde{{\mathcal{S}}}={\mathcal{S}}Da, & \displaystyle\end{eqnarray}$$
 $$\begin{eqnarray}\displaystyle & \displaystyle \tilde{\unicode[STIX]{x1D70E}}=\unicode[STIX]{x1D70E}n^{-1} & \displaystyle\end{eqnarray}$$
 ${\mathcal{K}}=1+k^{2}/DaPe=1+\tilde{x}(Da/Pe)$
, so
 ${\mathcal{K}}\sim 1$
. We also note that
 $\unicode[STIX]{x03C0}/2<b<\unicode[STIX]{x03C0}$
, so
 $b^{2}\ll a^{2}=O(Da^{2})$
. Thus, to leading order, (4.8a
) and (4.8b
) become respectively
 $$\begin{eqnarray}\displaystyle & \displaystyle \tilde{a}=\frac{(\tilde{{\mathcal{S}}}^{-1}+\tilde{\unicode[STIX]{x1D70E}}\tilde{x})}{2(\tilde{\unicode[STIX]{x1D70E}}-\tilde{{\mathcal{S}}}^{-1})}, & \displaystyle\end{eqnarray}$$
 $$\begin{eqnarray}\displaystyle & \displaystyle \tilde{a}^{2}=\frac{(1-\tilde{\unicode[STIX]{x1D70E}})\tilde{x}}{(\tilde{\unicode[STIX]{x1D70E}}-\tilde{{\mathcal{S}}}^{-1})}. & \displaystyle\end{eqnarray}$$
 $\tilde{a}$
and rearrange into a quadratic for
 $\tilde{\unicode[STIX]{x1D70E}}$
,
 $$\begin{eqnarray}\tilde{{\mathcal{S}}}^{2}\tilde{x}(4+\tilde{x})\tilde{\unicode[STIX]{x1D70E}}^{2}-2\tilde{{\mathcal{S}}}\tilde{x}(1+2\tilde{{\mathcal{S}}})\tilde{\unicode[STIX]{x1D70E}}+(1+4\tilde{x}\tilde{{\mathcal{S}}})=0.\end{eqnarray}$$
There are repeated roots when the discriminant of the quadratic is zero, corresponding to the left- and right-hand limits of the loops shown in figure 6(a). The discriminant is
 $$\begin{eqnarray}\tilde{\unicode[STIX]{x1D6E5}}=-16\tilde{x}\tilde{{\mathcal{S}}}^{2}[\tilde{x}^{2}\tilde{{\mathcal{S}}}+\tilde{x}(3\tilde{{\mathcal{S}}}-\tilde{{\mathcal{S}}}^{2})+1].\end{eqnarray}$$
Given that
 $\tilde{{\mathcal{S}}}>0$
and
 $\tilde{x}\propto k^{2}>0$
, the roots
 $\tilde{\unicode[STIX]{x1D6E5}}=0$
must satisfy the quadratic equation
 $$\begin{eqnarray}\tilde{x}^{2}\tilde{{\mathcal{S}}}+\tilde{x}(3\tilde{{\mathcal{S}}}-\tilde{{\mathcal{S}}}^{2})+1=0.\end{eqnarray}$$
The bifurcation (at the critical matrix stiffness) occurs when the discriminant of this quadratic is zero, when
 $$\begin{eqnarray}0=(3\tilde{{\mathcal{S}}}-\tilde{{\mathcal{S}}}^{2})^{2}-4\tilde{{\mathcal{S}}}=\tilde{{\mathcal{S}}}(\tilde{{\mathcal{S}}}-1)^{2}(\tilde{{\mathcal{S}}}-4).\end{eqnarray}$$
The root
 $\tilde{{\mathcal{S}}}=0$
is excluded because
 $\tilde{{\mathcal{S}}}>0$
. The roots
 $\tilde{{\mathcal{S}}}=1$
are excluded because they correspond to repeated roots
 $\tilde{x}=-1$
in (4.30). The only physically meaningful root is
 $\tilde{{\mathcal{S}}}=4$
, which corresponds to repeated roots
 $\tilde{x}=1/2$
in (4.30). We substitute back into (4.28) and find that the corresponding
 $\tilde{\unicode[STIX]{x1D70E}}=1/2$
.
This gives us the critical matrix stiffness and the corresponding properties of the solution (horizontal and vertical wavenumbers and growth rate). In summary, we find that
 $$\begin{eqnarray}{\mathcal{S}}_{crit}=4Da^{-1},\quad k_{crit}\sim Da/\sqrt{2},\quad a_{crit}\sim Da,\quad \unicode[STIX]{x1D70E}_{crit}\sim n/2\quad (Pe\gg Da\gg 1).\end{eqnarray}$$
In the numerical results (§ 4.5), we found the same
 ${\mathcal{S}}_{crit}\propto Da^{-1}$
scaling, albeit with a different prefactor. However, we did not observe the
 $k_{crit}\propto Da$
scaling (independent of
 $Pe$
), which indicates that our numerical calculations were not performed at sufficiently high
 $Pe$
to observe the asymptotic regime. Our analysis in this section allows access to that regime. Furthermore, observations such as those in figure 6 of loops emerging at finite (non-zero) values of the growth rate
 $\unicode[STIX]{x1D70E}$
emerge as generic features of the bifurcation.
4.6.2 Case
$Da\gg Pe$

We second consider the opposite case in which advection of the liquid undersaturation is negligible relative to diffusion. We apply the same type of methodology as before. We use the rescaling
 $$\begin{eqnarray}\displaystyle & \displaystyle \hat{x}=k^{2}(DaPe)^{-1}, & \displaystyle\end{eqnarray}$$
 $$\begin{eqnarray}\displaystyle & \displaystyle \hat{a}=a(DaPe)^{-1/2}, & \displaystyle\end{eqnarray}$$
 $$\begin{eqnarray}\displaystyle & \displaystyle \hat{{\mathcal{S}}}={\mathcal{S}}(DaPe)^{1/2}, & \displaystyle\end{eqnarray}$$
 $$\begin{eqnarray}\displaystyle & \displaystyle \hat{\unicode[STIX]{x1D70E}}=\unicode[STIX]{x1D70E}n^{-1} & \displaystyle\end{eqnarray}$$
 ${\mathcal{K}}=1+k^{2}/DaPe=1+\hat{x}$
. Again,
 $b^{2}\ll a^{2}=O(DaPe)$
and
 $1/Da{\mathcal{S}}\sim (Pe/Da)^{1/2}\ll 1$
. Thus, to leading order, (4.8a
) and (4.8b
) become respectively
 $$\begin{eqnarray}\displaystyle & \displaystyle \hat{a}=\frac{1}{2\hat{\unicode[STIX]{x1D70E}}\hat{{\mathcal{S}}}}, & \displaystyle\end{eqnarray}$$
 $$\begin{eqnarray}\displaystyle & \displaystyle \hat{a}^{2}=\frac{(1-\hat{\unicode[STIX]{x1D70E}}(1+\hat{x}))\hat{x}}{\hat{\unicode[STIX]{x1D70E}}(1+\hat{x})}. & \displaystyle\end{eqnarray}$$
 $\hat{\unicode[STIX]{x1D70E}}$
is,
 $$\begin{eqnarray}4\hat{{\mathcal{S}}}^{2}\hat{x}(1+\hat{x})\hat{\unicode[STIX]{x1D70E}}^{2}-4\hat{{\mathcal{S}}}^{2}\hat{x}\hat{\unicode[STIX]{x1D70E}}+(1+\hat{x})=0,\end{eqnarray}$$
whose repeated roots are zeros of the discriminant
 $$\begin{eqnarray}\hat{\unicode[STIX]{x1D6E5}}=-16\hat{x}\hat{{\mathcal{S}}}^{2}[\hat{x}^{2}+\hat{x}(2-\hat{{\mathcal{S}}}^{2})+1].\end{eqnarray}$$
Again, we have
 $\hat{{\mathcal{S}}}>0$
and
 $\hat{x}\propto k^{2}>0$
, so roots
 $\hat{\unicode[STIX]{x1D6E5}}=0$
satisfy
 $$\begin{eqnarray}\hat{x}^{2}+\hat{x}(2-\hat{{\mathcal{S}}}^{2})+1=0.\end{eqnarray}$$
The bifurcation occurs when the discriminant of this quadratic is zero, when
 $$\begin{eqnarray}0=(2-\hat{{\mathcal{S}}}^{2})^{2}-4=\hat{{\mathcal{S}}}^{2}(\hat{{\mathcal{S}}}+2)(\hat{{\mathcal{S}}}-2).\end{eqnarray}$$
The only physically meaningful root is
 $\hat{{\mathcal{S}}}=2$
, which corresponds to repeated roots
 $\hat{x}=1$
in (4.37). We substitute back into (4.35) and find that the corresponding
 $\hat{\unicode[STIX]{x1D70E}}=1/4$
. In conclusion,
 $$\begin{eqnarray}{\mathcal{S}}_{crit}=2(DaPe)^{-1/2},\quad k_{crit},a_{crit}\sim (DaPe)^{1/2},\quad \unicode[STIX]{x1D70E}_{crit}\sim n/4\quad (Da\gg Pe).\end{eqnarray}$$
In the numerical results (§ 4.5), we found the same scaling relationships (with the same prefactors), so our numerics were able to access this regime adequately. The analysis in this section additionally obtained
 $\unicode[STIX]{x1D70E}_{crit}\sim n/4$
. Therefore, in both regimes, we find that the bifurcation at
 ${\mathcal{S}}_{crit}$
results in an instability with a finite growth rate.
4.7 Physical discussion of instability mechanism (part II: wavelength selection)
In § 3.5, we explained the basic structure of the physical instability mechanism. We found that there is an enhanced vertical flux in proto-channels (regions of positive porosity perturbation) caused by the porosity-dependent permeability. This vertical flux across a background equilibrium concentration gradient dissolves the solid matrix, increasing the porosity and establishing an instability that grows at a rate
 $\unicode[STIX]{x1D70E}\sim n$
. In this section, we use the insights gained from our asymptotic analysis to explain the physical controls on the vertical and horizontal length scales of the instability, and on the critical matrix stiffness. All of the following estimates are consistent with the results of our asymptotic analysis and numerical calculations.
We derive scalings focusing on the more interesting case of a compacting porous medium (
 ${\mathcal{S}}\ll 1$
). Results for a rigid porous medium (up to an unknown prefactor) can be obtained by substituting
 ${\mathcal{S}}=1$
into the subsequent scalings, consistent with our numerical results that the rigid-medium limit applies when
 ${\mathcal{S}}\gtrsim 1$
.
First, we consider the vertical length scale of the instability at fixed horizontal wavenumber. In a compacting porous medium, mass conservation implies that gradients in porosity are sources or sinks of compaction pressure, as expressed in (3.14), which we now rewrite by substituting expressions for the base state variables,
 $$\begin{eqnarray}\unicode[STIX]{x1D6FB}^{2}{\mathcal{P}}_{1}=\frac{n}{{\mathcal{S}}}\frac{\unicode[STIX]{x2202}\unicode[STIX]{x1D719}_{1}}{\unicode[STIX]{x2202}z}.\end{eqnarray}$$
We next substitute in the balance between compaction and porosity change from (3.4a
), namely
 $\unicode[STIX]{x1D70E}\unicode[STIX]{x1D719}_{1}\sim {\mathcal{P}}_{1}$
, use
 $\unicode[STIX]{x1D70E}\sim n$
and scale
 $\unicode[STIX]{x2202}_{z}\sim m$
, neglecting horizontal derivatives at fixed
 $k$
, to obtain
 $$\begin{eqnarray}m\sim {\mathcal{S}}^{-1}.\end{eqnarray}$$
Therefore, the vertical structure is controlled by the matrix stiffness. In the rigid-medium case,
 $m\sim 1$
and the instability extends through the full depth of the melting region.
Second, we consider the horizontal length scale of the most unstable mode
 $k^{\ast }$
. We combine (3.4a
), (4.40) and (4.41) to obtain the estimate
 $$\begin{eqnarray}-k^{\ast 2}{\mathcal{P}}_{1}\sim \unicode[STIX]{x1D712}_{1}/{\mathcal{S}}^{2}.\end{eqnarray}$$
Physically, reactive dissolution in the channels requires a convergent flow of liquid into the proto-channels, which must be down a gradient in the compaction pressure. Then, by substituting (3.4a ) and (3.4c ) into the liquid concentration equation (3.4d ), we find that
 $$\begin{eqnarray}{\mathcal{S}}\frac{\unicode[STIX]{x2202}{\mathcal{P}}_{1}}{\unicode[STIX]{x2202}z}-{\mathcal{P}}_{1}\sim -\frac{1}{Da}\frac{\unicode[STIX]{x2202}\unicode[STIX]{x1D712}_{1}}{\unicode[STIX]{x2202}z}+\frac{1}{DaPe}\frac{\unicode[STIX]{x2202}^{2}\unicode[STIX]{x1D712}_{1}}{\unicode[STIX]{x2202}x^{2}}.\end{eqnarray}$$
Both terms on the left-hand side are
 $O({\mathcal{P}}_{1})$
. When
 $Pe\gg Da$
, diffusion on the right-hand side is negligible compared with advection of the liquid undersaturation. Then, by substituting (4.42), we find
 $$\begin{eqnarray}k^{\ast 2}\sim \frac{Da}{{\mathcal{S}}}\quad (Pe\gg Da).\end{eqnarray}$$
Conversely, if
 $Da\gg Pe$
, diffusion dominates the right-hand side of (4.43) and we find
 $$\begin{eqnarray}k^{\ast 2}\sim \frac{\sqrt{DaPe}}{{\mathcal{S}}}\quad (Da\gg Pe).\end{eqnarray}$$
Physically, the perturbed compaction-driven advection against the equilibrium concentration gradient is balanced by either advection or diffusion of liquid undersaturation. These results mean that the most unstable horizontal wavelength is proportional to the compaction length (it should be recalled that
 ${\mathcal{S}}\propto \unicode[STIX]{x1D6FF}^{2}$
). However, it is much smaller than the compaction length since
 $Da\gg 1$
, as seen in the 2D numerical calculations of Spiegelman et al. (Reference Spiegelman, Kelemen and Aharonov2001).
Third, if the matrix stiffness
 ${\mathcal{S}}$
is reduced below some critical value, then the stabilizing influence of compaction is dominant over the destabilizing influence of reactive melting such that the instability is suppressed. We can obtain an estimate of this critical value as follows. At the critical value, (3.4a
) gives that compaction balances reaction, so
 $-{\mathcal{P}}_{1}\sim \unicode[STIX]{x1D712}_{1}$
. We next use (3.12) to obtain
 $-{\mathcal{P}}_{1}\sim nw_{0}\unicode[STIX]{x1D719}_{1}$
. We substitute into (3.14) to obtain
 $$\begin{eqnarray}{\mathcal{S}}_{crit}\sim m/k^{\ast 2}.\end{eqnarray}$$
We then substitute in our estimates of the vertical (
 $m$
) and horizontal (
 $k^{\ast }$
) wavenumbers to obtain
 $$\begin{eqnarray}\displaystyle & \displaystyle {\mathcal{S}}_{crit}\sim \frac{1}{Da}\quad (Pe\gg Da), & \displaystyle\end{eqnarray}$$
 $$\begin{eqnarray}\displaystyle & \displaystyle {\mathcal{S}}_{crit}\sim \frac{1}{\sqrt{DaPe}}\quad (Da\gg Pe). & \displaystyle\end{eqnarray}$$
 $$\begin{eqnarray}k_{min}^{2}\sim m/{\mathcal{S}}\sim 1/{\mathcal{S}}^{2}\quad \Rightarrow \quad k_{min}\sim 1/{\mathcal{S}}.\end{eqnarray}$$
Thus, the maximum wavelength for the instability is proportional to
 $\unicode[STIX]{x1D6FD}\unicode[STIX]{x1D6FF}^{2}/\unicode[STIX]{x1D6FC}$
, the product of the compaction length and the amount of reactive melting over a compaction length. In the rigid-medium limit (
 ${\mathcal{S}}\gg 1$
), the vertical wavelength is the full height of the domain (
 $m\sim 1$
). Thus,
 $$\begin{eqnarray}k_{min}^{2}\sim m/{\mathcal{S}}\sim 1/{\mathcal{S}}\quad \Rightarrow \quad k_{min}\sim 1/{\mathcal{S}}^{1/2}.\end{eqnarray}$$
5 Geological discussion
Geologically significant predictions of this model include the conditions under which the reaction-infiltration instability occurs and the size and spacing of the resulting channels. We found earlier that the length scale of the reaction-infiltration instability can be limited by either advection or diffusion. To cover both of these regimes, it is instructive to introduce a reactive length scale
 $L_{eq}$
,
 $$\begin{eqnarray}L_{eq}=\left\{\begin{array}{@{}ll@{}}\displaystyle L_{w}\equiv \frac{\unicode[STIX]{x1D719}_{0}w_{0}}{\unicode[STIX]{x1D6FC}R}, & Pe\gg Da\text{ (advection-controlled)},\\ \displaystyle L_{D}\equiv 2\left(\frac{\unicode[STIX]{x1D719}_{0}D}{\unicode[STIX]{x1D6FC}R}\right)^{1/2}, & Da\gg Pe\text{ (diffusion-controlled)}.\end{array}\right.\end{eqnarray}$$
Here,
 $L_{w}$
is the distance a chemical component is transported by the background liquid flow over the reaction time scale and
 $L_{D}$
is the distance a chemical component can diffuse in the liquid over the reaction time scale. The factor of 2 is introduced to simplify the dimensional estimates given later in this section. The length scale
 $L_{eq}$
is a generalization of the length scale introduced by Aharonov et al. (Reference Aharonov, Whitehead, Kelemen and Spiegelman1995). The condition for the advection-controlled instability (rather than the diffusion-controlled case) is
 $Pe\gg Da$
. This is equivalent to the statement
 $L_{D}\ll L_{w}$
, and thus
 $L_{eq}\sim \max (L_{w},L_{D})$
. With this definition, the most unstable wavelength
 $\unicode[STIX]{x1D706}^{\ast }$
for the instability can be written as
 $$\begin{eqnarray}\unicode[STIX]{x1D706}^{\ast }=\left\{\begin{array}{@{}ll@{}}\displaystyle 2\unicode[STIX]{x03C0}\unicode[STIX]{x1D706}_{c}(L_{eq}H)^{1/2}, & {\mathcal{S}}\gtrsim 1,\\ \displaystyle 2\unicode[STIX]{x03C0}\unicode[STIX]{x1D6FF}(L_{eq}\unicode[STIX]{x1D6FD}/\unicode[STIX]{x1D6FC})^{1/2}, & {\mathcal{S}}\ll 1.\end{array}\right.\end{eqnarray}$$
In the former equation, we introduced a prefactor
 $\unicode[STIX]{x1D706}_{c}$
that, as
 ${\mathcal{S}}\rightarrow \infty$
, satisfies
 $\unicode[STIX]{x1D706}_{c}\rightarrow 0.5268$
in the case
 $Pe\gg Da$
and
 $\unicode[STIX]{x1D706}_{c}\rightarrow \unicode[STIX]{x03C0}^{-1/2}\approx 0.5642$
in the case
 $Da\gg Pe$
. It should be noted that if the reaction rate were infinitely fast (i.e. if the liquid chemistry were at equilibrium), then the equilibrium length scale would be zero and the channels would be arbitrarily small. This potentially explains why channels localize to the grid scale in some numerical calculations based on equilibrium formulations (for example Hewitt Reference Hewitt2010).
The vertical length scale of the instability
 $\unicode[STIX]{x1D706}_{v}$
is approximately
 $$\begin{eqnarray}\unicode[STIX]{x1D706}_{v}\sim \left\{\begin{array}{@{}ll@{}}\displaystyle H, & {\mathcal{S}}\gtrsim 1,\\ \displaystyle \unicode[STIX]{x1D6FF}^{2}\unicode[STIX]{x1D6FD}/\unicode[STIX]{x1D6FC}, & {\mathcal{S}}\ll 1.\end{array}\right.\end{eqnarray}$$
Thus, the channels occupy the full depth of the melting region in the case of a rigid medium (
 ${\mathcal{S}}\gtrsim 1$
) and have a length proportional to the square of the compaction length when
 ${\mathcal{S}}\ll 1$
. The condition
 ${\mathcal{S}}\ll 1$
delineates the compaction-limited instability. In dimensional terms,
 $$\begin{eqnarray}{\mathcal{S}}\ll 1\quad \Leftrightarrow \quad \unicode[STIX]{x1D6FF}\ll \left(\frac{\unicode[STIX]{x1D6FC}H}{\unicode[STIX]{x1D6FD}}\right)^{1/2}.\end{eqnarray}$$
We also identified the critical condition for the instability to occur. This condition can be written in terms of a critical compaction length
 $\unicode[STIX]{x1D6FF}_{crit}$
and the reaction length
 $L_{eq}$
,
 $$\begin{eqnarray}\unicode[STIX]{x1D6FF}>\unicode[STIX]{x1D6FF}_{crit}\propto \left(\frac{\unicode[STIX]{x1D6FC}L_{eq}}{\unicode[STIX]{x1D6FD}}\right)^{1/2}.\end{eqnarray}$$
It should be noted that Aharonov et al. (Reference Aharonov, Whitehead, Kelemen and Spiegelman1995) claim that the instability occurs when the compaction length is much larger than the reaction length. Equation (5.5) shows that the relevant length scale is
 $(\unicode[STIX]{x1D6FC}L_{eq}/\unicode[STIX]{x1D6FD})^{1/2}$
, which depends on both the reaction length
 $L_{eq}$
and also the solubility gradient
 $\unicode[STIX]{x1D6FD}$
. Indeed, the numerical results of Aharonov et al. (Reference Aharonov, Whitehead, Kelemen and Spiegelman1995) are consistent with (5.5).
We now seek to identify the region in parameter space relevant for the partially molten upper mantle. We provide geologically plausible parameter values in table 1. Using the central estimates of these parameters, the dimensionless parameters considered previously can be estimated as follows: Damköhler and Péclet numbers
 $Da\approx Pe\approx 8\times 10^{7}$
, reactivity
 ${\mathcal{M}}\approx 0.16$
and matrix stiffness
 ${\mathcal{S}}\approx 2.5\times 10^{-5}$
, consistent with our asymptotic approximations
 $Da,Pe\gg 1$
,
 ${\mathcal{M}}\ll 1$
. The aspect ratio of the most unstable mode is
 ${\mathcal{A}}\approx 0.02$
, consistent with our assumption that the channels are much narrower in the horizontal than in the vertical.
Returning to dimensional units, if
 $H=80~\text{km}$
(the total depth of the primary melting region; melting may occur deeper in the presence of volatile species),
 $\unicode[STIX]{x1D6FD}=2\times 10^{-6}~\text{m}^{-1}$
(Aharonov et al.
Reference Aharonov, Whitehead, Kelemen and Spiegelman1995) and
 $\unicode[STIX]{x1D6FC}\approx 1$
, then
 $(\unicode[STIX]{x1D6FC}H/\unicode[STIX]{x1D6FD})^{1/2}\approx 200~\text{km}$
. The compaction length is typically smaller than this in the mantle, so the instability is likely to be limited by compaction, rather than the total height
 $H$
. For the compaction-limited instability
 $({\mathcal{S}}\ll 1)$
, the most unstable wavelength is proportional to the compaction length and the square root of the amount of chemical disequilibrium that occurs over the height
 $L_{eq}$
. The case of the rigid medium is rather different. Here, the most unstable wavelength is the geometric mean of
 $L_{eq}$
and the total height
 $H$
, and is independent of the solubility gradient
 $\unicode[STIX]{x1D6FD}$
.
Estimates of parameter values with units specified (where relevant), following Aharonov et al. (Reference Aharonov, Whitehead, Kelemen and Spiegelman1995) as far as possible. For some variables, we consider a range of values to illustrate the range of possible behaviours. This reflects both uncertainty in the parameters themselves and differences between geological settings. The extreme uncertainty in
 $R$
reflects uncertainty in the linear chemical dissolution rate and the internal surface area available for reaction. The estimate of
 $\unicode[STIX]{x1D6FD}$
is based on thermodynamic calculations (Kelemen et al.
Reference Kelemen, Whitehead, Aharonov and Jordahl1995b
).

Based on the range of parameter values in table 1, we suggest that
 $5\times 10^{-8}\leqslant L_{w}\leqslant 20~\text{m}$
and
 $6\times 10^{-6}\leqslant L_{D}\leqslant 0.6~\text{m}$
. The overlap of these ranges suggests that both cases of advection- and diffusion-controlled instability are geologically relevant. In either case,
 $6\times 10^{-6}\leqslant L_{eq}\leqslant 20~\text{m}$
. The corresponding range of critical compaction length is
 $2\leqslant \unicode[STIX]{x1D6FF}_{crit}\leqslant 3\times 10^{3}~\text{m}$
. If the reaction is fast (
 $L_{w}$
is small, so
 $L_{eq}$
and
 $\unicode[STIX]{x1D6FF}_{crit}$
are small), the critical compaction length is probably below the compaction length in the mantle (perhaps 300 m to 10 km) and the instability occurs. However, if the reaction is slow (
 $L_{w}$
and hence
 $L_{eq}$
and
 $\unicode[STIX]{x1D6FF}_{crit}$
are large), the critical compaction length may be less than the compaction length, which would suppress the instability. The assumption that the geological observations support channelization allows us to estimate a lower bound on the reaction rate. We estimate a minimum reaction rate of
 $R_{min}\approx \unicode[STIX]{x1D719}_{0}w_{0}/\unicode[STIX]{x1D6FD}\unicode[STIX]{x1D6FF}^{2}\approx 1.5\times 10^{-11}~\text{s}^{-1}$
based on the central parameter estimates in table 1 (and a range
 $R_{min}\approx 3\times 10^{-14}{-}2\times 10^{-9}~\text{s}^{-1}$
).
We next estimate the dominant wavelength. If the instability does occur, it is most unstable at a wavelength that is smaller than the compaction length by a factor
 $2\unicode[STIX]{x03C0}(L_{eq}\unicode[STIX]{x1D6FD}/\unicode[STIX]{x1D6FC})^{1/2}$
, where
 $1.5\times 10^{-5}\leqslant 2\unicode[STIX]{x03C0}(L_{eq}\unicode[STIX]{x1D6FD}/\unicode[STIX]{x1D6FC})^{1/2}\leqslant 5.5\times 10^{-2}$
. Thus, the wavelength of the most unstable mode is much smaller than a compaction length. For example, a compaction length of 1 km would have a preferred spacing of 1.5 cm–55 m. However, the upper end of this estimate corresponding to high
 $L_{eq}$
has a critical compaction length of approximately 2 km, so the instability would be suppressed. Taking this into account, the largest wavelength expected would be around 25 m. As another example, a compaction length of 10 km would have a preferred spacing of 15 cm–550 m; the critical compaction length is exceeded throughout the range. The even larger estimates of Aharonov et al. (Reference Aharonov, Whitehead, Kelemen and Spiegelman1995) are associated with the limit of a rigid medium,
 ${\mathcal{S}}\gtrsim 1$
, which is probably less geologically relevant.
Summary of dimensional predictions. (a) The physical compaction length
 $\unicode[STIX]{x1D6FF}$
(units m) is generally larger than the critical value
 $\unicode[STIX]{x1D6FF}_{crit}$
(solid black line), allowing an instability to occur (the darker shaded region). At slower reaction rate
 $R$
(units
 $\text{s}^{-1}$
), the instability may not occur (the lighter shaded region). The diamond marker indicates the transition from advection- to diffusion-controlled instability, which occurs around
 $R=10^{-8}~\text{s}^{-1}$
. (b) The most unstable wavelength shown across a physically plausible range of compaction length. The light grey shaded region indicates where the instability is not predicted to occur, as in (a). Unless varied, we use the central estimates of parameter values listed in table 1.

Figure 8 summarizes the geological implications of our results. Figure 8(a) shows that the reaction-infiltration instability occurs robustly across a large part of the plausible parameter space (the dark grey region in (a) covers most of the range of compaction length expected in the upper mantle). The instability is suppressed by small compaction length and slow reaction rate. It is also suppressed by a high background melt flux (not shown in figure 8), because the equilibrium length
 $L_{eq}$
increases with melt flux. Figure 8(b) shows the predicted horizontal spacing of reactively dissolved channels. Where the instability occurs, we expect it to result in channelized flow on a scale ranging from centimetres to hundreds of metres, a range that is consistent with field observations of reactively dissolved channels (Braun & Kelemen Reference Braun and Kelemen2002).
There are additional physical mechanisms, excluded from the present model, that may affect the reaction-infiltration instability. First, a greater degree of complexity in the thermodynamic modelling might be important (Hewitt Reference Hewitt2010). For example, volatile chemical species are thought to promote channelized magma flow (Keller & Katz Reference Keller and Katz2016), and magma flow can alter the temperature structure (Rees Jones et al. Reference Rees Jones, Katz, Tian and Rudge2018). Second, variation in the background vertical magma flux and solubility gradient (Kelemen et al. Reference Kelemen, Whitehead, Aharonov and Jordahl1995b ) with depth are very likely to be important, since these drive the instability and control its characteristics. Third, rheology also significantly affects the instability. Indeed, Hewitt (Reference Hewitt2010) used a variable compaction viscosity that suppressed instability, as observed numerically by Spiegelman et al. (Reference Spiegelman, Kelemen and Aharonov2001). We discuss this important issue in appendix C. Furthermore, it is plausible that reactive channelization is modified by large-scale shear deformation through a viscous feedback (Stevenson Reference Stevenson1989; Holtzman et al. Reference Holtzman, Groebner, Zimmerman, Ginsberg and Kohlstedt2003). Fourth, the nonlinear development of the instability and other finite-amplitude effects in the form of chemical and lithological heterogeneity of the mantle may be significant (Katz & Weatherley Reference Katz and Weatherley2012; Weatherley & Katz Reference Weatherley and Katz2012). Such heterogeneity may be important because the growth rate of the linear reaction-infiltration instability is relatively slow (Spiegelman et al. Reference Spiegelman, Kelemen and Aharonov2001).
Speculations regarding the potential consequences of a linear variation in solubility gradient
 $\unicode[STIX]{x1D6FD}$
and magma flux
 $\unicode[STIX]{x1D719}_{0}w_{0}$
with depth, shown in (a). In (b), we show that the number of channels per unit width decreases at shallower depths. We use the central estimates of parameter values listed in table 1, except in the curve marked ‘fast reaction rate’ (
 $R=10^{-10}~\text{s}^{-1}$
). The deepest part of the domain is always stable, although this is only visible in the case of a fast reaction rate (plotted as a dashed part of the curve). This figure is intended to be interpreted qualitatively, so we do not number the horizontal axis.

We believe that these mechanisms merit detailed study. However, to speculate about the second of these, we consider a hypothetical situation where the background melt flux and solubility gradient both increase linearly in
 $z$
, as shown in figure 9(a). Then, our prediction (5.2) gives an estimate of the corresponding most unstable wavelength, shown in figure 9(b). We find that there are no channels in the deepest part of the domain; channels emerge at shallower depth and progressively coarsen, perhaps due to channel coalescence. Channel coalescence also occurs in two-dimensional numerical calculations (Spiegelman et al.
Reference Spiegelman, Kelemen and Aharonov2001), even with a constant solubility gradient, due to the nonlinear development of the instability. It seems worthwhile to investigate further numerically.
Acknowledgements
The authors thank M. Spiegelman, J. Rudge, D. Hewitt, I. Hewitt, A. Fowler and M. Hesse for helpful discussions. We thank P. Kelemen and an anonymous referee for constructive reviews. D.W.R.J. acknowledges research funding through the NERC Consortium grant NE/M000427/1. The research of R.F.K. leading to these results has received funding from the European Research Council under the European Union’s Seventh Framework Programme (FP7/2007–2013)/ERC grant agreement number 279925. We thank the Isaac Newton Institute for Mathematical Sciences for its hospitality during the programme Melt in the Mantle, which was supported by EPSRC grant no. EP/K032208/1. We also thank the Deep Carbon Observatory of the Sloan Foundation.
Appendix A. Minimum and maximum wavenumbers
The minimum and maximum wavenumbers for instability can be analysed by considering (4.5) and (4.8), which we reproduce here,
 $$\begin{eqnarray}\left.\begin{array}{@{}c@{}}\displaystyle 0=\tan b+b/a,\\ \displaystyle a=\frac{\displaystyle \left(\frac{n{\mathcal{K}}}{{\mathcal{S}}}+\frac{\unicode[STIX]{x1D70E}}{Da}k^{2}\right)}{\displaystyle 2\left(\unicode[STIX]{x1D70E}{\mathcal{K}}-\frac{n}{Da{\mathcal{S}}}\right)},\\ \displaystyle b^{2}+a^{2}=\frac{(n-\unicode[STIX]{x1D70E}{\mathcal{K}})k^{2}}{\displaystyle \left(\unicode[STIX]{x1D70E}{\mathcal{K}}-\frac{n}{Da{\mathcal{S}}}\right)}.\end{array}\right\}\end{eqnarray}$$
Previously, we assumed that
 $\unicode[STIX]{x1D70E}\sim n$
, but this assumption can break down near the minimum or maximum wavenumbers. Instead, we make the assumption
 $\unicode[STIX]{x1D70E}{\mathcal{K}}\gg n/Da{\mathcal{S}}$
, such that
 $n/Da{\mathcal{S}}$
can be neglected in the denominators. We verify this assumption post hoc. Then,
 $$\begin{eqnarray}\displaystyle & \displaystyle a=\left(\frac{n}{\unicode[STIX]{x1D70E}}\frac{1}{2{\mathcal{S}}}+\frac{k^{2}}{2Da{\mathcal{K}}}\right), & \displaystyle\end{eqnarray}$$
 $$\begin{eqnarray}\displaystyle & \displaystyle b^{2}+a^{2}=\left(\frac{n}{\unicode[STIX]{x1D70E}{\mathcal{K}}}-1\right)k^{2}. & \displaystyle\end{eqnarray}$$
 $n/\unicode[STIX]{x1D70E}$
between these equations,
 $$\begin{eqnarray}b^{2}+a^{2}=\left(\frac{2a{\mathcal{S}}}{{\mathcal{K}}}-\frac{{\mathcal{S}}k^{2}}{Da{\mathcal{K}}^{2}}-1\right)k^{2}.\end{eqnarray}$$
We now simplify these equations for the cases of small and large wavenumber
 $k$
. First, when
 $k$
is small, we assume that
 $k^{2}\ll DaPe$
(so
 ${\mathcal{K}}\sim 1$
) and
 $k^{2}\ll Da/{\mathcal{S}}$
, which again we verify post hoc. Then, (A 3) becomes
 $$\begin{eqnarray}b^{2}+a^{2}\sim (2a{\mathcal{S}}-1)k^{2}\quad \Rightarrow \quad k^{2}=\frac{b^{2}\,\text{cosec}^{2}b}{-2{\mathcal{S}}b\cot b-1}.\end{eqnarray}$$
It should be noted that
 $\unicode[STIX]{x03C0}/2<b<\unicode[STIX]{x03C0}$
, so
 $\cot b<0$
. The minimum wavenumber corresponds to the turning point
 $\text{d}k/\text{d}b=0$
. With some algebra, it is possible to show that this occurs when
 $$\begin{eqnarray}1-b\cot b+{\mathcal{S}}b[\cot b+b(1-\cot ^{2}b)]=0.\end{eqnarray}$$
There is a unique solution
 $b_{c}$
to this algebraic equation in
 $\unicode[STIX]{x03C0}/2<b<\unicode[STIX]{x03C0}$
.
When
 ${\mathcal{S}}\gg 1$
(rigid medium),
 $b_{c}$
satisfies
 $\cot b+b(1-\cot ^{2}b)=0$
. We find
 $b_{c}\approx 2.2467$
, the corresponding
 $a_{c}\approx 1.8017$
and
 $$\begin{eqnarray}k_{min}\sim \frac{1.5171}{{\mathcal{S}}^{1/2}},\quad \unicode[STIX]{x1D70E}(k_{min})\sim 0.2775\frac{n}{{\mathcal{S}}}\quad ({\mathcal{S}}\gg 1).\end{eqnarray}$$
This means that the instability operates at increasingly long wavelength as the matrix rigidity increases. Conversely, compaction stabilizes the long-wavelength limit (Aharonov et al. Reference Aharonov, Whitehead, Kelemen and Spiegelman1995).
When
 ${\mathcal{S}}\ll 1$
(compactible medium),
 $b_{c}$
satisfies
 $a\equiv -b\cot (b)=1/{\mathcal{S}}$
and we find
 $$\begin{eqnarray}\quad k_{min}\sim \frac{1}{{\mathcal{S}}},\quad \unicode[STIX]{x1D70E}(k_{min})=\frac{n}{2}\quad ({\mathcal{S}}\ll 1).\end{eqnarray}$$
We substitute all of the results back into the assumptions we made and can show that they hold for sufficiently large
 $Da$
and
 $Pe$
. More precisely, when
 ${\mathcal{S}}\gg 1$
, we need
 ${\mathcal{S}}DaPe\gg 1$
and
 $Da\gg 1$
; when
 ${\mathcal{S}}\ll 1$
, we need
 ${\mathcal{S}}^{2}DaPe\gg 1$
and
 ${\mathcal{S}}Da\gg 1$
.
Finally, we consider the large-wavenumber limit. Here, we assume
 $k^{2}\gg DaPe$
(so
 ${\mathcal{K}}\sim k^{2}/DaPe$
),
 $a\gg b$
(since
 $b<\unicode[STIX]{x03C0}$
) and
 $k^{2}\gg SDaPe^{2}$
. Then, (A 3) becomes
 $$\begin{eqnarray}a^{2}=\left(\frac{2a{\mathcal{S}}DaPe}{k^{2}}-1\right)k^{2}\quad \Rightarrow \quad k^{2}=2a{\mathcal{S}}DaPe-a^{2}.\end{eqnarray}$$
The maximum wavenumber corresponds to
 $\text{d}k/\text{d}a=0$
, i.e. when
 $a={\mathcal{S}}DaPe$
, and so
 $$\begin{eqnarray}k_{max}\sim {\mathcal{S}}DaPe,\quad \unicode[STIX]{x1D70E}(k_{max})=\frac{n}{2}\frac{1}{{\mathcal{S}}^{2}DaPe}.\end{eqnarray}$$
This means that compaction stabilizes the system at large wavenumber (Aharonov et al.
Reference Aharonov, Whitehead, Kelemen and Spiegelman1995). Indeed, there is no maximum wavenumber for a rigid medium, instantaneous reaction and/or zero diffusion (infinite
 ${\mathcal{S}}$
,
 $Da$
and/or
 $Pe$
respectively). However, the growth rate at large
 $k$
would be infinitesimal. We check all of the assumptions that we made and can show that they hold, provided that
 ${\mathcal{S}}Da\gg 1$
.
Appendix B. Numerical determination of critical matrix stiffness
When
 ${\mathcal{S}}$
is sufficiently close to the critical value, the most unstable mode is part of a dispersion curve that forms a closed loop. The size of this loop approaches zero as
 ${\mathcal{S}}\rightarrow {\mathcal{S}}_{crit}^{+}$
. If we define
 $L({\mathcal{S}})$
as the length of the loop, then we find numerically that
 $$\begin{eqnarray}L\propto ({\mathcal{S}}-{\mathcal{S}}_{crit})^{1/2}.\end{eqnarray}$$
This behaviour is shown in figures 6(a) and 10. In § 4.6, this behaviour emerges as a generic feature of the bifurcation.
Our numerical strategy to determine
 ${\mathcal{S}}_{crit}$
is as follows. Given an initial guess
 ${\mathcal{S}}_{n}$
, we calculate
 $L({\mathcal{S}}_{n})$
. We also estimate
 $\unicode[STIX]{x2202}L/\unicode[STIX]{x2202}S$
using a simple finite difference. We then update
 $$\begin{eqnarray}{\mathcal{S}}_{n+1}={\mathcal{S}}_{n}-\frac{(1-\unicode[STIX]{x1D706})L({\mathcal{S}}_{n})}{\unicode[STIX]{x2202}L/\unicode[STIX]{x2202}S},\end{eqnarray}$$
where
 $0<\unicode[STIX]{x1D706}<1$
. This is a stabilized Newton iteration, designed to estimate
 ${\mathcal{S}}_{n+1}$
such that
 $L({\mathcal{S}}_{n+1})\approx \unicode[STIX]{x1D706}L({\mathcal{S}}_{n})$
. The iteration is fastest when
 $\unicode[STIX]{x1D706}$
is small but most reliable when
 $\unicode[STIX]{x1D706}$
is near 1, so we use
 $\unicode[STIX]{x1D706}=0.9$
. Motivated by (B 1), we next fit a straight line to the square of the length
 $L^{2}({\mathcal{S}}_{n})$
(having calculated at least eight iterates, we use a rolling window of width 8, such that earlier iterates at larger
 ${\mathcal{S}}$
are successively discarded). The intersection of this line with
 $L=0$
gives an estimate for
 ${\mathcal{S}}_{crit}$
. We iterate until the estimate converges to some small prescribed tolerance (
 $10^{-8}$
). We also calculate the centre of the loop in
 $(k,\unicode[STIX]{x1D70E})$
-space and extrapolate to
 ${\mathcal{S}}_{crit}$
. Parameter continuation is then used to map out
 ${\mathcal{S}}_{crit}(Da,Pe)$
. This method is robust provided that the estimate for
 ${\mathcal{S}}$
is sufficiently close to the critical value. This can necessitate taking extremely small steps in parameter space, limiting the calculations that can be performed.
Behaviour as
 ${\mathcal{S}}\rightarrow {\mathcal{S}}_{crit}^{+}$
(example with
 $Da=Pe=10$
). The length
 $L$
of the loops shown in figure 6(a) approaches zero, consistent with (B 1). Dots denote values of
 ${\mathcal{S}}_{n}$
according to the iteration (B 2). The estimate of
 ${\mathcal{S}}_{crit}$
is shown using a red line (see inset).

Appendix C. Technical note on the treatment of reaction rate and compaction viscosity in Hewitt (Reference Hewitt2010)
Hewitt (Reference Hewitt2010) (hereafter H10) argued that the reaction-infiltration instability is not likely to occur in the mantle. This was attributed to a more complex (perhaps more realistic) choice of the thermochemical model of melting, leading to a ‘background’ melting rate. However, H10 also used a different compaction viscosity compared with our study (and with Aharonov et al. Reference Aharonov, Whitehead, Kelemen and Spiegelman1995). In this appendix, we argue that the choice of compaction viscosity was largely responsible for the different conclusion, rather than the model of melting.
The argument made by H10 revolves around the solid mass conservation equation, which (making the same simplifications as given in § 2.2, which are also made in H10) can be written in dimensionless form as
 $$\begin{eqnarray}\frac{\unicode[STIX]{x2202}\unicode[STIX]{x1D719}}{\unicode[STIX]{x2202}t}=\unicode[STIX]{x1D735}\boldsymbol{\cdot }\boldsymbol{v}_{s}+\unicode[STIX]{x1D6E4},\end{eqnarray}$$
where
 $\unicode[STIX]{x1D735}\boldsymbol{\cdot }\boldsymbol{v}_{s}={\mathcal{P}}/\unicode[STIX]{x1D701}(\unicode[STIX]{x1D719})$
. In the current paper, we take
 $\unicode[STIX]{x1D701}(\unicode[STIX]{x1D719})=1$
(non-dimensional version). However, H10 takes
 $\unicode[STIX]{x1D701}(\unicode[STIX]{x1D719})=\unicode[STIX]{x1D719}^{-1}$
(non-dimensional version), in which case (C 1) becomes
 $$\begin{eqnarray}\frac{\unicode[STIX]{x2202}\unicode[STIX]{x1D719}}{\unicode[STIX]{x2202}t}=\unicode[STIX]{x1D719}{\mathcal{P}}+\unicode[STIX]{x1D6E4}.\end{eqnarray}$$
It should be noted that the compaction pressure
 ${\mathcal{P}}$
in our paper is equal to the negative of the effective pressure variable in H10. Accounting for this sign difference, (C 2) is consistent with (28) in H10. Then, the growth rate of the linear instability can be estimated as
 $$\begin{eqnarray}\unicode[STIX]{x1D70E}\unicode[STIX]{x1D719}_{1}=\unicode[STIX]{x1D719}_{0}{\mathcal{P}}_{1}+\unicode[STIX]{x1D719}_{1}{\mathcal{P}}_{0}+\unicode[STIX]{x1D6E4}_{1}.\end{eqnarray}$$
H10 argues that the terms
 $\unicode[STIX]{x1D719}_{0}{\mathcal{P}}_{1}$
and
 $\boldsymbol{v}_{s1}$
(the perturbation to the solid velocity) are small at high wavenumber. The thermochemical model of melting used by H10 states that
 $$\begin{eqnarray}\unicode[STIX]{x1D6E4}={\mathcal{G}}[(1-\unicode[STIX]{x1D719})\boldsymbol{v}_{s}+\unicode[STIX]{x1D719}\boldsymbol{v}_{l}]\boldsymbol{\cdot }\hat{\boldsymbol{z}}\approx {\mathcal{G}}[\boldsymbol{v}_{s}+\unicode[STIX]{x1D719}^{n}\hat{\boldsymbol{z}}]\boldsymbol{\cdot }\hat{\boldsymbol{z}},\end{eqnarray}$$
where
 ${\mathcal{G}}$
is a dimensionless melt rate (proportional to our
 $\unicode[STIX]{x1D6FD}/\unicode[STIX]{x1D6FC}$
). Thus, perturbations to the melting rate are
 $$\begin{eqnarray}\unicode[STIX]{x1D6E4}_{1}={\mathcal{G}}[\boldsymbol{v}_{s1}+n\unicode[STIX]{x1D719}_{0}^{n-1}\unicode[STIX]{x1D719}_{1}\hat{\boldsymbol{z}}]\boldsymbol{\cdot }\hat{\boldsymbol{z}}\approx n{\mathcal{G}}\unicode[STIX]{x1D719}_{0}^{n-1}\unicode[STIX]{x1D719}_{1}.\end{eqnarray}$$
Equation (C 3) then becomes
 $$\begin{eqnarray}\unicode[STIX]{x1D70E}\approx {\mathcal{P}}_{0}+n{\mathcal{G}}\unicode[STIX]{x1D719}_{0}^{n-1},\end{eqnarray}$$
which is consistent with (32) in H10. The steady compaction rate is equal to the steady melting rate,
 $$\begin{eqnarray}-\unicode[STIX]{x1D719}_{0}{\mathcal{P}}_{0}=\unicode[STIX]{x1D6E4}_{0}.\end{eqnarray}$$
H10 estimates that the stabilizing compaction term (
 ${\mathcal{P}}_{0}<0$
) overcomes the destabilizing reaction term in (C 6). However, it is important to emphasize that the stabilizing term in (C 6) is present only because a strongly porosity-weakening compaction viscosity was chosen. A similar effect was also observed numerically by Spiegelman et al. (Reference Spiegelman, Kelemen and Aharonov2001).
What then of the importance of the thermochemical modelling of the reaction rate? Clearly, a reaction rate parameter appears in (C 6). However, in deriving the approximated melt-rate perturbation
 $\unicode[STIX]{x1D6E4}_{1}$
above, H10 shows that perturbations to the liquid flux are dominant over those to the solid flux. In footnote 3, H10 notes that the previous melting model of Liang et al. (Reference Liang, Schiemenz, Hesse, Parmentier and Hesthaven2010) (which is the same as that of Aharonov et al. (Reference Aharonov, Whitehead, Kelemen and Spiegelman1995), and hence our own) can be derived from a more general thermochemical model. In our notation, this simple melting model has the form
 $$\begin{eqnarray}\unicode[STIX]{x1D6E4}=\unicode[STIX]{x1D719}\boldsymbol{v}_{l}\boldsymbol{\cdot }\hat{\boldsymbol{z}}\unicode[STIX]{x1D6FD}/\unicode[STIX]{x1D6FC}.\end{eqnarray}$$
Thus, the same form of growth rate estimate as (32) in H10 can be derived using our simplified melting model. At least for the linear perturbation equations governing the reaction-infiltration instability, the more complex thermochemical model of H10 is not of fundamental importance. In this particular context, such a model could be mapped onto our version simply by changing the value of the parameter
 ${\mathcal{G}}$
. However, the steady compaction rate given by (C 7) does depend on the melting model.
Therefore, with regard to the reaction-infiltration instability, it was the rheology chosen by Hewitt (Reference Hewitt2010) that had a decisive effect on the findings, rather than the more complex treatment of melting.