


Social media summary
Glacials favored simple learning; interglacials complex teaching, but after ~200 ka culture increasingly escaped climate
Climate change is widely considered a major factor in hominin evolution, influencing biological, cognitive, and cultural developments, and is a main challenge for the future of our species (Berrang-ford et al., Reference Berrang-Ford, Siders, Lesnikowski, Fischer, Callaghan, Haddaway, Mach, Araos, Shah, Wannewitz, Doshi, Leiter, Matavel, Musah-surugu, Wong-parodi, Antwi-agyei, Ajibade, Chauhan, Kakenmaster and Abu2021; Pisor et al., Reference Pisor, Lansing and Magargal2023; Timmermann et al., Reference Timmermann, Raia, Mondanaro, Zollikofer, Ponce de León, Zeller and Yun2024). Environmental variability has been linked to population isolation and speciation events (Grove, Reference Grove2012; Potts, Reference Potts2013; Raia et al., Reference Raia, Mondanaro, Melchionna, Di Febbraro, Diniz-filho, Rangel, Holden, Carotenuto, Edwards, Lima-ribeiro, Profico, Maiorano, Castiglione, Serio and Rook2020; Sánchez Goñi, Reference Sánchez Goñi2020), shifts in locomotion (Ruxton & Wilkinson, Reference Ruxton and Wilkinson2011), and adaptations in body size, skin pigmentation, and thermoregulation (Jablonski & Chaplin, Reference Jablonski and Chaplin2017). Several studies propose that climate instability selected for cognitive flexibility, contributing to brain expansion (Stibel, Reference Stibel2023; Will et al., Reference Will, Krapp, Stock and Manica2021), and drove demographic bottlenecks, expansions, and migrations (Fu et al., Reference Fu, Posth, Hajdinjak, Petr, Mallick, Fernandes, Furtwängler, Haak, Meyer, Mittnik, Nickel, Peltzer, Rohland, Slon, Talamo, Lazaridis, Lipson, Mathieson, Schiffels and Reich2016; Scerri et al., Reference Scerri, Thomas, Manica, Gunz, Stock, Stringer, Grove, Groucutt, Timmermann, Rightmire, d’Errico, Tryon, Drake, Brooks, Dennell, Durbin, Henn, Lee-Thorp, deMenocal and Chikhi2018; Timmermann & Friedrich, Reference Timmermann and Friedrich2016). Climatic shifts modulated isolation and dispersal opportunities, including island colonization and coastal migration routes (Bailey & Cawthra, Reference Bailey and Cawthra2023; Coulthard et al., Reference Coulthard, Ramirez, Barton, Rogerson and Brücher2013; Gamble et al., Reference Gamble, Davies, Pettitt, Hazelwood and Richards2004). Climate has also been implicated in the emergence of Homo sapiens (deMenocal, Reference deMenocal2011; Scerri et al., Reference Scerri, Thomas, Manica, Gunz, Stock, Stringer, Grove, Groucutt, Timmermann, Rightmire, d’Errico, Tryon, Drake, Brooks, Dennell, Durbin, Henn, Lee-Thorp, deMenocal and Chikhi2018) and debated as a factor in Neanderthal disappearance (Albouy et al., Reference Albouy, Paquin, Riel-Salvatore, Kageyama, Vrac and Burke2024; Banks et al., Reference Banks, d’Errico, Peterson, Kageyama, Sima and Sánchez-goñi2008; d’Errico & Sanchez Goñi, Reference d’Errico and Sánchez Goñi2003; Timmerman, Reference Timmermann2020).
In parallel with these biological processes, researchers have examined how climate change influenced cultural innovations and gene-culture coevolution. Potts (Reference Potts1998, Reference Potts2013) has advanced the influential ‘variability selection hypothesis’, which posits that climate variability, rather than stability, favoured hominins capable of adapting to diverse ecological conditions. Since hominin evolution did not occur in a single environmental setting but in a mosaic of landscapes, this variability in habitat types may have influenced selection of traits that allowed for survival across different ecosystems.
Rather than responding to climatic and ecological variability solely through biological adaptation, hominins increasingly coped with diverse and changing environments by producing cultural innovations that actively expanded their ecological niche. Through the modification of resources, spaces, and activity rhythms, such innovations reduced dependence on local environmental constraints and allowed populations to inhabit a wide range of climatic settings. The mastery and control of fire exemplifies this process clearly: beyond its role in affecting organic evolution (Wrangham & Carmody, Reference Wrangham and Carmody2010), fire buffered daily activities against thermal stress, seasonality, and resource unpredictability and enabled the transformation of materials and landscapes. Fire use also underpinned a cascade of further niche-expanding cultural developments, including the heat treatment of lithic raw materials and the emergence of other pyrotechnologies, such as those involved in mastic production and the transformation of pigments and organic substances (Schmidt et al., Reference Schmidt, Porraz, Slodczyk, Bellot-Gurlet, Archer and Miller2013).
Recent work has emphasized that cultural evolution did not respond to climate change only through innovation rates but also through the progressive restructuring of informational environments. d’Errico et al. (Reference d’Errico, Meneganzin and Colagè2026) show that hominins increasingly externalized knowledge into space, bodies, and artefacts through epistemic niche construction. By engineering domestic and symbolic spaces, using pigments and ornaments to stabilize social identities, and eventually creating artefacts that stored information, hominins produced durable cognitive scaffolds that buffered environmental uncertainty. These material supports may have improved coordination and cultural transmission during periods of climatic instability, enabling cultures to persist and accumulate despite fluctuating ecological conditions.
Inquiring into how climatic variability shaped cultural trajectories, d’Errico and Banks (Reference d’Errico and Banks2013) developed tools to identify mechanisms linking Middle Palaeolithic and Middle Stone Age cultural developments to their ecological contexts. Extending this perspective, d’Errico et al. (Reference d’Errico, Banks, Warren, Sgubin, Van Niekerk, Henshilwood, Daniau and Sánchez Goñi2017) showed that niche expansions by early modern humans in South Africa coincided with climatic deterioration and technological simplification. Banks et al. (Reference Banks, Moncel, Raynal, Cobos, Romero-Alvarez, Woillez, Faivre, Gravina, d’Errico, Locht and Santos2021) further demonstrated that Neanderthals in Western Europe experienced a major niche shift around 70 ka, likely driven by climatic deterioration and associated with innovations in lithic technology.
Cumulative cultural evolution, where knowledge and innovations accumulate over many generations resulting in culturally transmitted behaviours that no single human individual could invent on their own (Boyd & Richerson, Reference Boyd and Richerson1996; Derex & Boyd, Reference Derex and Boyd2015), may have been conditioned by the amplitude and frequency of climate changes over the past 600,000 years, when glacial–interglacial cycles of around 100,000 years became prominent (Richerson et al., Reference Richerson, Boyd and Bettinger2009). Mesoudi et al. (Reference Mesoudi, Whiten and Dunbar2006) propose that the unpredictable climates of the Pleistocene may have favoured populations capable of transmitting complex cultural knowledge across generations. This capacity for cumulative culture enabled improved toolkits, development of novel subsistence strategies (from, e.g., clothing to fishing and seafaring), and expansion of socially relevant practices (communication skills and means, ornaments, art, etc.), allowing past populations to cope more effectively with environmental challenges. Importantly, expanded cumulative culture seemingly requires more and more effective means and strategies of cultural transmission, ensuring faithful passing down of varied, complex, and progressively more specialized cultural traits and innovations (Colagè & d’Errico, Reference Colagè and d’Errico2023; Dean et al., Reference Dean, Vale, Laland, Flynn and Kendal2014; Gärdenfors & Högberg, Reference Gärdenfors and Högberg2017; Mesoudi et al., Reference Mesoudi, Chang, Dall and Thornton2016; Tehrani & Riede, Reference Tehrani and Riede2008; Walsh et al., Reference Walsh, Riede, O’Neill and Prentiss2019).
At the same time, other scholars have questioned the primacy of climate as a driver. Bocquet-Appel and Tuffreau (Reference Bocquet-Appel and Tuffreau2009), examining Neanderthal lithic variability in Europe between 300 and 40 ka, showed that technological systems often endured across major climatic oscillations. In their view, climate influenced demography and dispersal more than technological change, highlighting the resilience of cultural traditions and the partial autonomy of cultural trajectories from environmental pressures.
To date, the specific relationship between climate change and cultural transmission between 3.3 Ma and the early Holocene remains largely unexplored. The impacts of climate change on the preservation of cultural innovations and resilience in transmission methods have been modelled (Kolodny et al., Reference Kolodny, Creanza and Feldman2015), and present-day (Pearson et al., Reference Pearson, Jackson and McNamara2023) or past (Riede, Reference Riede2008) cases have been documented. However, we miss a long-term scenario. This gap stems, in part, from the challenge of integrating long-term climate variability with the evolution of knowledge transmission systems in prehistoric human societies. Moreover, the discontinuous and fragmentary nature of the archaeological record makes it difficult to reconstruct cultural transmission, which can only be inferred indirectly from material remains.
This article seeks to explore how climate shifts may have influenced the way in which knowledge was transmitted over time.
A recent study (Colagè & d’Errico, Reference Colagè and d’Errico2025) explored the evolution of cultural transmission over the last 3.3 My by analysing how different modes of information transfer contributed to the perpetuation of 103 cultural traits emerging during this period and well documented in the archaeological record. The study examined 19 transmission modes across three dimensions: spatial, temporal, and social (d’Errico & Banks, Reference d’Errico and Banks2015). Within each dimension, transmission modes range from less demanding to more complex ones. For instance, in the spatial dimension, distal observation refers to a novice learning a cultural trait simply by watching an expert from a distance. In contrast, in the same dimension, complemented gesture moulding involves the expert physically shaping the learner’s movements while also adding communicative cues. Explanation complemented action is a more demanding spatial mode where the expert demonstrates the necessary actions and provides explicit explanations to clarify subtle features of the technique or raw material. In the temporal dimension, modes range from single transfer, where a cultural trait is transmitted in one instance, to sequential transfer, where distinct modules of information are passed on in a specific order. At the most complex level is disconnected transfer, where information modules are transmitted separately and only later combined to produce an accomplished cultural trait. The social dimension captures the direction of information flow within a group, ranging from transmission among relatives to more inclusive forms that disregard kinship. Social modes of cultural transmission also vary between selective (where only specific individuals learn a trait from a specialized expert) and non-selective (where anyone in the group can acquire the trait from any other practitioner).
The database by Colagè and d’Errico (Reference Colagè and d’Errico2025) documents the role of each transmission mode for each of the 103 cultural traits. Its analysis suggests that cultural transmission strategies evolved gradually over the considered period, without abrupt changes. Each dimension shows distinct trends: in the spatial dimension, observation-based modes slowly decline in importance, giving way to modes involving overt communication and explanation. This shift begins around 500 ka and becomes evident by 200 ka. In the temporal dimension, simpler modes are progressively replaced by more structured strategies between 200 and 75 ka. In the social dimension, non-selective modes gradually make room also for selective transmission, with selective modes gaining significance after around 400 ka and becoming as relevant as the non-selective modes by 100–50 ka.
Overall, a clear pattern emerges: earlier cultural traits were transmitted using observation-based, unstructured, and non-selective modes, while more recent traits relied on explanation-based, structured, and selective transmission. The period between these two extremes (ca. 600–200 ka) appears to be a transitional phase, where various transmission modes were used, possibly reflecting a search for more effective strategies to ensure the perpetuation of increasingly complex cultures. Importantly, Colagè and d’Errico (Reference Colagè and d’Errico2025) explicitly evaluated the impact of differential preservation, detectability, continuity, and frequency of occurrence on the archaeological record and showed that these factors do not significantly bias the timing of first consolidated appearances of cultural traits, supporting the robustness of long-term reconstructions of cultural transmission.
In the present study, we examine the relationship between the evolution of cultural transmission strategies over the last 3.3 My and global climate change during the same interval. We compare the long-term reconstruction of cultural transmission modes established by Colagè and d’Errico (Reference Colagè and d’Errico2025) with a continuous record of global climatic variation derived from benthic foraminifera δ18O values, a proxy for changes in global ice volume and temperature that captures both glacial–interglacial cycles and major Pliocene–Pleistocene transitions (Lisiecki & Raymo, Reference Lisiecki and Raymo2005). Rather than focusing on innovation rates or isolated climatic events, our approach tests whether enduring climatic regimes and the pace of environmental change covary with the organization of cultural transmission systems. To this end, we evaluate relationships between transmission strategies and both the absolute climatic state and the rate of climatic change |Δδ18O/Δt|, using models that accommodate non-linear and cyclical dynamics (see Methods). This framework allows us to distinguish sensitivity to long-term environmental regimes from responses to rapid climatic fluctuations and to assess how climate structured the costs and benefits of different learning strategies in the human lineage. Our results reveal a marked correlation between climate and transmission strategies across most of the record, followed by a clear departure over the last ∼200 ka, coincident with the emergence and dominance of more complex modes of cultural transmission.
Methods
Considered cultural traits
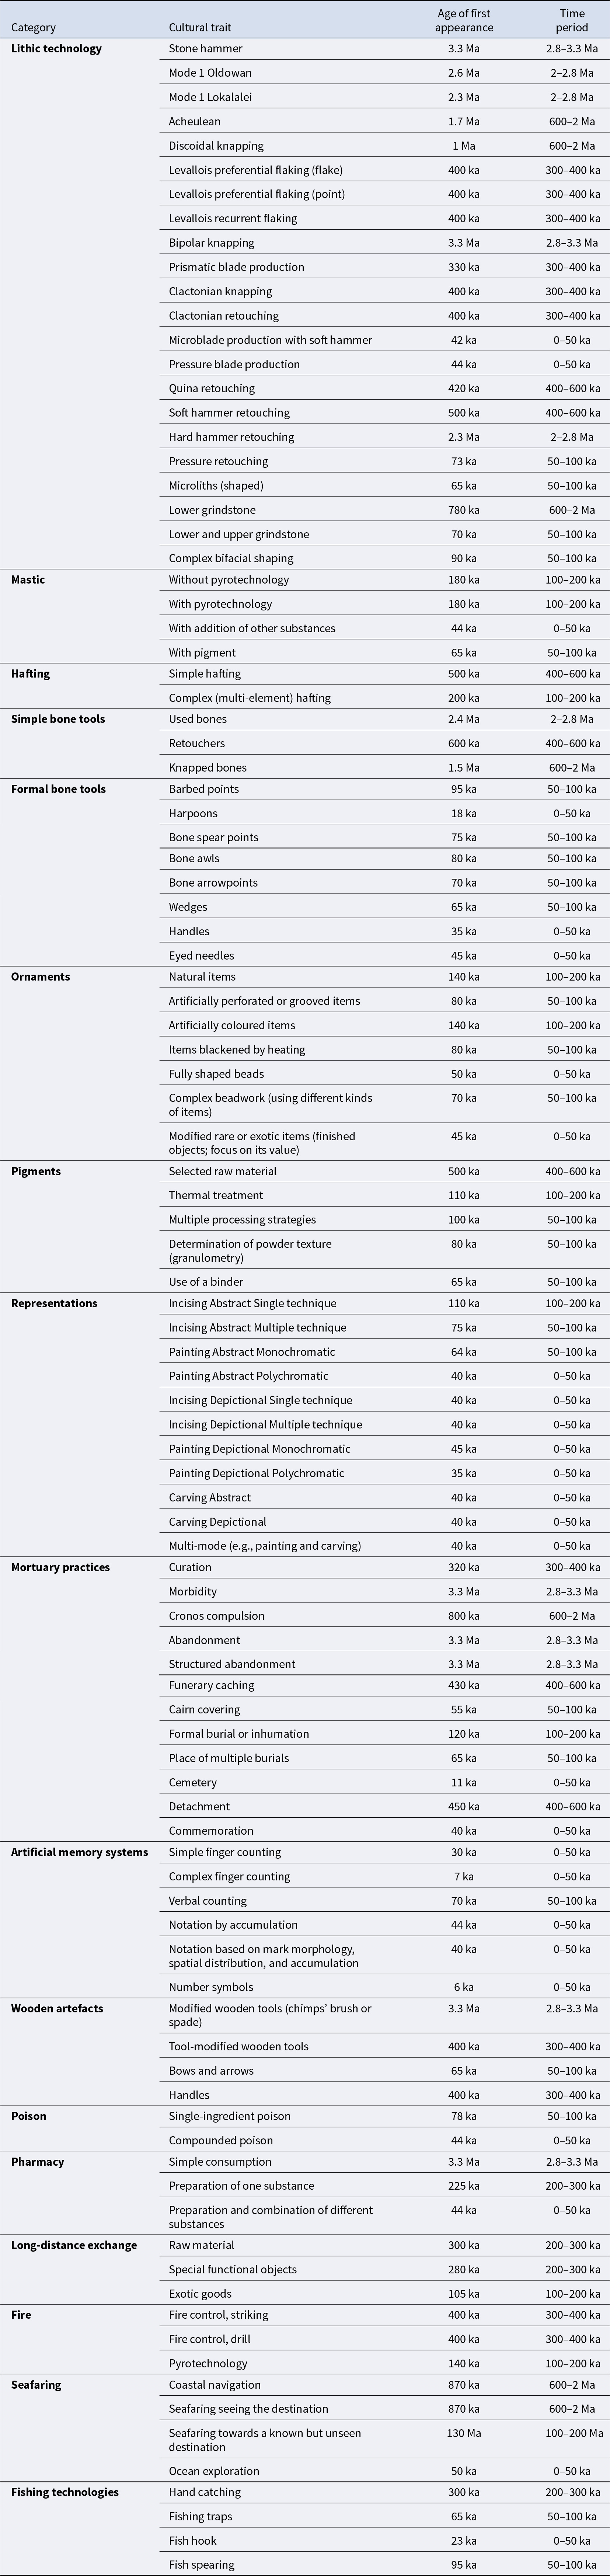
We consider 103 cultural traits (Table 1; Colagè & d’Errico, Reference Colagè and d’Errico2025) identified as key innovations emerging in the Palaeolithic (see Table S1 in Colagè & d’Errico, Reference Colagè and d’Errico2025 for definitions of these traits). These traits are organized in 17 broad categories, each comprising between 2 and 21 distinct traits. Each entry in the database corresponds to one cultural trait. Table 1 lists all traits included in the analysis and reports, for each, the age of first consolidated appearance in the archaeological record and its attribution to the time periods considered here. The criteria used to define consolidation and to assign traits to specific time periods are described in the section ‘Dating and time periods’.
Cultural traits

Table 1 Long description
Rows are grouped by category and list each cultural trait with its age of first appearance and a time period for analysis, using units such as Ma and ka. In Lithic technology, ages range from 3.3 Ma for Stone Hammer and Bipolar knapping, through 2.600.000 for Mode 1 Oldowan and 1.700.000 for Acheulean, to 42.000 for Microblade production with soft hammer and 44.000 for Pressure Blade production; time periods include 2.8 to 3.3 Ma, 2 to 2.8 Ma, 600 to 2 Ma, 400 to 600 ka, 300 to 400 ka, 100 to 200 ka, 50 to 100 ka, and 0 to 50 ka. Mastic lists four traits, including Without pyrotechnology and With pyrotechnology at 180 ka with time period 100 to 200 ka, plus With addition of other substances at 44.000 with time period 0 to 50 ka and With pigment at 65.000 with time period 50 to 100 ka; Hafting includes Simple hafting at 500.000 with time period 400 to 600 ka and Complex multi element hafting at 200.000 with time period 100 to 200 ka. Simple bone tools include Used bones at 2.400.000 with time period 2 to 2.8 Ma, Retouchers at 600.000 with time period 400 to 600 ka, and Knapped bones at 1.500.000 with time period 600 to 2 Ma; Formal bone tools range from Harpoons at 18.000 with time period 0 to 50 ka to Barbed points at 95.000 with time period 50 to 100 ka. Ornaments include Natural items and Artificially colored items at 140.000 with time period 100 to 200 ka, several entries at 80.000 with time period 50 to 100 ka, and Fully shaped beads at 50.000 with time period 0 to 50 ka; Pigments range from Selected raw material at 500.000 with time period 400 to 600 ka to Use of a binder at 65.000 with time period 50 to 100 ka. Representations include multiple entries at 40.000 with time period 0 to 50 ka, plus Incising Abstract Single technique at 110.000 with time period 100 to 200 ka and Painting Abstract Monochromatic at 64.000 with time period 50 to 100 ka. Mortuary practices include Morbidity, Abandonment, and Structured abandonment at 3.3 Ma with time period 2.8 to 3.3 Ma, and later entries such as Cemetery at 11.000 with time period 0 to 50 ka; Artificial Memory Systems range from Simple finger counting at 30.000 to Number symbols at 6.000, all with time period 0 to 50 ka except Verbal counting at 70.000 with time period 50 to 100 ka. Wooden artifacts include Modified wooden tools at 3.3 Ma with time period 2.8 to 3.3 Ma and Bows and arrows at 65.000 with time period 50 to 100 ka; Poison lists Single ingredient poison at 78.000 with time period 50 to 100 ka and Compounded poison at 44.000 with time period 0 to 50 ka. Pharmacy includes Simple consumption at 3.3 Ma with time period 2.8 to 3.3 Ma and two preparation entries at 225.000 and 44.000; Long distance exchange lists Raw material at 300.000, Special functional objects at 280.000, and Exotic goods at 105.000 with time periods 200 to 300 ka and 100 to 200 ka. Fire lists Fire control, striking and Fire control, drill at 400.000 with time period 300 to 400 ka and Pyrotechnology at 140.000 with time period 100 to 200 ka; Seafaring includes two entries at 870.000 with time period 600 to 2 Ma, one entry at 130.000 with time period 100 to 200 ka, and Ocean exploration at 50.000 with time period 0 to 50 ka. Fishing technologies range from Hand catching at 300.000 with time period 200 to 300 ka to Fish hook at 23.000 with time period 0 to 50 ka.
Notes: This table includes the 103 cultural traits considered in this study, divided into categories. For each cultural trait, the table provides the age of first consolidated appearance and the appropriate time period for statistical analysis (modified after Colagè & d’Errico, Reference Colagè and d’Errico2025).
Dimensions and modes of cultural transmission
We consider 19 distinct modes of cultural transmission that ensure the maintenance of a cultural trait within a population (Colagè & d’Errico, Reference Colagè and d’Errico2025; d’Errico & Banks, Reference d’Errico and Banks2015). These modes are intended to capture the concrete behavioural interactions between practitioner and learner. A practitioner (or expert) is the individual (or individuals) who possess(es) a body of knowledge and use(s) it to perform a task. Practitioners may or may not intend to teach or facilitate the learning of their knowledge by a learner. A learner (or novice) is an individual, usually a conspecific in our framework, who either intends to learn, is intended to learn, or just learns a particular body of knowledge from a practitioner. We consider that cultural transmission occurs in three different dimensions (spatial, temporal, and social) in which information is transferred from practitioners to learners. In this framework, cultural traits are treated as equivalent observational units, not because they are assumed to have equal intrinsic importance, but because each provides evidence of the transmission processes required for its maintenance within a population. The analysis therefore focuses on the distribution of transmission modes over time rather than on the relative weight of individual traits.
The spatial dimension concerns the spatial relationships between practitioner and learner during transmission events. Such relationships might be merely spatial (physical distance) or also encompass specific classes of actions the practitioner puts in practice to facilitate the novice’s learning. Modes within this dimension are as follows:
Distant observation (SPAdistal). The learner observes a practitioner’s actions from a distance (not in proximity); the practitioner does not intend to teach, might be unaware of the observing learner, or may even attempt at masking/concealing its actions.
Disconnected proximal observation (SPAproDis). The practitioner accepts the proximate presence of the learner but is unaware of, or uninterested in, novice’s learning.
Conscious proximal observation (SPAproCon). The practitioner tolerates the learner’s presence and is, to an extent, aware that the latter is there to acquire the knowledge necessary to perform the same task and achieve the same goal, but does nothing to facilitate learning.
Proximate observation with practitioner intentionality (SPAproInt). The practitioner’s actions are intentionally performed in such a way (e.g., slowed down, exaggerated, etc.) that novice’s learning is actively facilitated. Note that in this transmission mode the practitioner’s focus may be more on transmitting information than on performing a task successfully.
Gesture moulding (SPAgeMo). The practitioner guides the learner’s actions through physical contact. This concerns cultural traits that cannot be acquired by simple observation and require the practitioner to shape the learner’s movements physically.
Complemented gesture moulding (SPAgeCo). The previous mode (SPAgeMo) is accompanied by positive or negative non-verbal feedback the practitioner overtly gives to the novice.
Explanation complemented action (SPAexpAct). The practitioner complements its actions – or the ‘enacting’ of these actions – with overt explanations allowing the learner to understand better the actions, some of their details, their order, and/or their goals. This transmission mode might not need full-blown spoken articulate language but requires a complex-enough communication system.
Explanation in absence of action (SPAabsAct). Knowledge is communicated without the real execution of the actions necessary to achieve the goal. This may involve articulate language but also less complex forms of communication like gestural languages, protolanguages, etc.
The temporal dimension concerns the timing, frequency, and/or order of transmission events to transmit a cultural trait to a learner. Modes within this dimension are as follows:
Single information transfer (TEsingle). The necessary knowledge can be transmitted/acquired in a single transmission event; even though the novice might still need time and rehearsal to perfect it, this will not require further transmission.
Repetitive single information transfer (TErepetitive). The necessary knowledge needs repeated transmission events of the same kind to be successfully transmitted/acquired.
Sequential information transfer events (TEsequent). Acquiring the knowledge necessary to perform a task entails a sequence of learning events about different action segments that must occur in a given order.
Modular information transfer (TEmodular). Acquiring the necessary knowledge to perform a task requires learning a number of distinct operative ‘modules’ that can be acquired in an order different from that required to complete the whole task. In this scenario, a single operative module can be involved in the implementation of more than one cultural trait.
Disconnected information transfer (TEdisco). Acquiring the necessary know-how to perform a task implies learning several disconnected pieces of knowledge, the utility of which will only become apparent at a future stage, when they will be integrated in order to achieve the goal. In this scenario, the learner might even be unaware of the final task/goal when acquiring (some of) the pieces of knowledge.
The social dimension concerns the social ‘directions’ in which information flows, i.e., who learns from whom. Modes within this dimension are as follows:
Horizontal, vertical, and oblique transmission (SOhoVeOb). In our framework, horizontal transmission happens through related individuals of the same generation; vertical transmission goes from parents to offspring; oblique transmission occurs when the novice receives information from relatives other than parents and siblings.
Horizontal, vertical, and oblique selective transmission (SOhoVeObSe). It is the same scenario as above, but information is transmitted selectively – i.e., specific practitioners pass information only to selected novices (e.g., from mothers to daughters, or only to first-borns, etc.).
Generalized hyper-oblique transmission (SOhyObGe). Within an extended social group, information is passed on from any expert individual to any novice, irrespective of genetic relatedness or social proximity, and without selectivity.
Selective generalized hyper-oblique transmission (SOhyObSe). It is the same scenario as above, but cultural traits are transmitted in a selective manner – e.g., according to social status, gender, or other criteria.
Reciprocal generalized hyper-oblique transmission (SOhyObReGe). This is the same scenario as generalized hyper-oblique transmission with the relevant addition that members of a younger generation may transmit a (novel) cultural trait to older generations.
Reciprocal selective generalized hyper-oblique transmission (SOhyObReSe). This is the same scenario as selective generalized hyper-oblique transmission with the relevant addition that selected members of a younger generation may transmit a (novel) cultural trait to specific members of the older generation.
Database scores and assignment procedure
The database of the 19 cultural transmission modes assessed on the 103 cultural traits (see S1 File in Colagè & d’Errico, Reference Colagè and d’Errico2025) assigns scores from 0 to 4 to each cultural transmission mode for each cultural trait. In the spatial and temporal dimensions, scores are based on the mode’s role in transmitting the trait, with 0 indicating no role and 4 being the least complex mode ensuring full transmission. Only one score of 4 is given per trait per dimension, while scores of 0–3 may be assigned multiple times. The social dimension scores reflect the likelihood of using specific social modes to transmit the trait, with score 4 possibly assigned more than once. Scores were determined in three steps. First, the authors assigned initial scores based on archaeological, ethnographic, ethological, and experimental data. Then, they consulted experts in the respective fields for feedback, either through interviews or email. Finally, the authors revised the scores based on expert input, leading to modifications in 234 of the 1,957 data points (11.96%), with most changes being minor (±1 or 2). This indicates strong alignment between the authors’ original scores and the experts’ suggestions, with less than 1% showing larger discrepancies.
Dating and time periods
The database also includes the age of the first consolidated appearance of each cultural trait. The ‘age of consolidated appearance’ is the time at which a trait is consistently observed in the archaeological record, and not the time of early sporadic and often controversial instances of a trait. This choice is motivated not only by the need to rely on robust archaeological evidence but also by the fact that investigating cultural transmission requires consideration of traits transmitted over many generations. The traits are also assigned to nine time periods (0–50 ka, 50–100 ka, 100–200 ka, 200–300 ka, 300–400 ka, 400–600 ka, 600 ka–2 Ma, 2–2.8 Ma, 2.8–3.3 Ma) on the basis of their ‘age of consolidated appearance’. The identification and dating of cultural traits necessarily involve varying degrees of uncertainty due to differences in preservation, research intensity, and chronological resolution across the archaeological record. These issues were explicitly evaluated in the study from which the present dataset is derived (Colagè & d’Errico, Reference Colagè and d’Errico2025), where statistical tests showed that such factors do not significantly bias the large-scale temporal patterns identified. Robustness checks of traits’ dating and assignment to time periods are available in the S2 File in Colagè & d’Errico (Reference Colagè and d’Errico2025).
The climate record
The δ18O curve is a crucial indicator for reconstructing past climate conditions over the last 5 My. This curve is primarily calculated from the oxygen isotope ratios in the calcium carbonate (CaCO₃) shells of benthic foraminifera. These organisms live on the ocean floor, and their oxygen isotope composition primarily reflects changes in global ice volume and deep-water temperatures. As deep-sea environments are less affected by local or seasonal variations, the δ18O curve offers a stable record of global climate changes (Lisiecki & Raymo, Reference Lisiecki and Raymo2005; Rohling, Reference Rohling and Elias2013; Shackleton, Reference Shackleton2000). The δ18O curve clearly shows the alternation between relatively cooler and warmer global climatic phases, particularly pronounced during the Pleistocene with higher δ18O values corresponding to cooler periods (greater global ice volume), while lower δ18O values reflect warmer periods with reduced ice sheets. Over the last 5 My, the transition from the Pliocene to the Quaternary and the Early–Middle Pleistocene transition are reflected in the increasing magnitude and frequency of glacial cycles.
Statistical modelling and regression analysis
To investigate the relationship between cultural transmission strategies and long-term climate dynamics, we analysed the degree of covariation between cultural variables and the δ18O climatic record from two complementary perspectives: (i) comparison with raw δ18O values over the last 3.3 Ma and (ii) comparison with the rate of climatic change, expressed as the absolute gradient |Δδ18O/Δt|. The latter provides a measure of the magnitude of climatic fluctuations, irrespective of their direction, allowing us to distinguish periods of relative stability from phases of rapid environmental change. The absolute gradient was taken to evaluate the magnitude of these changes without bias towards the direction of change, allowing us to focus on the intensity of climate shifts – whether ice volume increased or decreased. By focusing on absolute values, we assess whether the intensity of climatic variation – rather than its direction – was associated with changes in cultural transmission strategies.
We first assessed the relationship between climate (y) and each cultural variable (X) individually using a non-parametric correlation test. Kendall’s τ rank correlation coefficient was used for this purpose (Kendall, Reference Kendall1955). Because δ18O values vary in highly non-linear and cyclic ways, climatic data were pre-processed using a Locally Estimated Scatterplot Smoothing (LOESS) algorithm (α = 0.5; Cleveland, Reference Cleveland1979) to capture long-term trends. The null hypothesis (H₀) for these analyses is that no monotonic association exists between climatic conditions and the importance of specific transmission modes.
While correlation analyses provide an initial indication of association, they are limited in their ability to capture complex relationships involving cyclic and non-linear dynamics. To overcome this limitation, we employed Fourier-series-based modelling (Bilodeau, Reference Bilodeau1992) to quantify the degree of alignment between the temporal structure of climatic variation and the evolution of cultural transmission strategies. In this framework, the δ18O signal is represented as a periodic function y(t), decomposed into a finite sum of sine and cosine components.
Two complementary modelling approaches were adopted for this purpose. The primary approach represents the climatic signal, y(t), as a periodic function that can be decomposed into a sum of sine and cosine terms using a Fourier basis. This formulation treats climate as a continuous, temporally resolved signal and assesses the extent to which combinations of cultural variables align with its cyclic nature. We can therefore represent our given y(t) as a Fourier series given:
 \begin{equation*}y\left( t \right) = {a_0} + \mathop{\sum}\limits^{\infty}_{n = 1} \left( {{a_n}{\text{cos}}\left( {\frac{{2\pi nt}}{T}} \right) + {b_n}{\text{sin}}\left( {\frac{{2\pi nt}}{T}} \right)} \right)\end{equation*}
where a 0 is the average value of y(t) over one period, such that
 \begin{equation*}{a_0} = \frac 1{T}{\int_0^T}y\left( t \right)dt\end{equation*}
and an and bn are the Fourier coefficients for the harmonic n. Finally, T is the period of the function. Fourier coefficients for each harmonic can then be calculated as follows:
 \begin{equation*}{a_n} = \frac{2}{T}\int^T_0 y\left( t \right){\text{cos}}\left( {\frac{{2\pi nt}}{T}} \right)dt\end{equation*}
 \begin{equation*}{b_n} = \frac{2}{T}\int^T_0 y\left( t \right){\text{sin}}\left( {\frac{{2\pi nt}}{T}} \right)dt\end{equation*}
This allows the regression functions, f(x), to be weighted by the cyclic nature of the dependent variable. By selecting a finite number of n, we can capture more or less detail about the signal’s overall frequency and amplitude. For the purpose of this model, we used a multivariate linear regression to fit the final function, f(x).
In addition to this primary formulation, we implemented a complementary reverse modelling approach in which the cyclic climatic signal was used as the predictor and the cultural transmission variables were treated as the response. Given the multivariate and ordinal nature of these variables, and the large number of possible joint configurations, they were modelled jointly as a multivariate ordered response rather than as a single categorical outcome. This complementary approach evaluates whether the observed association is robust to model direction, by assessing the relationship when the roles of predictor and response are reversed. Rather than implying strict symmetry, it serves as a consistency check, ensuring that the detected patterns are not an artefact of model formulation.
To prevent extreme peaks in δ18O from biasing calculations, climatic data were smoothed using an Exponential Moving Average algorithm with a window size of 5 (Hyndman & Athanasopoulos, Reference Hyndman and Athanasopoulos2018; Nielsen, Reference Nielsen2019). In addition, a LOESS algorithm was applied to the absolute δ18O gradient (|Δδ18O/Δt|, α = 0.1) to capture overall trends in climate variability (disregarding extreme variations in the signal that may be considered not informative) while minimizing the influence of outliers.
To mitigate the risk of overfitting due to a large number of variables, several trials were conducted, varying the value of n for the calculation of Fourier coefficients. The aim was to choose an n large enough to capture the overall frequency and amplitude of δ18O peaks and spikes, while keeping the variable-to-observation ratio as low as possible. An optimal n value of 10 was selected, resulting in a total of 20 an and bn coefficients. These were used, in combination with the cultural traits, to model both sources of climatic information.
For this study, we fitted the Fourier series regression functions using ordinary least squares calculations on each of the individual cultural traits. We then performed analyses by combining different modes in different dimensions, including social, spatial, and temporal, as well as combinations such as spatial and social, spatial and temporal, temporal and social, and all traits together. Once the regression functions were fit, we evaluated the relationship between cultural transmission traits and climatic variables by assessing the degree and quality of the fitted functions. In this context, our null hypothesis (H 0) is defined as whether the cultural traits can predict δ18O and |Δδ18O/Δt| values at a given time period.
Regression function analyses were therefore conducted is that the cultural traits are not significantly associated with δ18O or |Δδ18O/ΔT| a number of standard evaluation metrics. First, the F-test statistic was used to derive a p-value defining how notable the relationships between X and y are. For all hypothesis testing using p-values, we applied a threshold of p = 0.003 (Courtenay, Reference Courtenay2023, Reference Courtenay2024) and avoided the use of terms such as ‘statistically significant’ following the recommendations of Wasserstein et al. (Reference Wasserstein, Schirm and Lazar2019). Likewise, all p-values were calibrated and evaluated alongside false positive risk values, indicating the probability that rejecting H 0 is a false positive, given a prior probability of 0.5 (Colquhoun, Reference Colquhoun2019).
Next, the root mean squared error (RMSE) was calculated to evaluate as a way of evaluating the magnitude of variables, followed by the R 2 coefficient of determination. R 2 is defined as 1 minus the ratio of the residual sum of squares to the total sum of squares. This formula produces a value between 0 and 1, with the latter indicating that f(x) explains most of the variability in the response variable. Considering that the different versions of f(x), however, can have a varied number of coefficients, this value can be misleading when comparing different models fit on different sets of predictors (Raju et al., Reference Raju, Bilgic, Edwards and Fleer1997). For this purpose, we adjusted the R 2 coefficient such that:
 \begin{equation*}{\bar R^2} = 1-\left( \frac{\left( 1-{R^2} \right)\left( n-1 \right)}{n-k-1} \right)\end{equation*}
where n is the number of observations, and k is the number of predictors, so as to correct for differences in f(x) complexity.
Model performance in the primary (forward) framework was evaluated by assessing the extent to which the inclusion of cultural transmission variables improves the fit of the Fourier-based representation of the climatic signal. Specifically, models incorporating cultural variables were compared against a null model consisting only of the Fourier terms, representing the baseline periodic structure of the climatic record. Improvements in model fit were quantified using the difference in  ${\bar R^2}$ values. This allows us to evaluate whether cultural variables account for additional variation in the climatic signal beyond that captured by its underlying cyclic pattern.
Model performance in this reverse framework was evaluated relative to a null baseline assuming no association (mean/mode prediction), allowing us to assess whether the climatic signal reduces prediction error in the multivariate cultural configuration. This complementary analysis serves as a robustness check on the presence of association, rather than as a primary inferential framework, due to differences in data structure (continuous versus discrete, regularly versus irregularly sampled) and the resulting asymmetry in model interpretation.
Finally, to assess the varying strength of y ∼ x relationships over time, a number of calculations were performed on specific temporal windows to observe potential changes. In these cases,  ${\bar R^2}$ values could not always be computed due to a decrease in sample size when partitioning the dataset according to each temporal window. For this reason, we focused solely on comparing RMSE values, while using 10,000 bootstrap replicates for the construction of confidence intervals.
Model fit was interpreted in terms of the magnitude and structure of residuals, in conjunction with standard goodness-of-fit metrics. Larger residuals indicate that the model fails to capture substantial variation in the data, suggesting a weaker correspondence between variables. Conversely, lower residual magnitudes, together with improvements relative to appropriate null baselines, indicate a closer alignment between the temporal structure of the variables. These measures are therefore interpreted as reflecting the strength of statistical association, rather than implying predictive accuracy or causal relationships (Figs S45–96). For analyses in which transmission modes were considered jointly, scores from all 19 transmission modes were combined to characterize the overall transmission profile associated with the cultural traits present in each time period.
Results
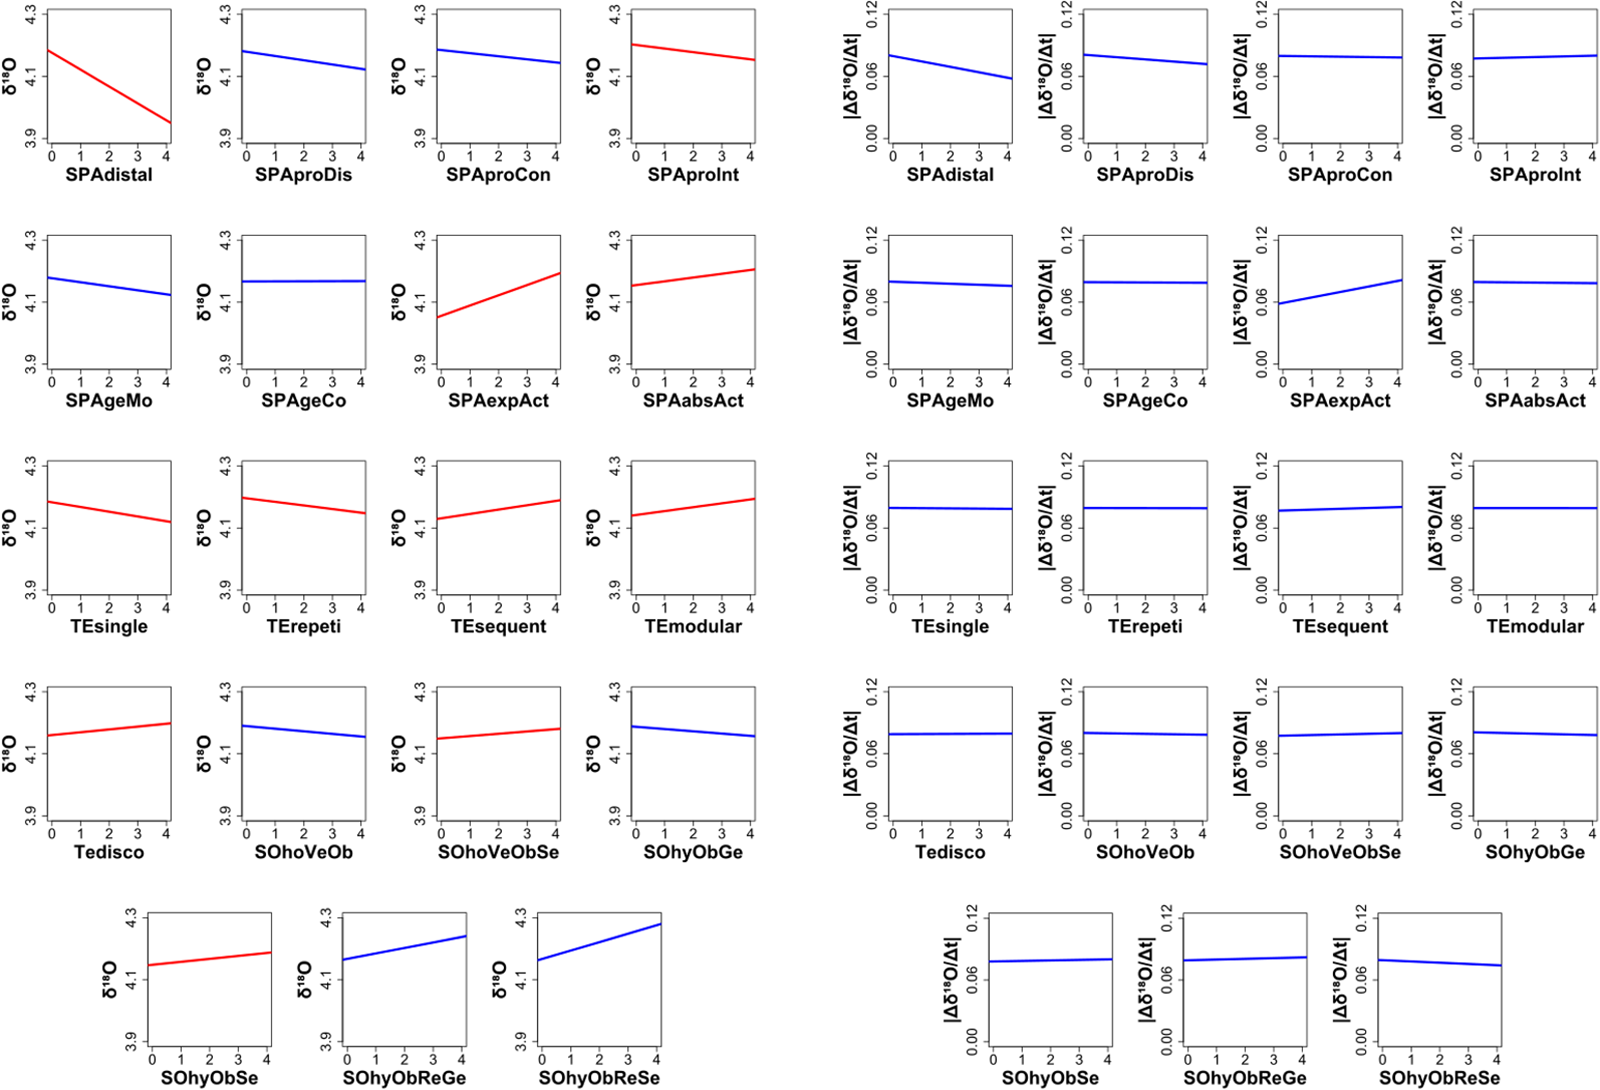
Univariate analyses of individual modes of cultural transmission by means of Kendall’s τ (Fig. 1, Table S1) reveal heterogeneous patterns depending on whether δ18O values or their rate of change |Δδ18O/Δt| are considered. Several transmission modes, including distal observation (SPAdistal) and single-event transfer (TEsingle), show positive associations with δ18O values, indicating a greater prevalence of these simpler strategies during globally cooler phases (higher δ18O values). In contrast, more complex and cognitively demanding strategies, such as explanation-complemented action (SPAexpAct), explanation in absence of action (SPAabsAct), and modular transfer (TEmodular), display negative associations, suggesting increased importance during interglacial conditions (lower δ18O values). Intermediate modes, including repetitive transfer (TErepetitive), sequential transfer (TEsequent), and proximal intentional observation (SPAproInt), show weaker but still discernible associations, often peaking under transitional climatic conditions. These mode-specific results suggest that globally cooler phases favoured the persistence of simpler strategies, whereas interglacial amelioration facilitated the rise of more structured, communicative, and cognitively demanding modes of cultural transmission. Overall, individual transmission modes show variable and generally moderate levels of association with climatic conditions, indicating that no single mode alone captures the full structure of the climatic signal.
Single variable correlation analyses.

Figure 1 Long description
The composite image contains multiple line graphs arranged in a grid. Each graph corresponds to a named cultural transmission mode and plots delta 18O values on the horizontal axis against an association measure on the vertical axis. Each panel contains two lines, one plotted as a rising or falling trend and another as a contrasting trend, corresponding to two distinct datasets or conditions differentiated visually within each panel. The horizontal axis in each panel represents delta 18O values. The vertical axis in each panel represents an association measure ranging from approximately 0 to 1. The panels are arranged across multiple rows and columns. Row one contains the following panels. SPAdistal shows one line declining across the delta 18O range and a second line rising, with values approximately between 0.2 and 0.8. SPAproInt shows a moderate upward slope for one line and a flatter opposing line. SPAproxCon shows one line declining from approximately 0.7 to 0.3 and a second line with a slight upward trend. SPAprolnt shows two lines with crossing trends near the midpoint of the horizontal axis. SPAabsAct shows one line rising from approximately 0.2 to 0.8 and a second line declining. SPAmodCon shows two lines with diverging trends across the range. Row two contains the following panels. SPAageRe shows two lines with moderate opposing slopes. SPAgeCo shows one line with a gradual upward trend and a second with a downward trend. SPAexpAct shows one line rising steeply from approximately 0.2 to 0.8 and a second declining. SPAageRe shows two crossing lines near the midpoint. SPAgeCo shows a second instance with similar diverging trends. SPAexpAct shows a second instance with one line near 0.8 throughout. Row three contains the following panels. TEsingle shows one line rising from approximately 0.3 to 0.7 and a second declining. TErepetitive shows two lines with gradual opposing slopes. TEsequent shows one line declining and a second rising, crossing near the midpoint. TEsingle shows a second instance with one line remaining near 0.6. TErepetitive shows a second instance with moderate divergence. TEmodular shows one line declining from approximately 0.8 to 0.2 and a second line rising. Row four contains the following panels. TseSeva shows two lines with mild opposing trends. 80hyvAeObs shows one line rising and a second declining with moderate slopes. 80hyvAeObs shows a second instance with two lines crossing near the center. 80hyvObsRe shows two lines with gradual divergence. Row five contains the following panels. 50hyvObsSs shows two lines with opposing trends of moderate slope. 50hyvObsRe shows one line declining from approximately 0.7 to 0.3 and a second line rising. 50hyvObsRe shows a second instance with two lines showing mild divergence. 50hyvObsReRe shows two lines with crossing trends near the midpoint of the horizontal axis.
When considering the rate of climate change, no individual transmission mode or dimension shows a notable association with |Δδ18O/Δt| across the 3.3 Ma record (Table S1, Fig. 1; all blue lines, p > 0.003). This suggests that transmission strategies were more closely aligned with prevailing climate states (glacial versus interglacial) than with the intensity or rapidity of climatic fluctuations.
Univariate analyses provide only a partial view of these relationships. To better capture the complex, non-linear, and cyclical nature of climate dynamics, we employed multivariate Fourier-based models to evaluate the degree of alignment between climatic variation and combinations of cultural transmission variables.
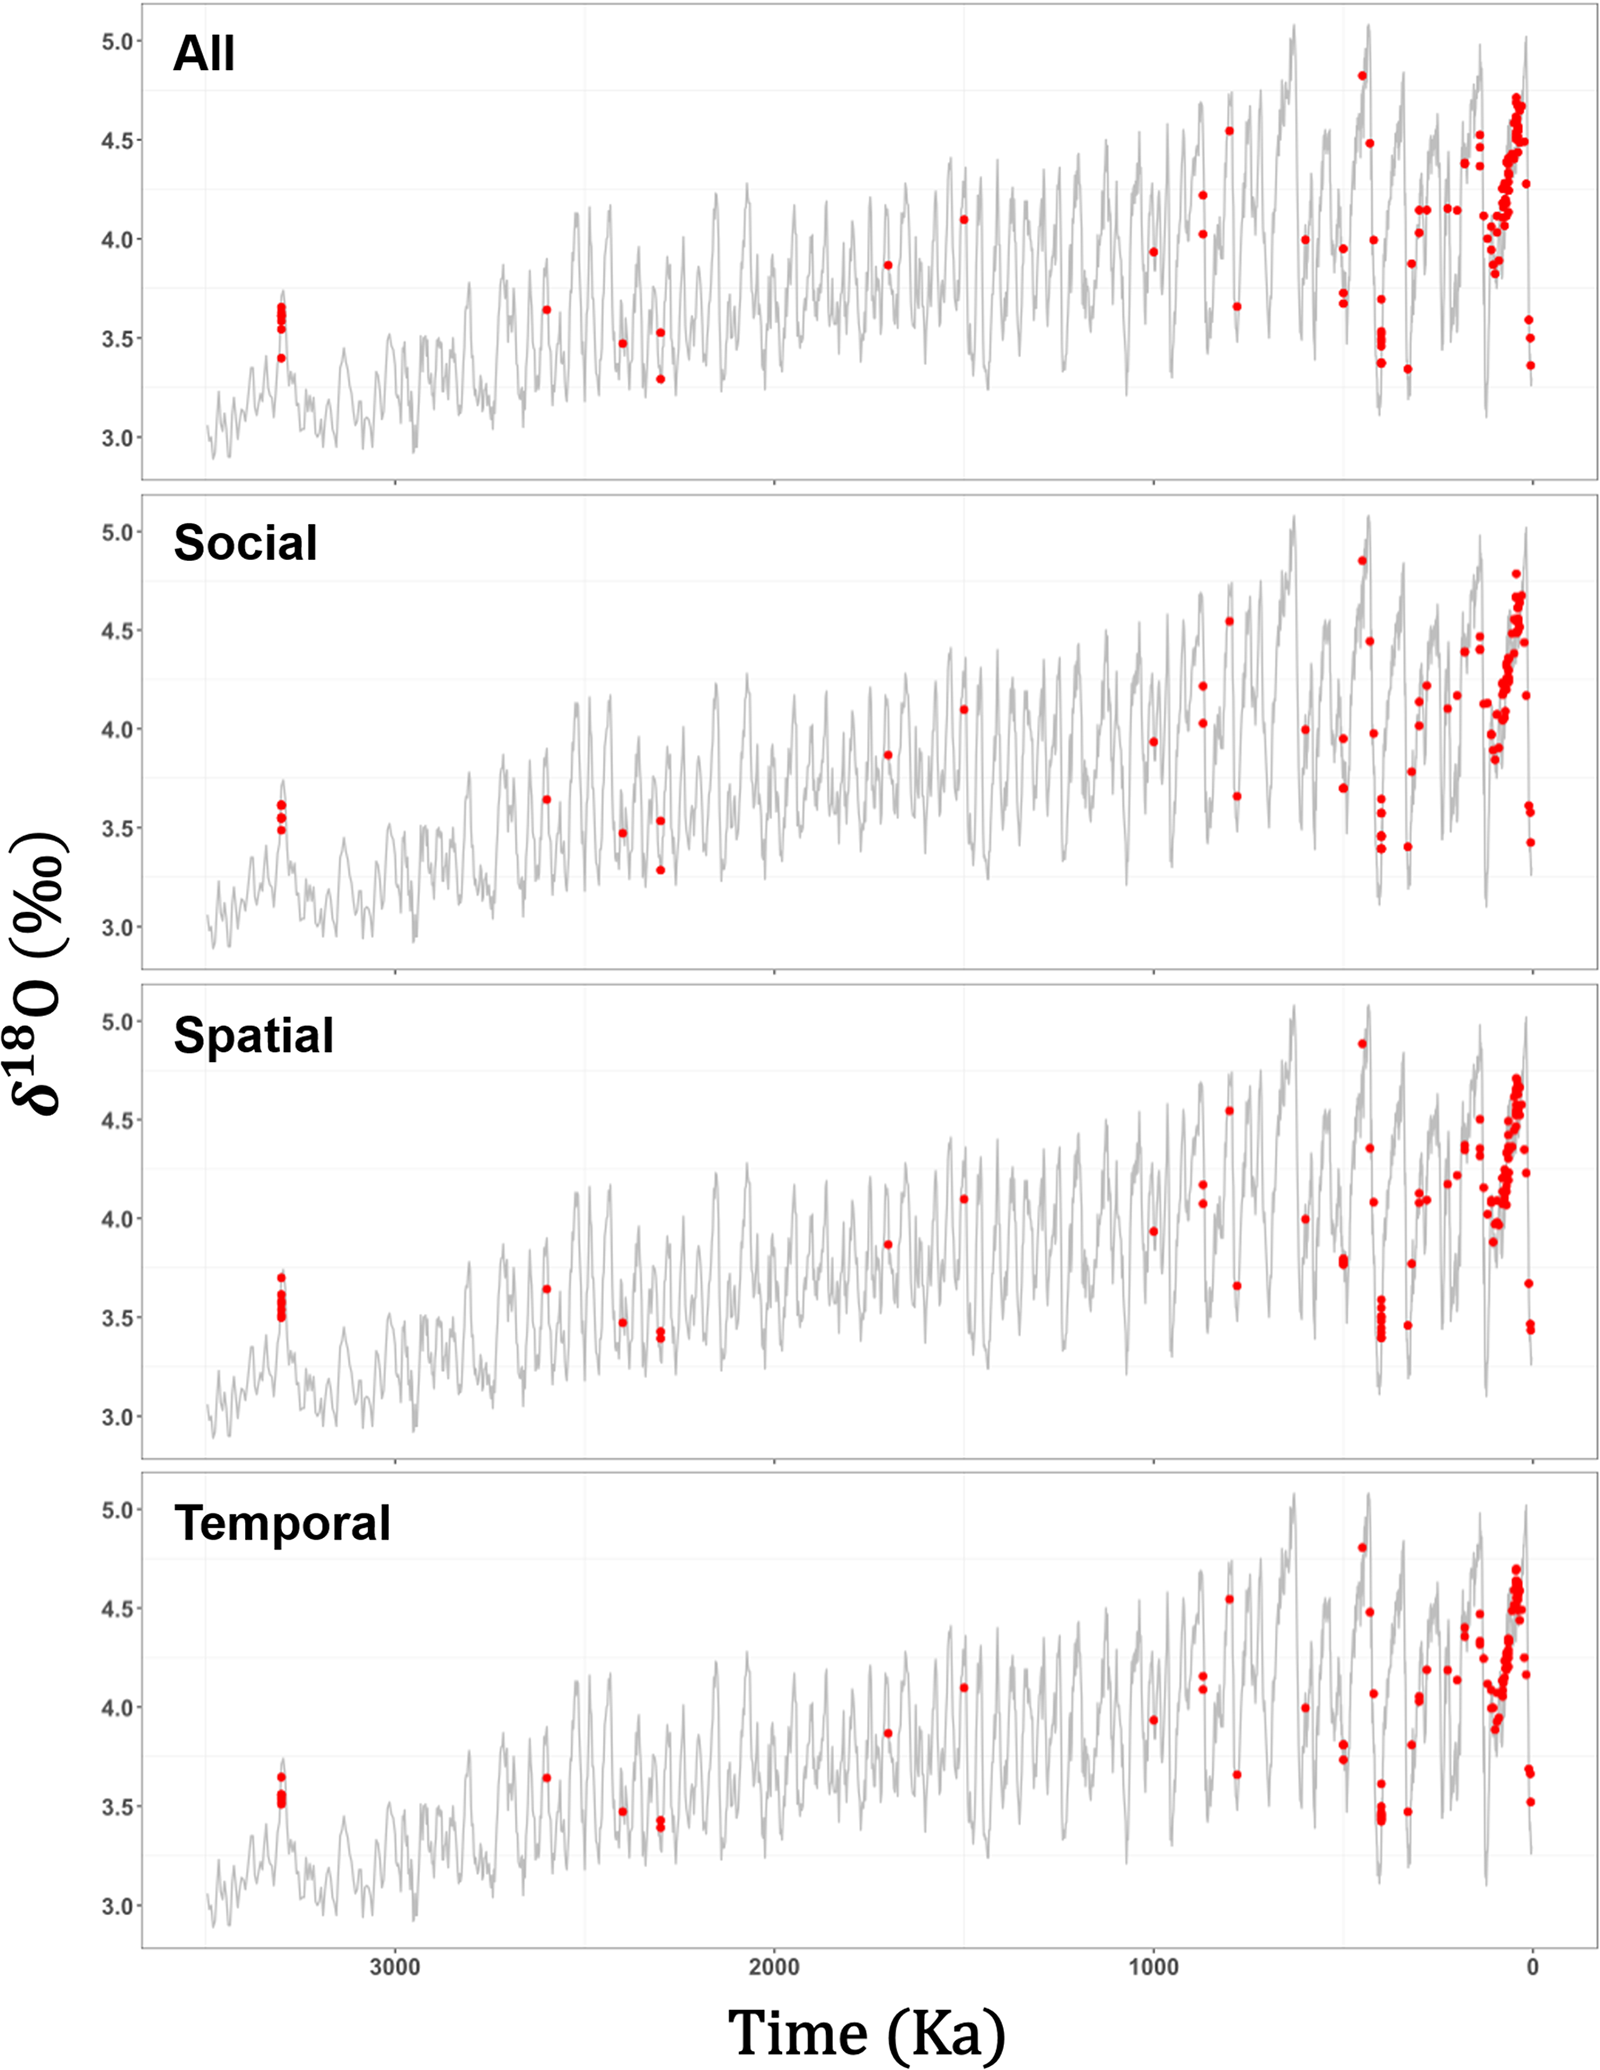
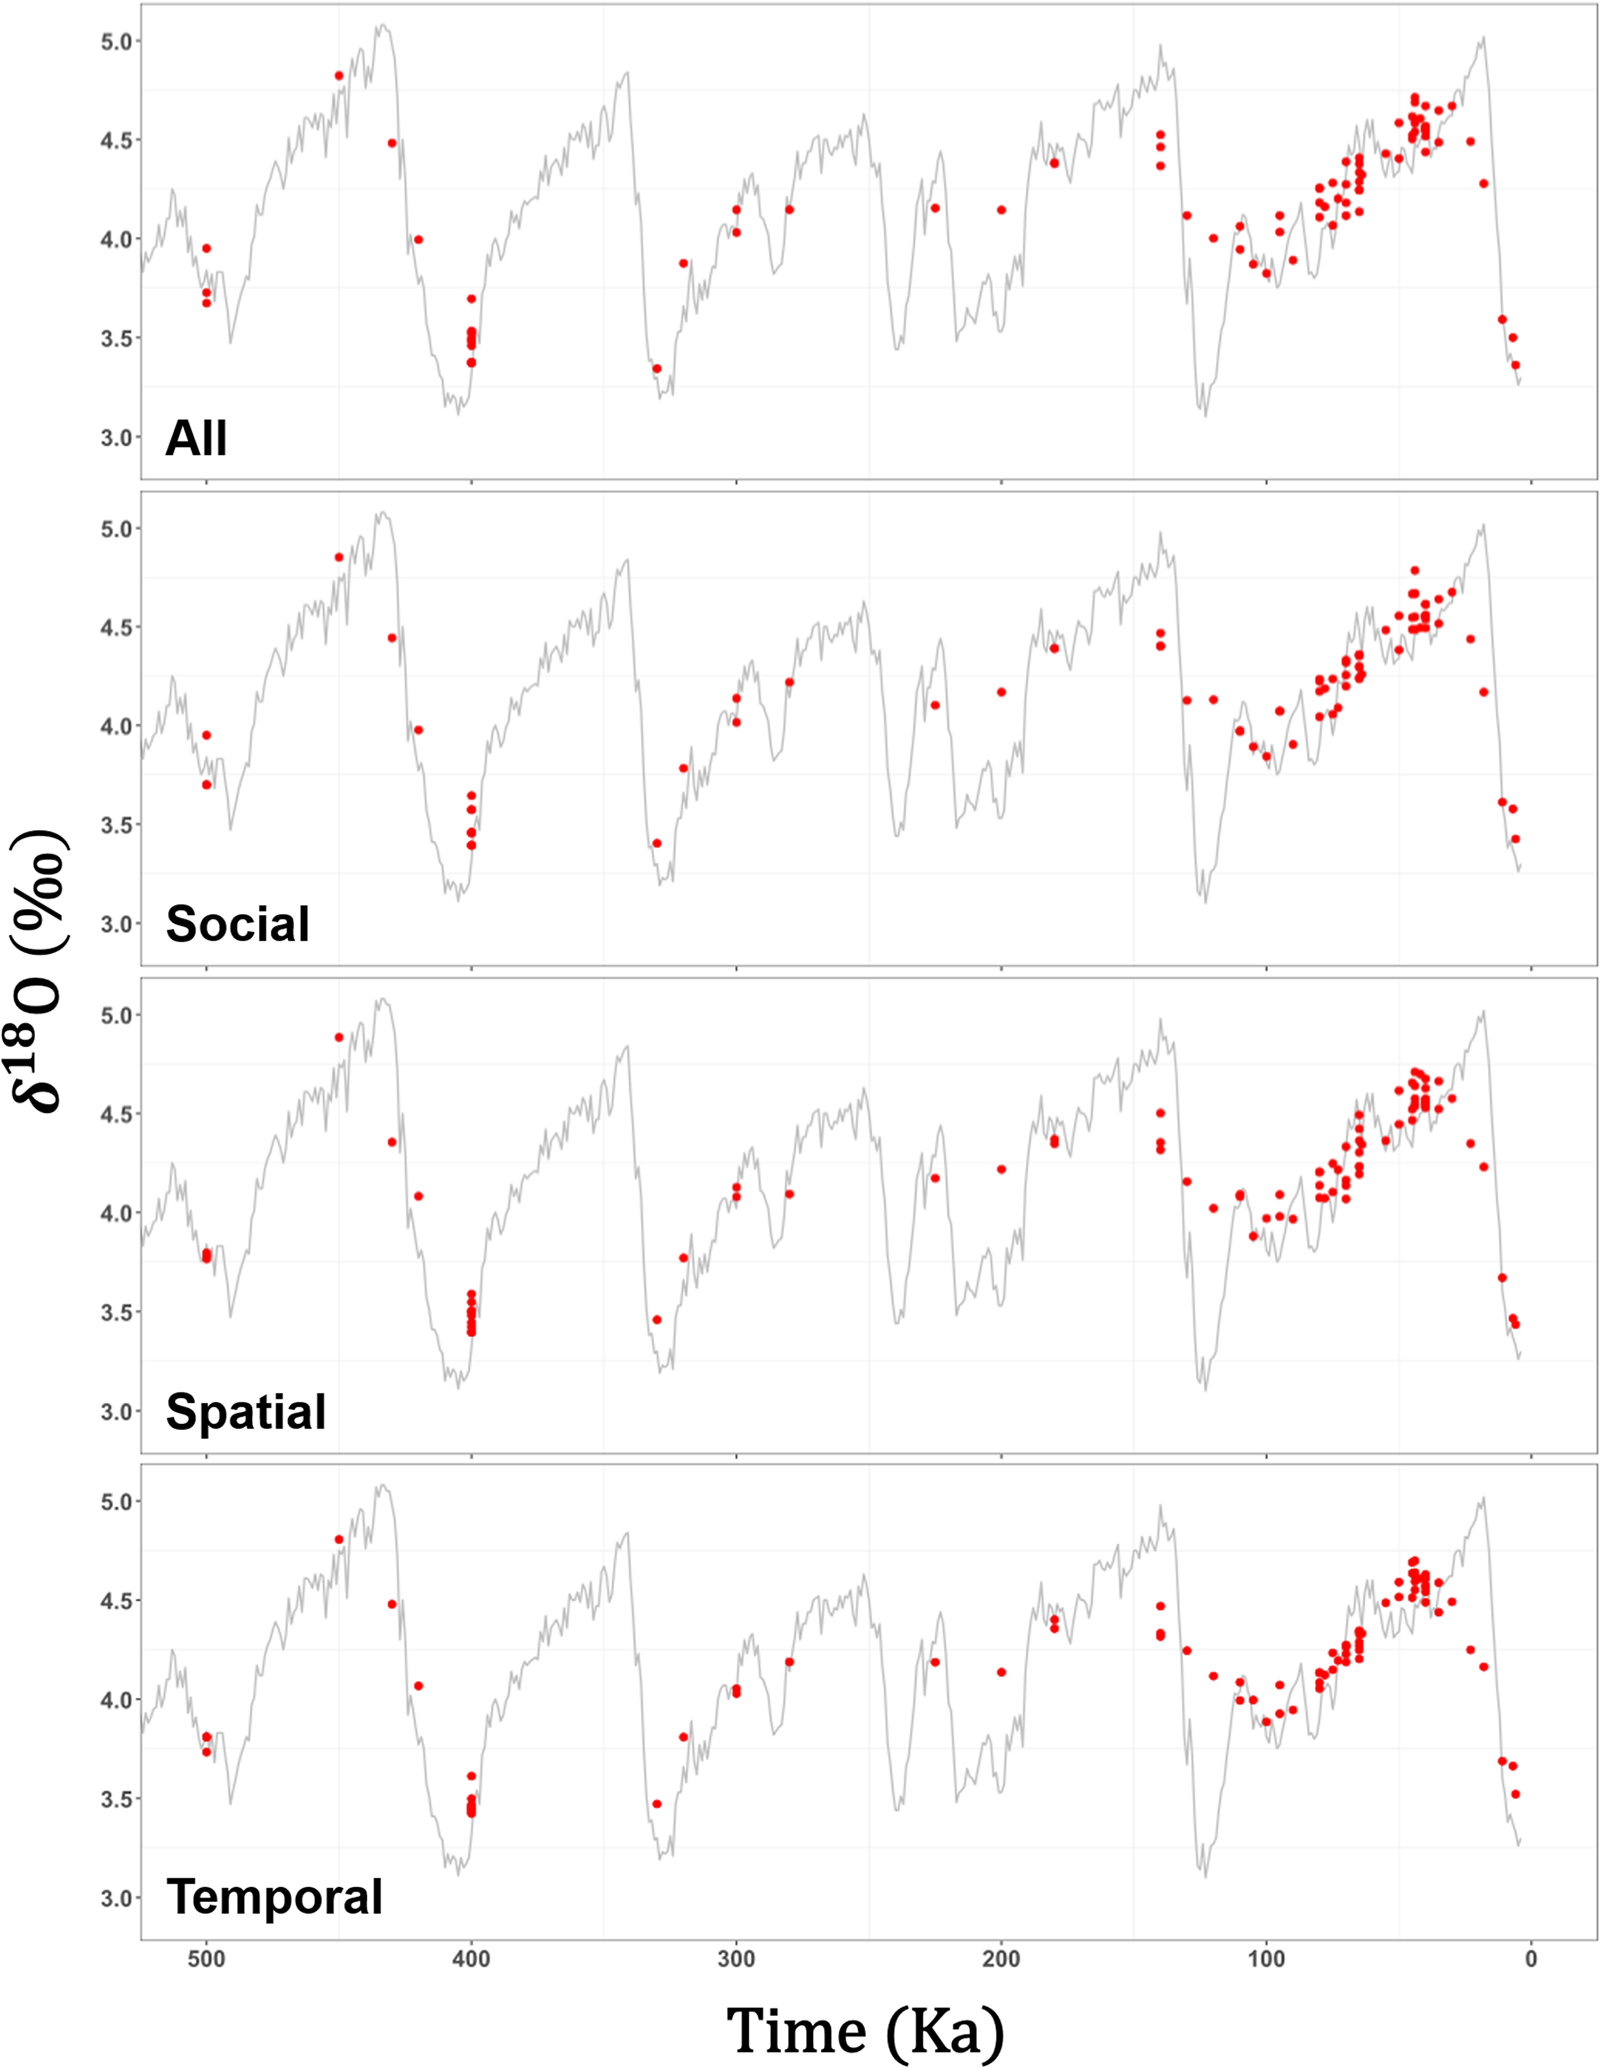
Multivariate analyses reveal a clear alignment between cultural transmission strategies and long-term climatic fluctuations as reconstructed from benthic δ18O values over the past 3.3 My. The model incorporating all transmission modes jointly considers the complete set of scores assigned to the 19 spatial, temporal, and social transmission modes across all cultural traits. It therefore captures the overall structure of cultural transmission characterizing each period rather than the behaviour of any individual transmission mode. When all transmission modes are considered jointly, the alignment with the climatic signal is strongest (Figs 2, S1–19, Table S2) and remains evident, though comparatively weaker, when the three dimensions are analysed separately (Fig. 2). These results indicate that climatic variation is most clearly associated with the configuration of the transmission system as a whole rather than with isolated dimensions. A stronger alignment between cultural transmission variables and climatic dynamics is observed after ∼500 ka (Fig. 3). This stronger alignment probably reflects a combination of factors, including the increased amplitude of climatic oscillations during the Middle and Late Pleistocene and the progressively greater density of archaeologically visible cultural traits available for analysis during this interval.
Raw values in the last 3.3 Ma.

Figure 2 Long description
Four line graphs comparing delta 18 O over time for All, Social, Spatial and Temporal categories. The x-axis represents Time in Ka, ranging from 3000 to 0. The y-axis represents delta 18 O in per mille, ranging from 3.0 to 5.0. Each graph includes a continuous gray line and red point markers. The gray line represents a smoothed trend, while red points indicate specific observations. In the All graph, the line shows increasing variability and peaks near 5.0 closer to 0 Ka, with denser point markers in the later period. The Social graph also shows increased variability and peaks near 5.0 closer to 0 Ka, with a similar pattern of denser markers. The Spatial graph follows a similar trend, with peaks near 5.0 and dense markers closer to 0 Ka. The Temporal graph displays similar variability and peak patterns, with dense markers near 0 Ka. Overall, all graphs show increased variability and higher peaks closer to 0 Ka, with the Temporal graph having slightly more pronounced peaks and denser markers compared to others. The purpose is to illustrate differences in delta 18 O variability across these categories over time.
Raw values for the last 500 ka.

Figure 3 Long description
Four graphs display delta 18 O per mille over time in thousands of years (Ka) with gray lines and red markers. The horizontal axis is labeled Time Ka, ranging from 500 to 0. The vertical axis is labeled delta 18 O per mille, ranging from 3.0 to 5.0. Each graph represents different data: All, Social, Spatial and Temporal. The gray line indicates a continuous trend, while red markers highlight specific data points. In the All graph, the gray line fluctuates between 3.0 and 5.0, with red markers densely clustered from 120 to 0, indicating significant data points. The Social graph shows a similar pattern, with red markers highlighting key points around 420 and a dense cluster from 120 to 0. The Spatial graph follows the same trend, with notable red markers around 420 and a cluster from 120 to 0. The Temporal graph also mirrors this pattern, with red markers indicating significant points around 420 and a dense cluster from 120 to 0. Overall, the graphs illustrate fluctuations in delta 18 O values over time, with each panel showing similar trends but focusing on different aspects of the data.
Because high δ18O values correspond to globally cooler phases (greater ice volume), and low δ18O values to globally warmer phases (reduced ice volume), the ability of the models to reproduce these cyclic patterns indicates that different transmission strategies are differentially associated with these climatic regimes. At a broad scale, simpler, observation-based, and less structured strategies are more closely aligned with globally cooler phases, whereas more complex, explanation-based, modular, and selective strategies are more closely aligned with globally warmer conditions. This pattern is visible across the entire 3.3 Ma record (Fig. 2) and becomes particularly pronounced during the last 500 ka (Fig. 3), when more complex transmission strategies become increasingly prominent.
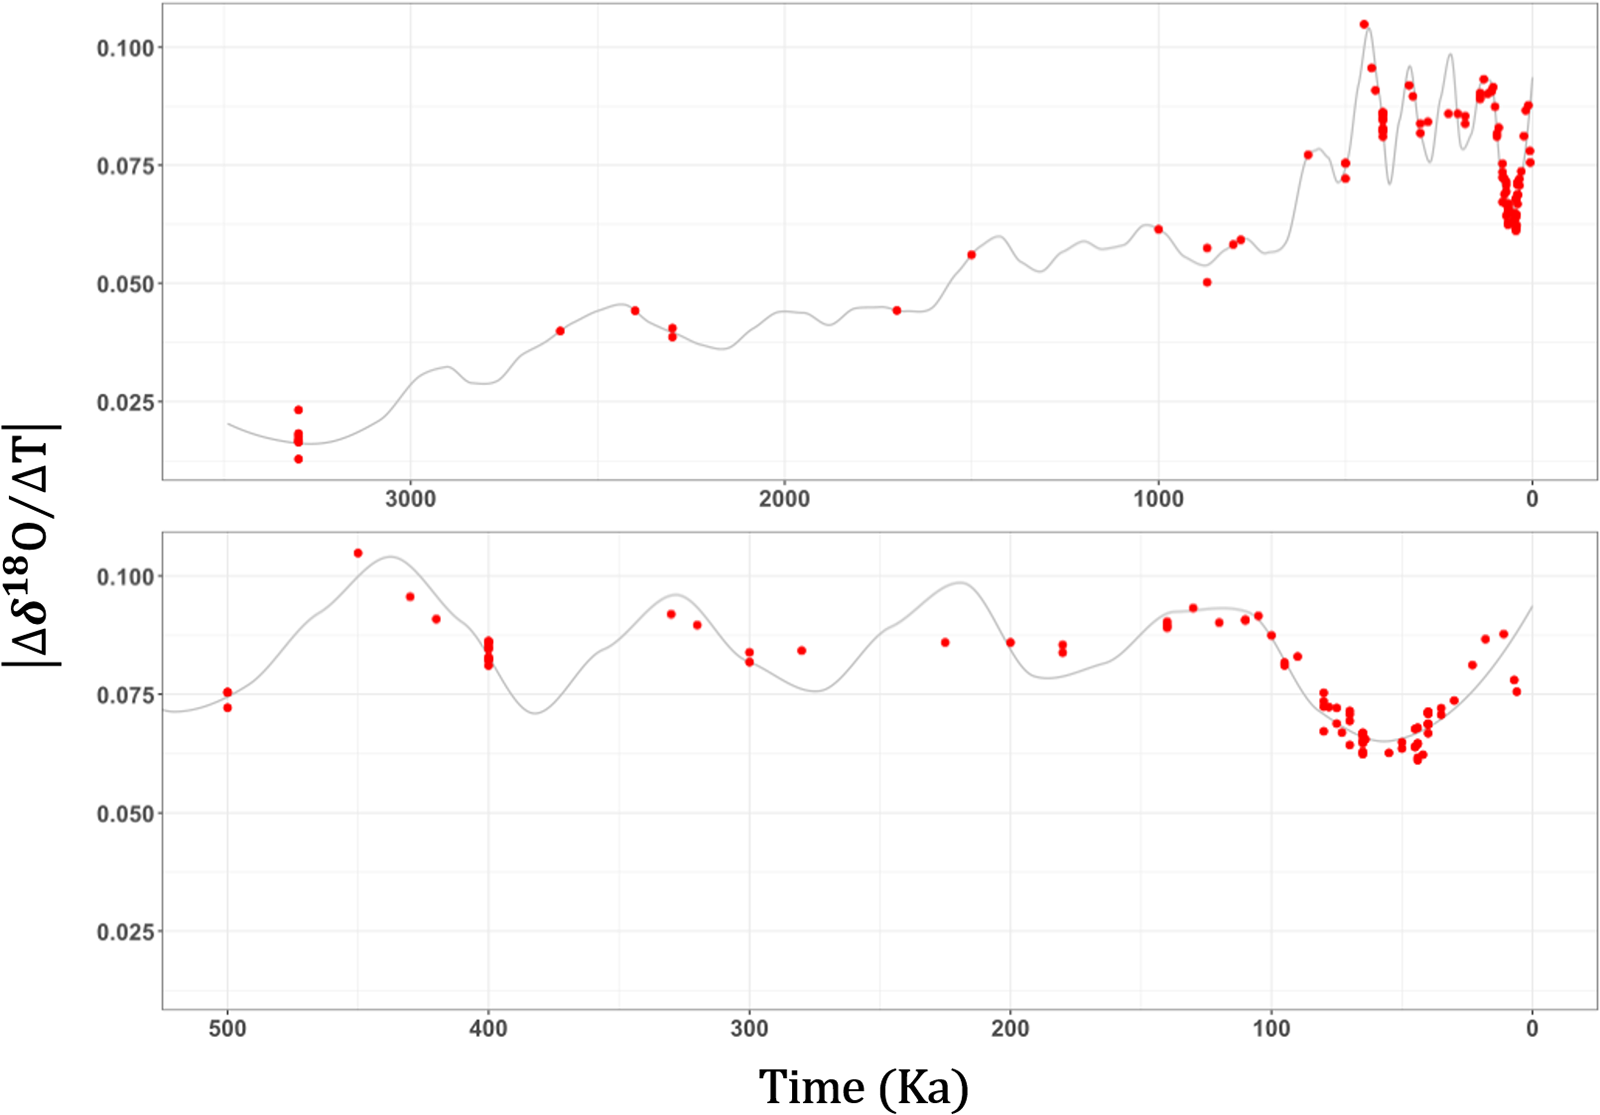
In contrast, the rate of climatic change (|Δδ18O/Δt|) shows weak alignment with cultural transmission variables (Figs 4, S20–38, Table S3). Neither over the full 3.3 Ma timescale nor within the last 500 ka (Fig. 4, Tables S2–5) do the models capture strong correspondence between transmission strategies and the magnitude of climatic fluctuations. This reinforces the interpretation that long-term climatic regimes rather than short-term variability are the primary environmental correlates of changes in transmission strategies.
Rate of change.

Analyses of different combinations of transmission dimensions indicate that the strongest alignment is obtained when spatial, temporal, and social variables are considered together (Table S4, Figs S39–44). When examined separately, the contribution of each dimension differs: spatial variables show the weakest alignment with climatic variation, whereas social variables produce the lowest residuals, indicating a closer correspondence with the climatic signal. Temporal variables occupy an intermediate position.
The complementary reverse modelling analysis (Table S7) shows that the cyclic climatic variables (δ18O/Δδ18O) consistently improve prediction of the multivariate cultural transmission variables relative to null baseline models assuming no association. Across all variable groupings, the inclusion of the climatic signal results in higher explained variance and reduced prediction error, indicating a measurable correspondence between the temporal structure of the climatic record and the configuration of cultural variables. While the magnitude of these effects is not directly comparable to those obtained in the forward modelling framework, the consistency of the results supports the presence of a robust statistical association that is not dependent on model direction.
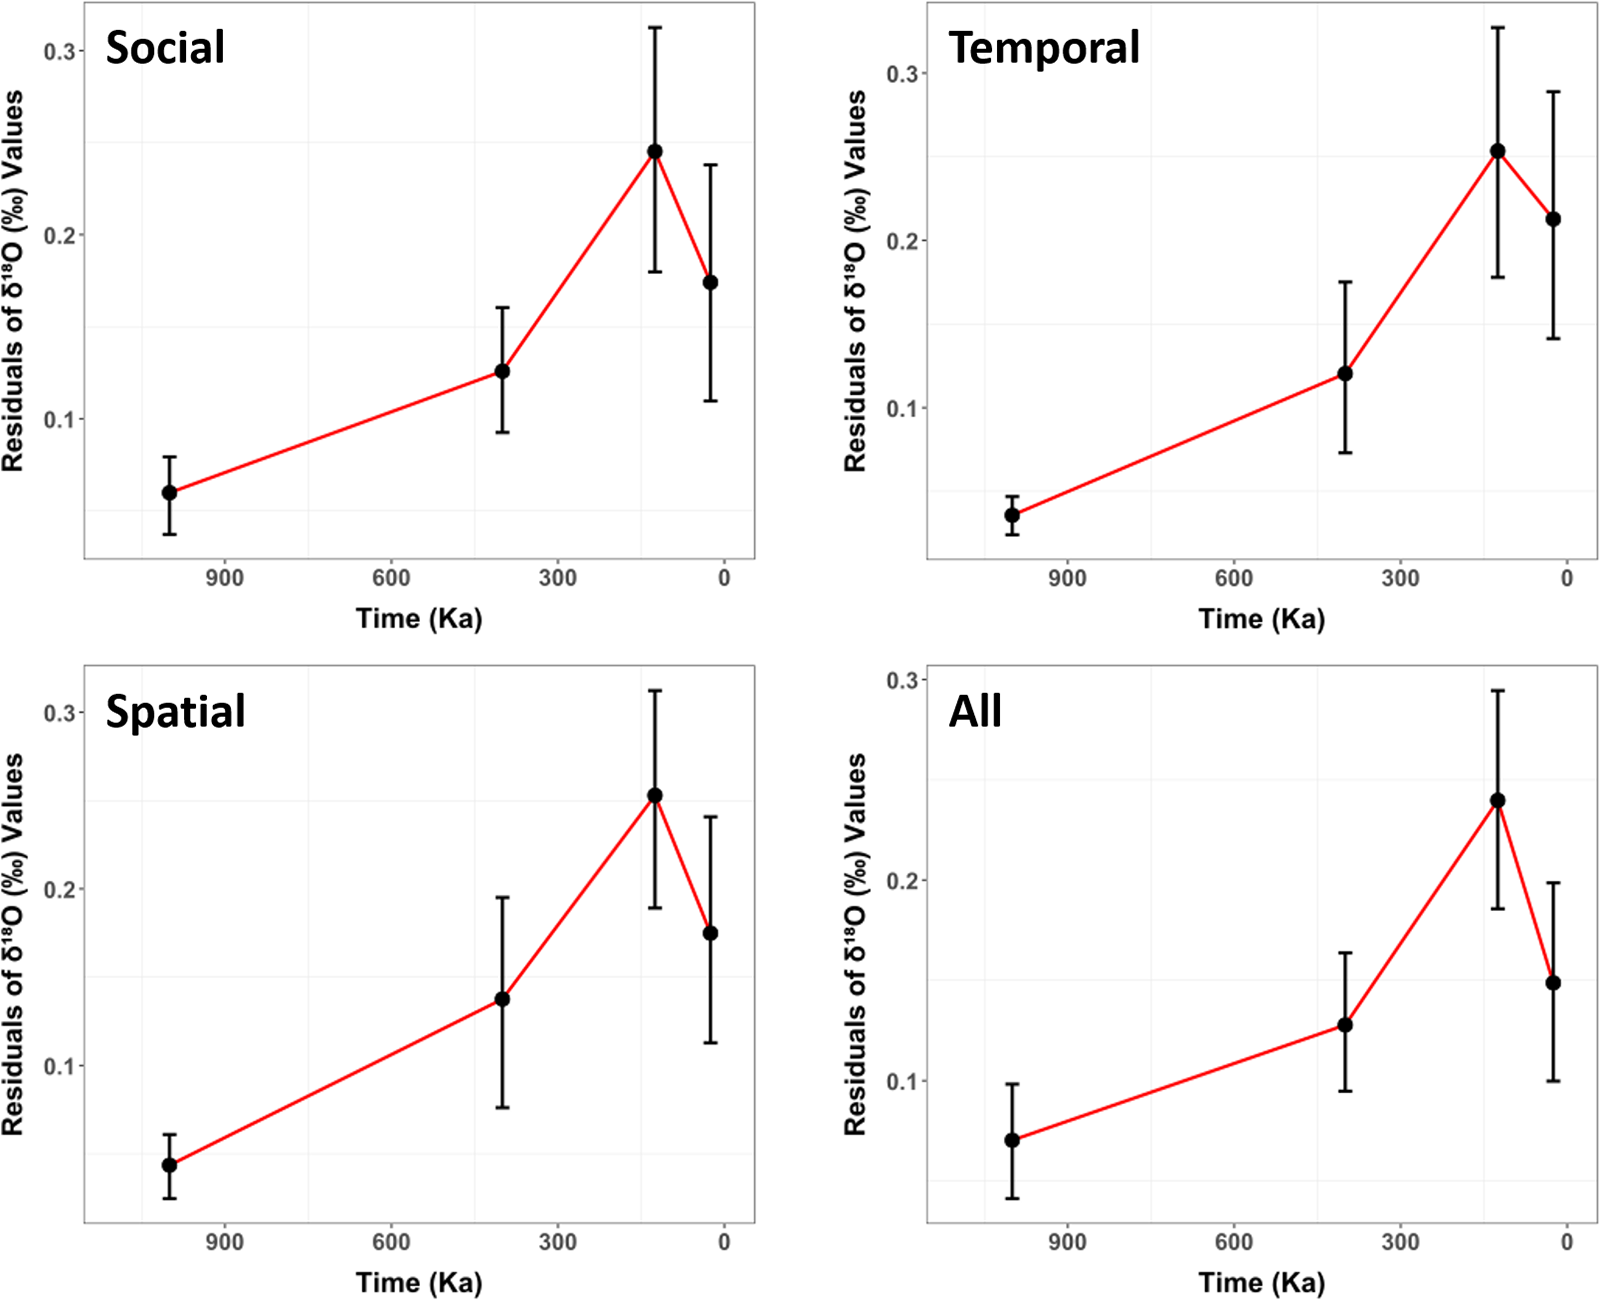
Finally, windowed analyses reveal that the strength of the alignment between climate and cultural transmission strategies varied across evolutionary phases (Fig. 5, Table S7). Residual magnitudes indicate the strongest alignment between 500 and 200 ka, followed by a progressive weakening thereafter. After ∼200 ka, and particularly after 50 ka, the alignment decreases, suggesting that cultural transmission systems became increasingly structured by internal dynamics and less tightly coupled to climatic regimes.
Bootstrapped confidence intervals.

Figure 5 Long description
Social. The vertical axis label reads, Residuals of POC Values. The horizontal axis label reads, Time (Ka). The horizontal axis shows tick labels 900, 600, 300, 0. The vertical axis shows tick labels 0.0, 0.1, 0.2, 0.3. A line connects four plotted points with vertical error bars. The points are approximately at Time 900 with Residuals of POC Values about 0.06, Time 600 with about 0.13, Time 300 with about 0.25 and Time 0 with about 0.18. The image B showing Temporal. The vertical axis label reads, Residuals of POC Values. The horizontal axis label reads, Time (Ka). The horizontal axis shows tick labels 900, 600, 300, 0. The vertical axis shows tick labels 0.0, 0.1, 0.2, 0.3. A line connects four plotted points with vertical error bars. The points are approximately at Time 900 with Residuals of POC Values about 0.04, Time 600 with about 0.12, Time 300 with about 0.25 and Time 0 with about 0.20. The image C showing Spatial. The vertical axis label reads, Residuals of POC Values. The horizontal axis label reads, Time (Ka). The horizontal axis shows tick labels 900, 600, 300, 0. The vertical axis shows tick labels 0.0, 0.1, 0.2, 0.3. A line connects four plotted points with vertical error bars. The points are approximately at Time 900 with Residuals of POC Values about 0.05, Time 600 with about 0.14, Time 300 with about 0.26 and Time 0 with about 0.18. The image D showing All. The vertical axis label reads, Residuals of POC Values. The horizontal axis label reads, Time (Ka). The horizontal axis shows tick labels 900, 600, 300, 0. The vertical axis shows tick labels 0.0, 0.1, 0.2, 0.3. A line connects four plotted points with vertical error bars. The points are approximately at Time 900 with Residuals of POC Values about 0.06, Time 600 with about 0.13, Time 300 with about 0.25 and Time 0 with about 0.16.
Discussion
The goal of this study was to investigate whether long-term climatic dynamics are associated with changes in the cultural transmission strategies that enabled innovations to become stable within hominin societies. By integrating archaeological data on the transmission of emerging cultural traits with a continuous palaeoclimatic record, our analysis provides a long-term, global perspective on the relationship between environmental conditions and the organization of cultural transmission systems. Our choice of a global analytical framework reflects the scale of the question addressed here. After the early dispersal of Homo beyond Africa, hominin populations occupied increasingly diverse ecological settings across Africa and Eurasia. The long-term evolution of cultural transmission therefore likely resulted from processes operating across multiple populations experiencing different environmental conditions rather than from the history of any single region. A globally representative archaeological dataset is thus an appropriate starting point for identifying macroevolutionary patterns, although it necessarily sacrifices regional resolution.
A central result is that, within a previously documented long-term trend towards increasingly complex transmission strategies (Colagè & d’Errico, Reference Colagè and d’Errico2025), variation in the transmission modes shows a structured alignment with long-term climatic phases, but not with the rate of climatic fluctuations. Periods of rapid climatic change do not exhibit a distinctive association with transmission patterns. Instead, transmission modes vary systematically with the long-term major climatic oscillations, suggesting that hominin learning systems were more closely associated with enduring environmental conditions than with short-term or abrupt climatic shifts. Importantly, these results do not imply a simple or direct causal relationship between climate and cultural transmission. Rather, they indicate that climatic regimes and transmission strategies covaried over long timescales, likely because environmental conditions influenced the costs, benefits, and constraints under which different learning strategies operated. In this perspective, climate acts as a structuring background condition rather than a deterministic driver of cultural change.
This interpretation helps clarify how our results relate to previous studies of Middle Palaeolithic cultural variability in relation to climate through changes in tool-type diversity. For example, Bocquet-Appel and Tuffreau (Reference Bocquet-Appel and Tuffreau2009) found that Neanderthal technological systems persisted across major climatic oscillations, suggesting a degree of cultural resilience. However, their analysis focused on variation within already established technological systems. In contrast, our approach targets the first consolidated appearance of innovations, and the transmission systems required to sustain them over time. Mature technological systems that persist across climatic fluctuations would not be expected to contribute strongly to the pattern identified here. Our results therefore address a different scale of analysis: not variability within existing traditions but the conditions under which new cultural traits become stabilized and transmitted across generations. An alternative, and potentially complementary, explanation is that climatic conditions influenced cultural transmission indirectly through their effects on population size, population connectivity, and the structure of social networks. Larger and more interconnected populations may be better able to maintain complex cultural repertoires and the sophisticated transmission systems required for their faithful transmission (Henrich, Reference Henrich2004). Under this scenario, part of the association identified here may reflect demographic processes mediated by climate rather than a direct effect of climate on transmission strategies. Evaluating this possibility will require the integration of independent demographic proxies into future analyses.
An important perspective on the relationship between environmental variability and cultural evolution is provided by theoretical models proposing that culture is particularly advantageous under intermediate levels of environmental variability, especially at temporal scales too rapid for genetic adaptation but too structured for purely individual learning (Boyd & Richerson, Reference Boyd and Richerson1996; Richerson & Boyd, Reference Boyd and Richerson2005, Reference Richerson, Boyd, Heyes and Huber2000). In this framework, millennial- and sub-millennial-scale climatic variability – such as Dansgaard–Oeschger-type fluctuations – has been proposed as a key driver of the evolution of human cultural capacities. Our findings do not imply that shorter-term climatic variability played no role in the evolution of cultural transmission. Recent high-resolution palaeoclimatic records indicate that millennial-scale variability intensified during the Middle and Late Pleistocene, particularly during glacial periods (Hodell et al., Reference Hodell, Crowhurst, Lourens, Margari, Nicolson, Rolfe, Skinner, Thomas, Tzedakis and Mleneck-Vautravers2023). Such fluctuations may have affected hominin populations through changes in resource predictability, habitat fragmentation, and demographic connectivity, potentially influencing cultural transmission in ways that are not captured by the long-term climatic proxy used here.
The present study does not directly capture such high-frequency variability, as it focuses on long-term climatic trends and on the first consolidated appearance of cultural traits, which are necessarily resolved at coarse temporal scales. Exploring this question will require integrating higher-resolution palaeoclimatic records or climate simulations with regionally resolved archaeological datasets.
Moreover, both orbital- and suborbital-scale climatic variability are known to produce regionally heterogeneous ecological outcomes, particularly in Africa where low-latitude processes such as ENSO and Walker circulation generate spatially contrasting environmental conditions. Such patterns are not represented by global proxies such as the LR04 δ18O stack.
Incorporating these temporal and spatial dimensions would require combining regionally resolved palaeoclimatic reconstructions – potentially derived from emulator-based approaches – with a substantially larger and more finely resolved archaeological dataset than is currently available.
Our results should therefore be interpreted as addressing a different, complementary dimension of the climate–culture relationship: not the emergence of culture in response to short-term environmental instability or regional ecological variability but the long-term organization and stabilization of cultural transmission systems. In this perspective, different temporal and spatial scales of climatic variability may have influenced distinct aspects of cultural evolution, with high-frequency and regionally variable environments shaping adaptive flexibility and innovation, and long-term climatic regimes structuring the transmission systems that allow cultural traits to persist across generations.
A second key result is that globally cooler and warmer phases are associated with different configurations of cultural transmission. During globally cooler phases (higher δ18O values), the cultural traits that persist in the archaeological record tend to be associated with low-investment, observation-based learning strategies. These modes require limited teaching effort and facilitate the diffusion of relatively simple behaviours. In contrast, during globally warmer phases (lower δ18O values), innovations are more frequently associated with structured, selective, and explanation-based transmission strategies, involving more explicit communication, sequencing of actions, and modular learning. These strategies entail higher cognitive and social investment but allow more faithful transmission and cumulative elaboration.
At first glance, this pattern appears inconsistent with ethnographic observations of hunter-gatherers, where populations living in high ecological-risk environments (e.g., Arctic, desert, or periglacial settings) tend to maintain extensive social networks that facilitate information exchange, mutual assistance, and the buffering of subsistence uncertainty (Collard & Foley, Reference Collard and Foley2002; Foley & Mirazón Lahr, Reference Foley and Mirazón Lahr2011; Hamilton et al., Reference Hamilton, Lobo, Collard, Walker and Buchanan2025; Hill et al., Reference Hill, Walker, Božičević, Eder, Headland, Hewlett, Hurtado, Marlowe, Wiessner and Wood2011). Such systems often limit cultural and linguistic fragmentation, whereas benign or predictable environments tend to support more localized social structures and a proliferation of distinct cultural and linguistic traditions (Nettle, Reference Nettle2012). However, social connectivity and cultural complexity should not be conflated. High ecological risk does not necessarily produce more complex cultural traits; rather, it promotes broader and more stable social networks as risk-pooling mechanisms – hxaro-type exchange systems, partnership networks, and long-distance information circuits – rather than uniformly complex technologies or behaviours. This distinction helps reconcile our results with ethnographic patterns. In fact, classic models of technological investment argue that harsh or unpredictable environments often favour low-cost, reliable, and rapidly learnable technologies, while costly and specialized tools are selected when risk is high but resources are seasonal, predictable, and of high return (Collard et al., Reference Collard, Kemery and Banks2005, Reference Collard, Buchanan, O’Brien and Scholnick2013; Torrence, Reference Torrence, Panter-Brick, Layton and Rowley-Conwy2001; Sterelny, Reference Sterelny2021). This means ecological risk can generate either simplification or elaboration, depending on the structure of the foraging niche. Crucially, maintaining complex cultural traits requires not only population connectivity but also transmission systems capable of sustaining high-fidelity learning. Demographic and cultural evolutionary modelling demonstrates that population size and inter-group connectivity are key determinants of whether complex skills are lost or maintained (Derex & Mesoudi, Reference Derex and Mesoudi2020; Powell et al., Reference Powell, Shennan and Thomas2009). These models imply that social networks expand under ecological stress because larger, more interconnected populations are better able to preserve complex knowledge – not because harsh environments necessarily generate more complexity spontaneously. Recent work has further emphasized the central role of large-scale cooperative social structures in stabilizing shared cultural norms and enabling high-fidelity information transmission in recent humans (Hill et al., Reference Hill, Walker, Božičević, Eder, Headland, Hewlett, Hurtado, Marlowe, Wiessner and Wood2011). Taken together, these studies show that in fully modern social and communicative systems, ecological risk is often mitigated through the expansion of social networks, whereas cultural complexity depends on the interaction between environmental structure, demographic factors, and the sophistication of cultural transmission mechanisms. Thus, the ethnographic pattern does not contradict our results: it reflects a socio-cognitive configuration specific to recent humans, in which complex teaching, symbolic communication, and large-scale cooperation jointly support the retention of intricate cultural traits. Our results suggest that such a system was not fully established during most of the Pleistocene. Before ∼200 ka, globally cooler phases likely coincided with reduced population size and connectivity, favouring demographic fragmentation and lower-investment transmission strategies. It is primarily during globally warmer phases, and more markedly after ∼200 ka, that structured and explanation-based learning became increasingly prominent, eventually enabling the formation of larger and more stable social networks. The transition from verbal teaching accompanied by action (∼100 ka) to teaching in the absence of action (∼50 ka), as documented by Colagè and d’Errico (Reference Colagè and d’Errico2025), provides a plausible mechanism for this qualitative shift. Only once high-fidelity, explanation-based transmission became possible, the ethnographic pattern documented by Nettle, Collard, Foley, and others could emerge: high-risk environments supported large cooperative networks and the stability of complex cultural knowledge.
A third important result is that climatic dynamics are more strongly associated with cultural transmission when the system is considered as a whole than when its individual dimensions are analysed separately. Spatial, temporal, and social components show weaker associations with climate when considered in isolation, whereas their combined configuration exhibits a clear alignment with climatic patterns. This indicates that climate shaped the configuration of transmission systems rather than any single feature of cultural transmission. Transmission is systemic: the relationships and interactions between teacher and learner, the temporal structuring of information transfer, and social filtering mechanisms influenced one another.
Finally, the strength of alignment between climatic variation and transmission strategies changes over time. The association is strongest between 500 and 200 ka, a period marked by the emergence of innovations requiring planning depth and structured learning (e.g., Levallois technology, complex adhesives, composite tools, heat-based transformations of materials). These traits presuppose structured transmission and are incompatible with low-fidelity observational learning alone.
After ∼200 ka, and especially after 50 ka, this alignment weakens. Cultural transmission systems appear to follow increasingly autonomous dynamics, becoming less tightly coupled to climatic regimes. We interpret this pattern as evidence for the progressive emergence of epistemic niche construction (d’Errico et al., Reference d’Errico, Meneganzin and Colagè2026). Through the development of structured teaching, symbolic communication, and material supports for knowledge storage, hominin populations increasingly externalized and stabilized information. These processes would have buffered cultural transmission against environmental fluctuations, allowing cultural systems to persist and accumulate independently of immediate ecological constraints. In this sense, the weakening of the alignment between climate and transmission strategies reflects not the disappearance of environmental influence but the growing capacity of cultural systems to mediate and transform that influence.
However, a limitation of the present study is the use of a global climatic proxy (LR04 δ18O), which does not capture regional and local environmental variability experienced by hominin populations. Climatic conditions during the Pliocene and Pleistocene varied substantially across regions, particularly in terms of precipitation regimes and ecological structure. Incorporating regionally resolved palaeoclimate records would provide a more fine-grained understanding of how local environments are associated with cultural transmission strategies. However, the coarse spatial and temporal resolution of the archaeological record for many of the cultural traits considered here currently limits the feasibility of such an approach at a global scale. Future work combining high-resolution regional climate records, multivariate approaches (e.g., Principal Component Analysis (PCA) of climatic proxies), and improved geospatial attribution of cultural traits may help address this issue.
Supplementary material
The supplementary material for this article can be found at https://doi.org/10.1017/ehs.2026.10068.
Data availability statement
Climate data are available here: https://lorraine-lisiecki.com/stack.html.
Description of the cultural traits: https://doi.org/10.1371/journal.pone.0325059.s002.
Cultural data are available here: https://doi.org/10.1371/journal.pone.0325059.s006.
All codes used for the present analyses are available online at the following repository: https://github.com/LACourtenay/climate_change_cultural_transmission_regression: GitHub – LACourtenay/climate_change_cultural_transmission_regression: Support code for the paper titled ‘The impact of climate change on the evolution of cultural transmission strategies in the human lineage’ by Francesco d’Errico, Ivan Colagé, and Lloyd A. Courtenay.
Acknowledgements
We thank Maria Fernanda Sánchez Goñi for useful discussions on the climate data. This manuscript is our own original work, does not duplicate previously published work, and is not currently under consideration for publication at other journals.
Author contributions
CRediT Taxonomy: F.d’E.: Conceptualization – equal, data curation – supporting, formal analysis – supporting, funding acquisition – lead, investigation – equal, methodology – supporting, project administration – lead, resources – lead, software – supporting, supervision – supporting, validation – equal, visualization – supporting, writing – original draft – equal, writing – review and editing – equal. I.C.: Conceptualization – equal, data curation – equal, formal analysis – supporting, funding acquisition – equal, investigation – equal, methodology – supporting, project administration – equal, resources – equal, software – supporting, supervision – equal, validation – equal, visualization – supporting, writing – original draft – equal, writing – review and editing – equal. L.A.C.: Conceptualization – equal, data curation – equal, formal analysis – lead, funding acquisition – supporting, investigation – equal, methodology – lead, project administration – supporting, resources – supporting, software – lead, supervision – supporting, validation – supporting, visualization – lead, writing – original draft – equal, writing – review and editing – equal.
Financial support
F.d’E. and L.A.C. acknowledge support from the European Research Council (ERC) under the European Union’s Horizon 2020 programme to the project ‘Evolution of Cognitive Tools for Quantification (QUANTA)’, contract no. 951388. F.d’E. acknowledges support from the Research Council of Norway through its Centres of Excellence funding scheme (SFF Centre for Early Sapiens Behaviour, SapienCE – project number 262618). F.d’E.’s research is also supported by the Talents programme of the University of Bordeaux IdEx (grant number: 191022_001) and the Association for Trans-Eurasia Exchange and Silk Road Civilization Development (ATES). F.d’E. and I.C. research is funded by the Grand Programme de Recherche ‘Human Past’ of the Initiative d’Excellence (IdEx) of the same university. I.C.’s research is also funded by a research grant on ‘Creativity’ (grant PRI-HCR) at the Pontifical University of the Holy Cross, Rome. L.A.C. is also funded by the Agence Nationale de la Recherche for the Access-ERC project BSMART (ANR-2025-AERC-0005).
Competing interests
We declare no conflicts of interest.


 Open access

