


Introduction
It is believed that the Arctic will warm preferentially under global climate change. Detailed knowledge of the change in volume of Arctic glaciers and ice caps is therefore important for predictions of future global sea-level rise (Reference Dowdeswell, Hagen, Bamber and PayneDowdeswell and Hagen, 2004). Understanding physical processes that produce a volume change is important both for identifying the effect of climate change on ice masses and for predicting future changes. Elevation change rates measured by altimeter surveys can provide a direct estimate of net changes of an ice mass if corrected for vertical motion of the underlying bedrock (Reference Wingham, Ridout, Scharroo, Arthern and ShumWingham and others, 1998) and variations in densification rate (Reference Zwally and LiZwally and Li, 2002).
The NASA Arctic Ice Mapping (AIM) missions used an airborne laser altimeter (the Airborne Topographic Mapper (ATM)) to conduct repeat surveys over the Greenland ice sheet (e.g. Reference Krabill, Thomas, Jezek, Kuivinen and ManizadeKrabill and others, 1995b, Reference Krabill1999, Reference Krabill2000). Airborne laser altimeters have also been used over other ice masses such as Alaskan glaciers (Reference Arendt, Echelmeyer, Harrison, Lingle and ValentineArendt and others, 2002), providing reasonably extensive spatial coverage when compared to most in situ techniques.
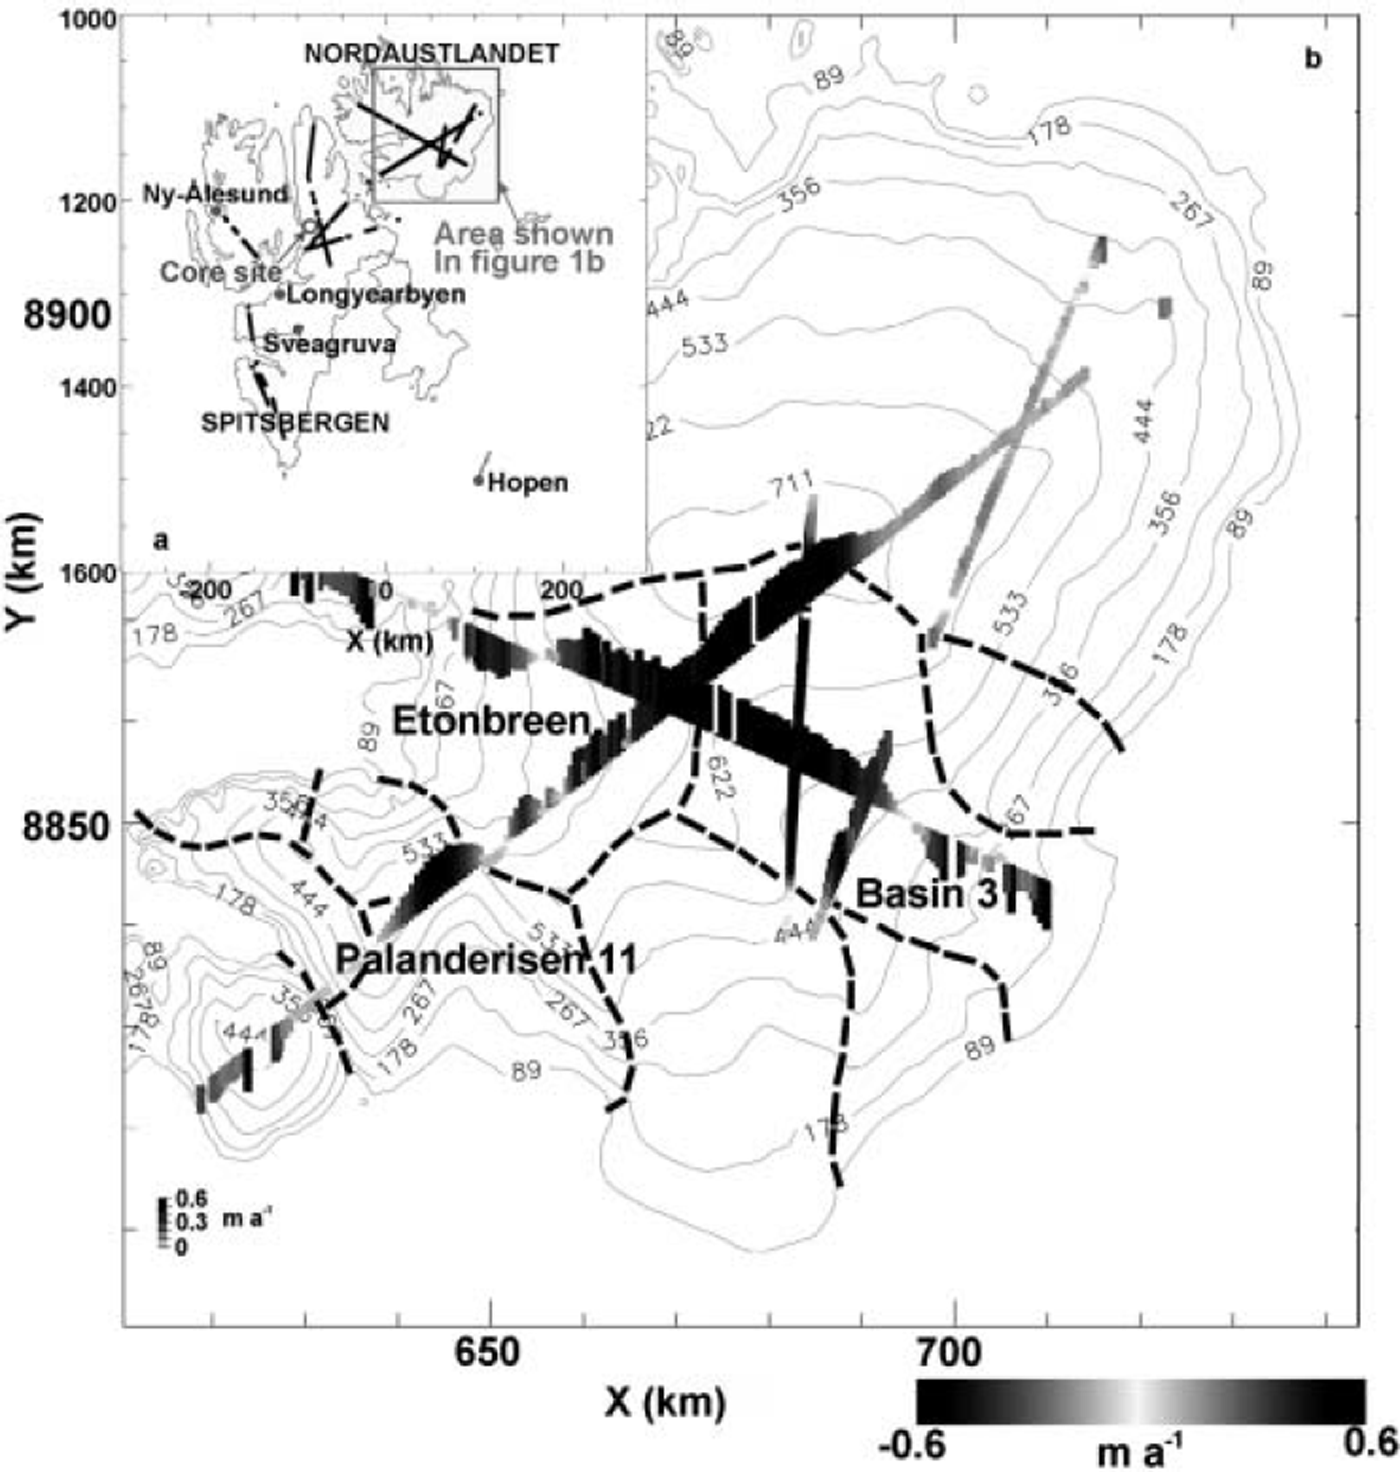
Mass-balance studies in the Svalbard archipelago have, in the past, mainly focused on local in situ studies of individual glaciers such as Kongsvegen on Spitsbergen (Reference Melvold and HagenMelvold and Hagen, 1998). However, over the periods 23–24 May 1996 and 20–23 May 2002, airborne laser-altimetry surveys were made over 17 Svalbard glaciers and ice caps (Fig. 1a) using the ATM (Reference Bamber, Krabill, Raper and DowdeswellBamber and others, 2005). Results show a large positive ice-surface elevation change rate (average 0.5 m a–1) over 15% of the accumulation area of Austfonna, the largest ice cap in the archipelago, situated on Nordaustlandet, eastern Svalbard, and this was attributed to loss of perennial sea ice in the adjacent Barents Sea (Reference Bamber, Krabill, Raper and DowdeswellBamber and others, 2004).
(a) The Svalbard archipelago showing the flight-lines of the NASA P-3 aircraft during the 1996 and 2002 surveys in black. The meteorological stations for which there were reliable data are shown with solid grey circles. The location of the Lomonsovfonna core site is marked with an unfilled grey circle. Island names are in capitals. The location of the area in (b) is shown by a grey rectangle. (b) Surface elevation change rates over the ice cap of Austfonna overlaid on a contour plot of surface elevation. Contour lines are in metres. Drainage basins in the area of large thickening rates are marked with dashed lines. Elevation change rates are represented by both shading and bar length.
Study Area
Svalbard is a Eurasian Arctic archipelago lying in the region 76–80.5˚N, 10–28˚E and with four main islands, Spitsbergen, Nordaustlandet, Barentsoya and Edgeoya. Nordaustlandet and Spitsbergen were surveyed by the ATM (Fig. 1a).
Austfonna is the largest ice cap in the Eurasian Arctic and has an area of 8120 km2 and a maximum altitude of 783 m (Reference Dowdeswell, Drewry, Cooper, Gorman, Liestøl and OrheimDowdeswell and others, 1986). The eastern side of the archipelago receives the highest precipitation which, brought by low-pressure systems from the Barents Sea, is 400–800mmw.e. (Reference Hagen, Liestøl, Roland and JørgensenHagen and others, 1993).
Observations of Elevation Change
The ATM is a conically scanning, airborne laser altimeter operating at a wavelength of 523 nm (in the blue–green spectral region), with an off-nadir scanning angle of up to 22.5˚. This produces overlapping ellipses of data points along-track, giving a relatively wide swath beneath the aircraft that permits easier resurveying (Reference AbdalatiAbdalati and others, 2001).
For the Svalbard survey, aboard the NASA P-3 aircraft, the laser pulse repetition frequency was 5 kHz and the aircraft was operating at an altitude of about 400 m. This gave a swath width of about 150 m (Reference Krabill, Thomas, Jezek, Kuivinen and ManizadeKrabill and others, 1995b). The scanner rotation speed was 20 Hz in 2002 and 10Hz in 1996, which gave an along-track data point spacing of 3 and 6 m respectively. Flight-lines are shown in Figure 1a.
Average elevation change rates over the 6 year interval between the two surveys were obtained by comparing each May 1996 observation with May 2002 data that fell within a 2 m radius. Results were averaged over 300m along-track segments to produce estimates of elevation change rates. Absolute ice-surface elevations were obtained with an accuracy of 0.1 m rms (Reference Krabill, Thomas, Martin, Swift and FrederickKrabill and others, 1995a), permitting elevation change rates of >0.023 ma–1 to be determined unambiguously (Reference Bamber, Krabill, Raper and DowdeswellBamber and others, 2004).
Elevation change rates calculated over Austfonna are shown in Figure 1b. Large thickening rates (average 0.5 m a–1) were observed above elevations of about 450 m to the southwest, rising to around 650 m on the northeast side of the ice cap. The maximum growth rate was estimated to be equivalent to a 35–40% increase in snowfall from the long-term annual accumulation rate, which is 0.4–0.6 mw.e. (Reference Pinglot, Hagen, Melvold, Eiken and VincentPinglot and others, 2001) over the area of thickening when corrected from firn to water equivalent values (Reference Bamber, Krabill, Raper and DowdeswellBamber and others, 2004). Lower-amplitude thickening (about 0.1 m a–1) was observed on the northeast side of the ice cap between 400 and 650 m, with thinning below 400 m averaging 0.25 m a–1. The thickening at higher elevations was unexpected given the results of previous mass-balance studies on Svalbard ice masses, which suggest a consistently negative mass balance since 1950. However, these studies have been generally restricted to low-elevation glaciers (Reference Dowdeswell, Hodgkins, Nuttall, Hagen and HamiltonDowdeswell and others, 1995).
Interpretation
Possible causes of the pattern of elevation change observed on Austfonna can be loosely divided into those resulting from a change in ice-cap dynamics and those related to surface mass balance (and, by definition, climate). Here, we consider the likelihood of both these factors being responsible for the observed elevation changes.
Changing ice dynamics
Ice-dynamical causes of elevation change may be divided into surge- and non-surge-related velocity changes. Surging was considered as a possible mechanism for causing the observed elevation changes because anywhere between 13% (Reference Jiskoot, Murray and BoyleJiskoot and others, 2000) and 90% (Reference Lefauconnier and HagenLefauconnier and Hagen, 1991) of glaciers on Svalbard are surge-type. Furthermore, a number of drainage basins on Austfonna such as Etonbreen and Brasvellbreen are known to have surged since the 1930s (Reference Hagen, Liestøl, Roland and JørgensenHagen and others, 1993). The surge-related mechanism, which may produce positive elevation change rates, results from the velocity slowdown following a surge, and the consequent ice build-up during a surging glacier’s quiescent phase. This hypothesis would not, however, produce the pattern of elevation changes observed on Austfonna. The highest rates of elevation change would be expected at lower elevations where the ice thickness had changed most during the surge. Lower rates of elevation change would be expected close to the ice divides (Reference Dowdeswell, Drewry, Cooper, Gorman, Liestøl and OrheimDowdeswell and others, 1986). This is the opposite pattern of elevation change to that observed.
In addition, a surge-induced signal would be expected to produce differences in elevation change for different basins that have surged at different times. Etonbreen and Basin 3, for example (see Fig. 1b), are believed to have surged in 1938 and 1870, respectively, but show no variation in elevation change rate across the drainage divide. Furthermore, high rates of thickening are also seen on Palanderisen 11 (Fig. 1b), but this basin displays no evidence of surge-type behaviour (Reference Lefauconnier and HagenLefauconnier and Hagen, 1991). Some Austfonna outlet glaciers are known to have a long quiescent period (Reference Lefauconnier and HagenLefauconnier and Hagen, 1991) and could show similar patterns of build-up despite having surged at different times. Basin 3, however, showed surge-type activity between summer 1991 and February 1992 (Reference Dowdeswell, Unwin, Nuttall and WinghamDowdeswell and others, 1999). It is difficult to see how these three flow units would produce contemporaneously identical responses in elevation change rates.
For a non-surge-related velocity slowdown, an order-of-magnitude calculation of the velocity reduction (Δve) needed to produce the observed elevation change was compared to velocity measurements derived from synthetic aperture radar interferometry (Reference Dowdeswell, Unwin, Nuttall and WinghamDowdeswell and others, 1999). The interferometry measurements had an estimated error of 0.1 m a-1 and showed that the outlet glacier velocity of Basin 3 at 15 km from the ice divide (the approximate limit of the area of thickening) was 10-20ma–1 in both February 1992 and January 1994.
The order-of-magnitude velocity reduction (Δve) required to produce the observed elevation change was calculated. Maximum and minimum ice surface areas experiencing high (average 0.5 m a-1) and moderate (average 0.1 ma–1) rates of thickening were approximated. Bedrock-height and ice-thickness data from Scott Polar Research Institute and Norskpolarinstitutt 1983 airborne radio-echo sounding (RES) missions (Reference Unwin and WinghamUnwin and Wingham, 1997) were used to produce maximum and minimum estimates of ice thickness at the perimeter of the thickening areas. The velocity slowdown required to explain the total thickening on Austfonna was calculated using the equation:
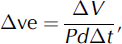
where ΔV is the increase in volume (elevation change rate averaged over measured area multiplied by measured area), P is the perimeter length, d is the average ice depth at the perimeter and Δt is 6years. The volumes experiencing moderate and high thickening rates were combined and estimate a velocity decrease of 4.5-12.7ma-1 over the entire perimeter of the area of thickening. The large range of values was due to the sparse track coverage available. This represents a minimum decline in velocity of >20% when compared to the velocities measured by Reference Dowdeswell, Unwin, Nuttall and WinghamDowdeswell and others (1999). Moreover, the actual velocity slowdown required would be larger because mass is removed preferentially through the four to five outlet glaciers rather than equally through the entire perimeter of the thickening area. Even if the summer velocities for Austfonna are 10-60% higher (Reference AndreasenAndreasen, 1985) than the winter values in Reference Dowdeswell, Unwin, Nuttall and WinghamDowdeswell and others (1999), this would still require a considerable decrease in glacier velocity to produce the observed thickening rates.
Climate changes
A repeat-pass altimeter survey provides only a snapshot of elevation change over an ice mass. Identifying the timescale over which climatically induced elevation changes occurred is therefore important.
Thinning in the ablation area on Austfonna may reflect the long-term negative mass balance that Svalbard glaciers have experienced over the last few decades (Reference Dowdeswell, Hodgkins, Nuttall, Hagen and HamiltonDowdeswell and others, 1995; Reference Hagen, Melvold, Pinglot and DowdeswellHagen and others, 2003), as suggested for lower-elevation glaciers to the west of Spitsbergen by the ATM (Fig. 1a) (Reference Bamber, Krabill, Raper and DowdeswellBamber and others, 2005), where thinning rates are similar to the values measured at lower elevations on Austfonna. Ice cores obtained from the accumulation area and upper ablation area of Austfonna, including from the area experiencing the largest growth, suggest that accumulation rates for the periods 1963-86 and 1986-99 are similar (Reference Pinglot, Hagen, Melvold, Eiken and VincentPinglot and others, 2001). This implies that any accumulation-induced thickening took place after 1999, requiring thickening rates since then to have been higher than shown in Figure 1b because these are mean values calculated for the entire 6year interval between surveys.
The likely amplitude of interannual variability on Austfonna was examined using a core from the closest available site: the summit of Lomonosovfonna (Reference IsakssonIsaksson and others, 2001; Fig. 1a). Lomonosovfonna had an accumulation rate of 0.39 m a-1 w.e. for the period 1951-96, which is slightly lower than the 0.4-0.6 m a-1 w.e. mean annual net mass balance for the areas of thickening on Austfonna (Reference Pinglot, Hagen, Melvold, Eiken and VincentPinglot and others, 2001). It was assumed, however, that the variability in the accumulation rate on this ice cap, as a percentage of the mean, would be similar to that on Austfonna. Interannual accumulation data from 1950 to 1997 showed that the 6 year average standard deviation of accumulation was 0.057 m a-1 w.e. which was 16% of the 6 year mean (0.37 m a-1 w.e). This suggests that there is approximately a 98.7% probability that the average maximum growth rate on Austfonna maintained over 6years lies outside of the observed accumulation variability for Lomonosovfonna.
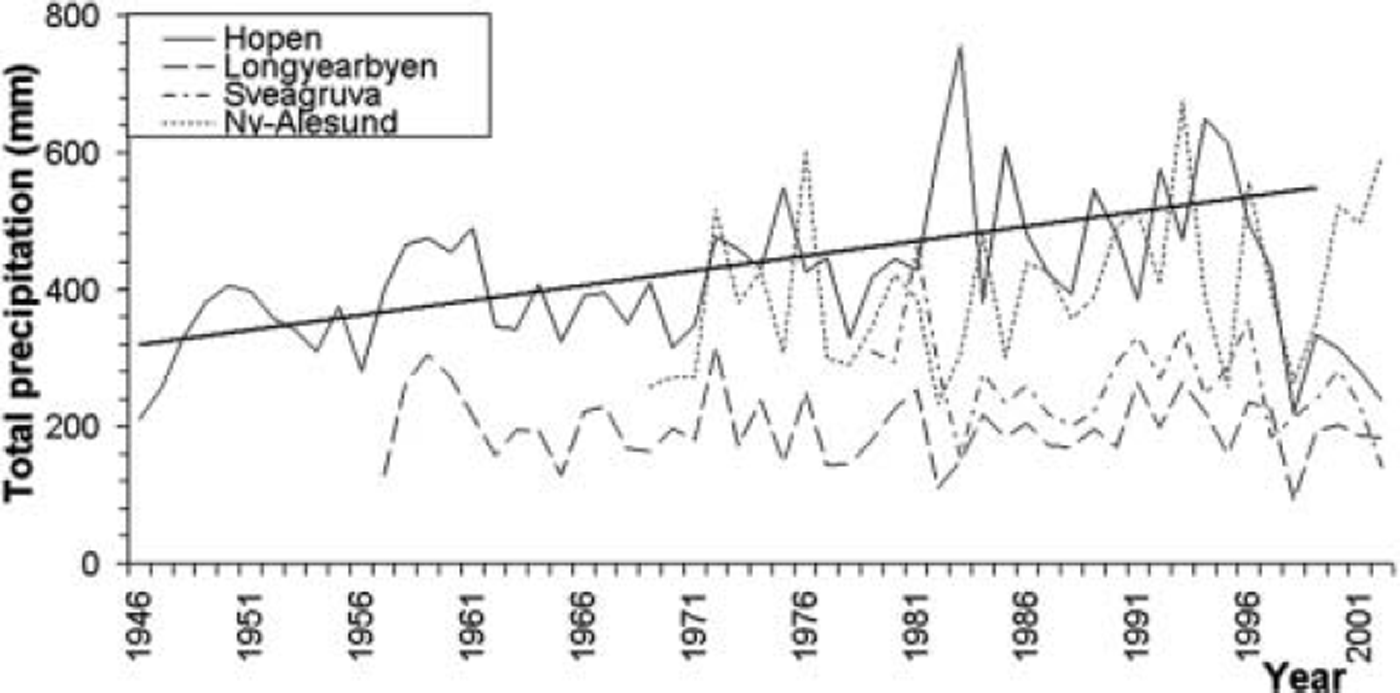
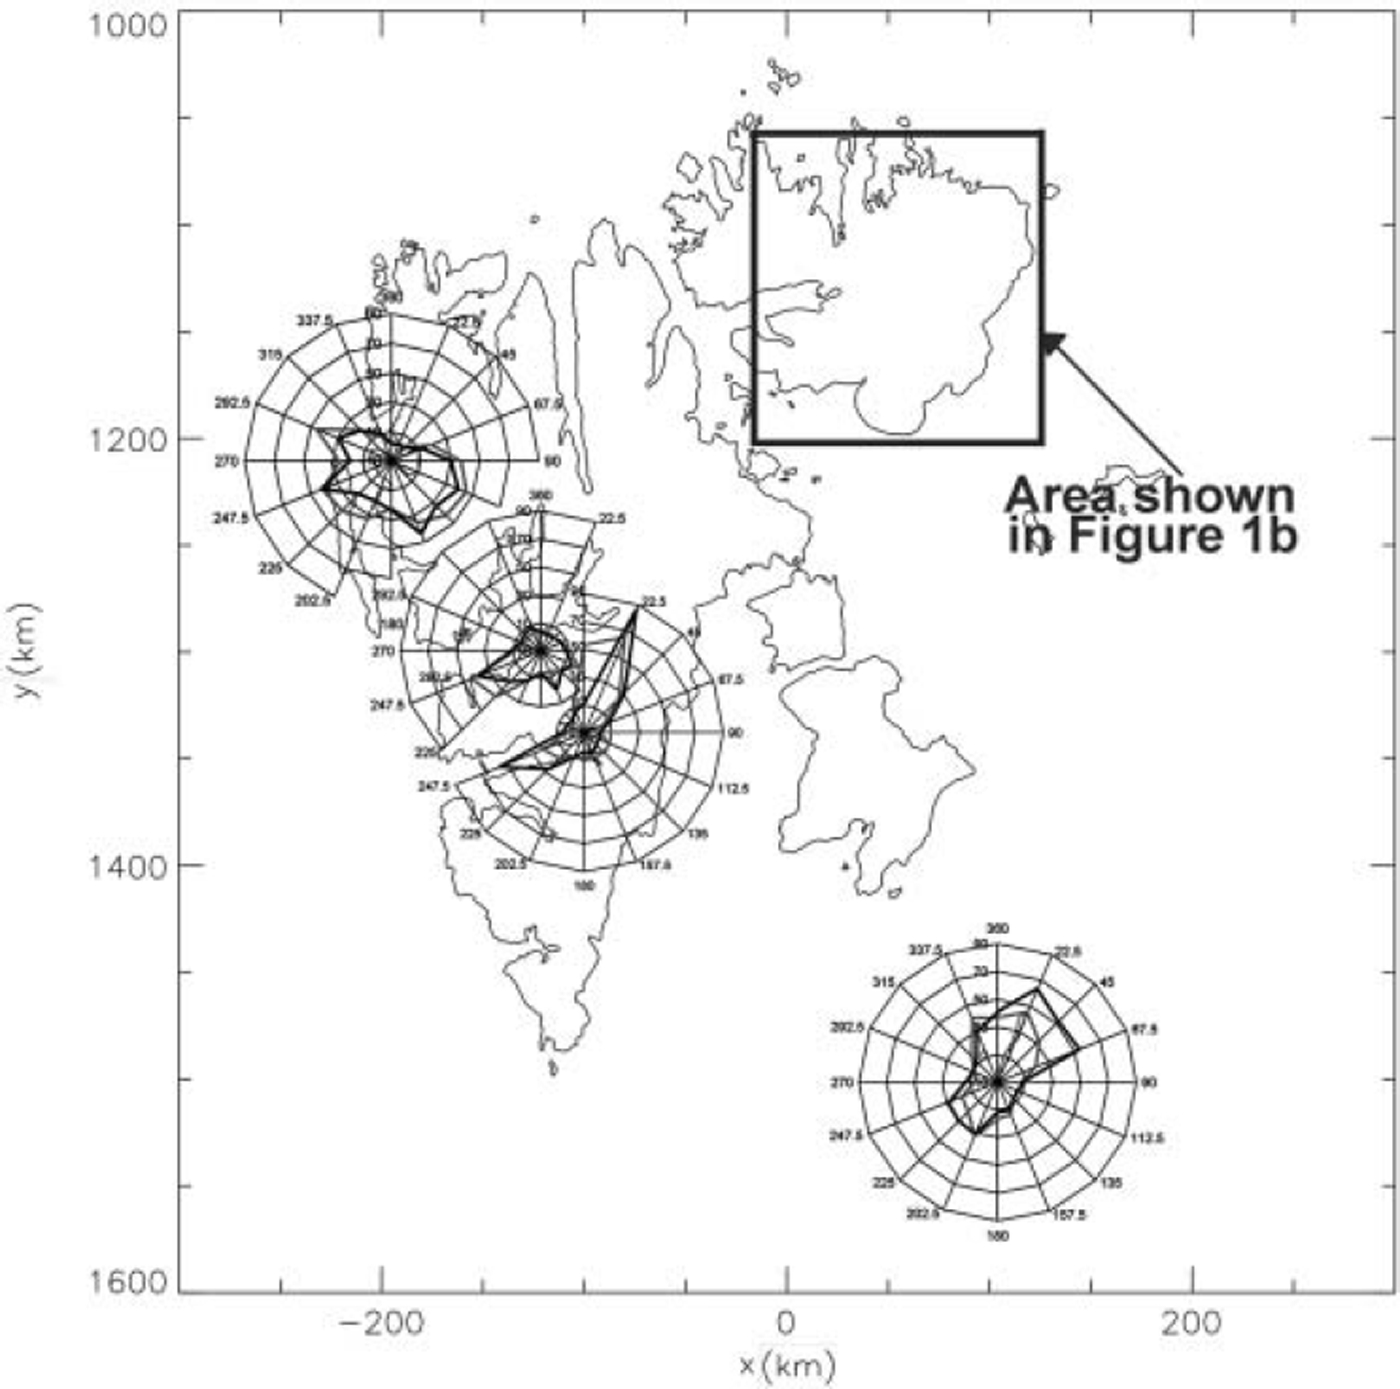
If, however, the positive elevation changes on Austfonna were caused by one or more climatically anomalous snowfall events, then this should be recorded in meteorological station data. Weather station data of suitable quality were available for four stations on Svalbard (Hopen, Ny-Ålesund, Sveagruva and Longyearbyen) (Fig. 1a). Three of these stations, Ny-Ålesund, Sveagruva and Longyearbyen (Svalbard Airport), are situated to the west of Spitsbergen These may not be representative of the climate of Nordaustlandet, which is in the precipitation shadow for air masses from the west (Reference Pinglot, Hagen, Melvold, Eiken and VincentPinglot and others, 2001), receiving precipitation primarily from the east and northeast (Reference IsakssonIsaksson and others, 2001). Hopen lies to the east of the Svalbard archipelago, but is some 300 km to the south of Nordaustlandet. There was no evidence to suggest an accumulation increase on Austfonna from these data. In fact, precipitation was lower during January 1996-January 2002 at Longyearbyen, Sveagruva and Hopen than the long-term mean (1957-2002, 1979-2002 and 1946-2002) by 4.6%, 10.8% and 20.4% respectively (Fig. 2). These declines are independent of wind direction (Fig. 3). Only Ny-Ålesund shows an increase in precipitation over this period, but this station does not appear to receive precipitation from the east and northeast (Fig. 3). The most dramatic decline in precipitation is at Hopen; it occurs in both summer and winter precipitation, and terminates a trend of increasing precipitation at this station of ∼4.3mma–1 between 1946 and 1994. This precipitation decrease is unlikely to be due to undercatch since it is supported by a decrease in the number of days experiencing low (<1010hPa) sea-level pressure over the same period.
Total annual precipitation at all four meteorological stations calculated from precipitation measurements measured between two and four times daily.
Average total annual precipitation as a function of wind direction for meteorological stations on Svalbard. The scale of the wind roses is in mm of precipitation, and the contour lines represent 20 mm. Paler lines show 1996–2000 precipitation for Sveagruva and 1996–2002 precipitation for the remaining three stations. Darker lines show the long-term mean (1979–95, 1969–95, 1959–95 and 1946–95 for Sveagruva, Ny-Ålesund, Longyearbyen and Hopen respectively).
Changes in densification rates
Changes in meteorological conditions can affect the rate of densification (Reference Arthern and WinghamArthern and Wingham, 1998); this factor could have affected, at least in part, the elevation change rate observed. Firn densification, for example, appears to explain many of the elevation changes observed by satellite radar altimeters over the Greenland ice sheet (Reference McConnellMcConnell and others, 2000). This is not a plausible mechanism for producing large elevation change rates in the area of rapid growth on Austfonna, as the firn thickness in this area is estimated to be only 2–4 m (Reference Pinglot, Hagen, Melvold, Eiken and VincentPinglot and others, 2001) and the maximum growth on Austfonna was around 3m over 6 years.
Changes in sea-ice extent
Changes in sea-ice cover can produce elevation changes localized to particular ice caps by affecting accumulation rates. For example, Reference KrabillKrabill and others (1999) note that an isolated ice cap to the northeast of Greenland was observed to be thickening by ∼0.5ma–1 , which appeared to be correlated with the extent of the North East Water polynya.
The possible influence of sea ice was investigated using passive microwave radiometer-derived sea-ice concentration data. NASA Nimbus-7 Scanning Multichannel Microwave Radiometer data from 1978 to 1987 and Special Sensor Microwave Imager (SSM/I) data from 1987 to 2001 were used. Here, we used data derived using the Bootstrap algorithm (Reference ComisoComiso, 1995), which is sensitive to thin ice and tends to overestimate summer sea-ice concentrations by 20% compared to estimates produced by the NASA team algorithm (Reference Singarayer and BamberSingarayer and Bamber, 2003). It therefore potentially provides a conservative estimate of sea-ice decline.
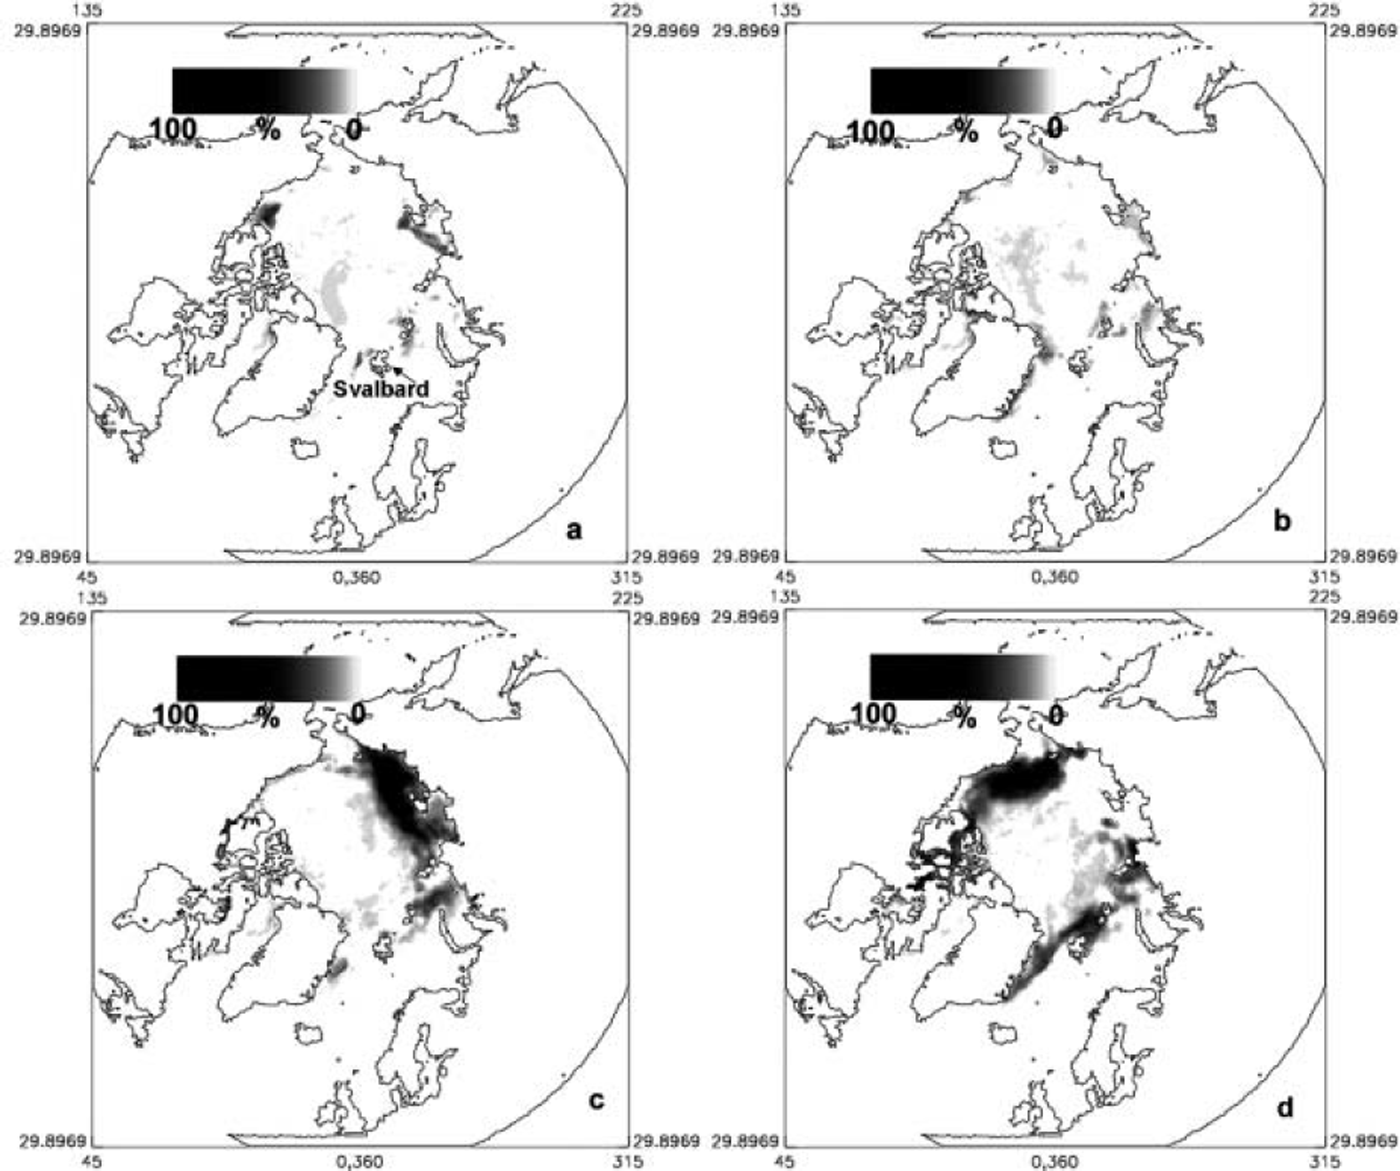
These data show a decline in perennial sea-ice concentrations around Nordaustlandet during the period 1996-2001 (Fig. 4d), especially during the period 1999-2001. The decline in perennial sea ice close to Nordaustlandet appears to be recent, as it is not replicated during any of the other time periods covered by the data (Fig. 4a-c). The timing of the decline also appears to coincide with the inferred timing of growth suggested by the core data collected from Austfonna (Reference Pinglot, Hagen, Melvold, Eiken and VincentPinglot and others, 2001). Sea ice acts as an insulator, and its removal increases the area of open water in direct contact with the atmosphere, resulting in high turbulent heat and moisture fluxes from ocean to atmosphere (Reference Dare and AtkinsonDare and Atkinson, 1999). For the Barents Sea marginal ice zone in May 1999, east of Hopen, given a decrease in ice concentration from 20% to 0%, the turbulent heat flux would increase by an estimated 225 Wm–2 (Reference Ivanov, Gerland, Winther and GoodwinIvanov and others, 2003). We therefore suggest that the observed decline in sea-ice concentration may have produced an increase in the moisture content of the air passing over exposed areas of open water during the period 1996–2001. This could have caused thickening at higher elevations on Austfonna.
Percentage decline in perennial sea-ice extent (based on seasonal minimum) for the periods (a) 1979–83, (b) 1984–89, (c) 1990–95 and (d) 1996–2001, derived from passive microwave data using a Bootstrap algorithm and compared to 1979–2001 (long-term mean).
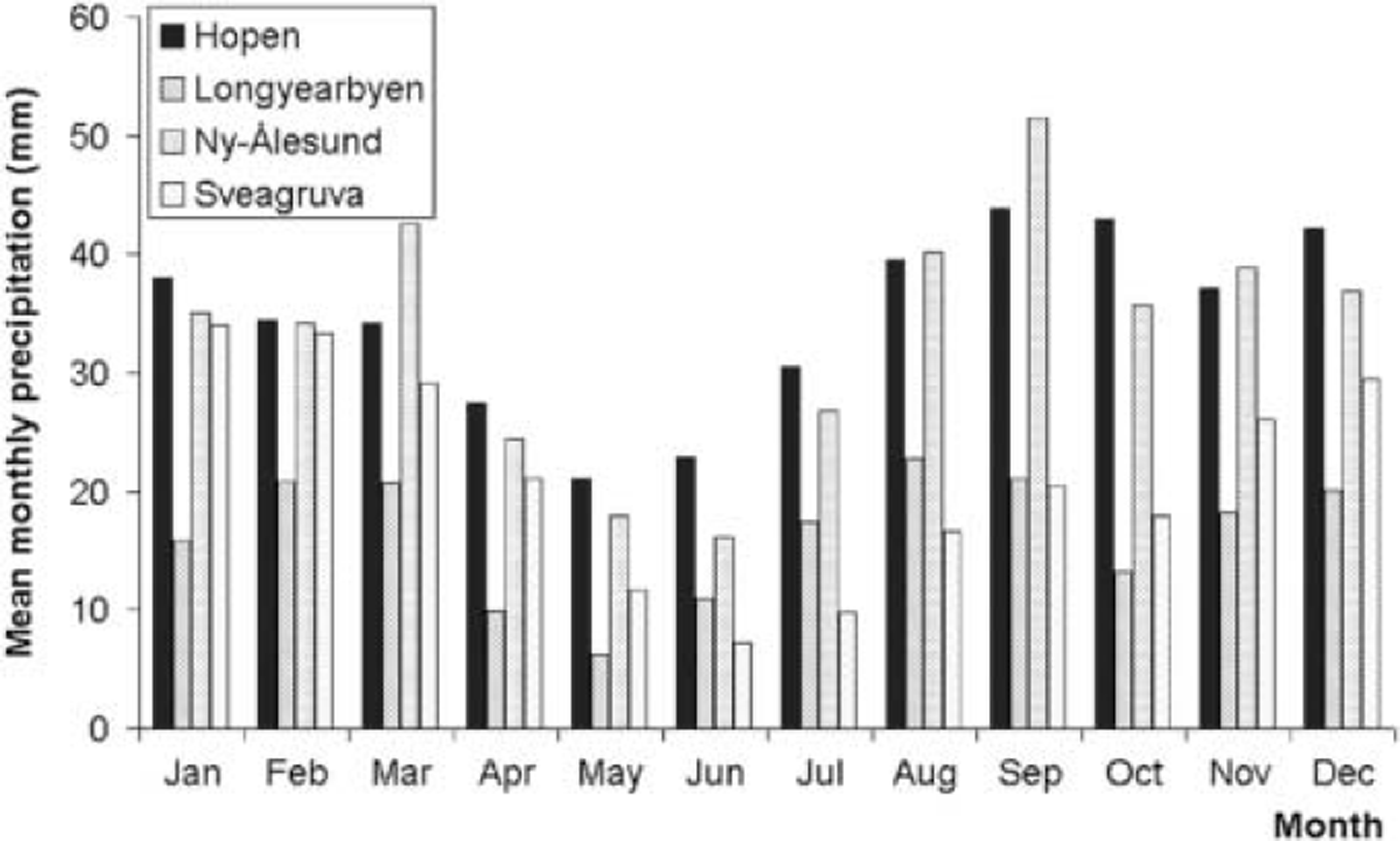
Forecast re-analysis wind-speed data from the European Centre for Medium-Range Weather Forecasts (ERA-40) confirm that prevailing winds over Nordaustlandet are from the east and northeast and are likely to pass over the region of decreased sea-ice concentrations. In addition, the meteorological station data show a weak peak in precipitation around August–September (Fig. 5), suggesting an exposure of open water at this time of year could have a significant effect on precipitation. The largest changes in sea-ice concentrations during the period of the ATM measurements are to the north and northeast of the archipelago and it is likely, therefore, that any local changes in precipitation would be confined to this region.
Average monthly precipitation for meteorological stations on Svalbard averaged over the long-term record (1979–95, 1969–95, 1959– 95 and 1946–95 for Sveagruva, Ny-Ålesund, Longyearbyen and Hopen respectively).
Summary
Here we have presented a detailed analysis into causes of anomalous growth on Austfonna, a large Arctic ice cap. Ice dynamics are ruled out as the cause of the observed thickening. Growth appears to have begun only recently (1999–2002) and has a high probability of lying outside natural accumulation variability estimated from an ice core on Spitsbergen. No changes in precipitation suitable to produce ice-cap growth are found from weather station records. Since meteorological station data used are obtained some distance from the ice cap, this suggests a localized cause of thickening. We suggest that this is due to the exposure of open water resulting from perennial sea-ice decline around Nordaustlandet over the 6 year period between surveys, increasing the moisture content of airflows from the east and northeast. This study highlights the problems of making interpretations where auxiliary data are limited in both spatial and temporal extent. Future studies should identify whether this thickening continues after May 2002, and if similar patterns of elevation change occurring over this timescale may be observed on other ice caps resulting from Arctic sea-ice cover decline.
Acknowledgements
This work was funded by UK Natural Environment Research Council grant NER/B/S/2000/00083 and NASA’s Polar Research Program. We thank the crew of the NASA P-3 aircraft and are grateful for the technical support of R. Mitchell, A. Waller and J. Scott and the support and assistance of the NASA Polar Program manager, W. Abdalati. We also thank R. Thomas, an anonymous reviewer and the scientific editor, W. Harrison, for their efforts in improving the paper.



