I. INTRODUCTION
Multiferroic materials involving two or even three subsystems characterized by different ferroic nature (ferroelectric, ferromagnetic, and ferroelastic) draw considerable attention due to the ability to control their properties using distinct external fields simultaneously.Reference Schmid1–Reference Zvezdin and Pyatakov4 As usual, the main interest is associated with the search for materials exhibiting significant magnetoelectric effects because of their wide applicability in micro- and spin electronic devices.Reference Eerenstein, Mathur and Scott3 In single-phase materials, magnetoelectric coupling arises directly between the two order parameters and leads traditionally to low values of magnetoelectric effect.Reference Bichurin and Petrov5 On the other hand, the interaction between two ferroic phases can be enhanced through their strain-mediated indirect coupling in composites. In such materials, the electric and magnetic order parameters arise in separate but intimately connected phases, and the magnetoelectric effect resulted from piezoelectric and magnetostriction properties of components.Reference Eerenstein, Mathur and Scott3
From our point of view, one more promising way to use the unique properties of multiferroics is connected with the field of refrigeration based on caloric effects (CE) in solids. These effects are associated with the change in the entropy ∆S CE (extensive CE) and temperature ∆T AD (intensive CE) of the thermodynamic systems under the generalized external fields (electric E, magnetic H, and mechanical stress σ or hydrostatic pressure p) in the isothermal and adiabatic processes, respectively.Reference Tishin and Spichkin6 A theoretical analysis and results of numerous experiments indicate that the greatest CE can be realized in the temperature range around the phase transition point.
CE of different physical nature (electrocaloric—ECE, magnetocaloric—MCE, and barocaloric—BCE) can be simultaneously generated in multiferroics using, first, several external fields, second, pressure effect appearing in the ferromagnetic–ferroelectric composite as a consequence of strain coupling between piezomagnetic (or magnetostrictive) and piezoelectric (or electrostrictive) materials. The former statement is supported by the dependences of both ∆S CE and ∆T AD values on pressure, electric and magnetic fields.
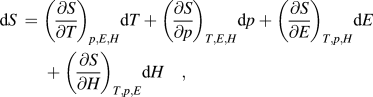 $${\rm{d}}S \,= \;{\left( {{{\partial S} \over {\partial T}}} \right)_{p,E,H}}{\rm{d}}T + {\left( {{{\partial S} \over {\partial p}}} \right)_{T,E,H}}{\rm{d}}p + {\left( {{{\partial S} \over {\partial E}}} \right)_{T,p,H}}{\rm{d}}E + {\left( {{{\partial S} \over {\partial H}}} \right)_{T,p,E}}{\rm{d}}H\quad ,$$
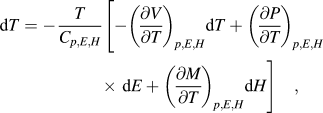 $${\rm{d}}T = - {T \over {{C_{p,E,H}}}}\left[ { - {{\left( {{{\partial V} \over {\partial T}}} \right)}_{p,E,H}}{\rm{d}}T + {{\left( {{{\partial P} \over {\partial T}}} \right)}_{p,E,H}}\,\,\,\,\,\,\,\,\,\,\,\,\,\,\,\,\,\,\,\,\,\,\,\,\,\,\,\,\,\,\,\,\,\times\,\,{\rm{d}}E + {{\left( {{{\partial M} \over {\partial T}}} \right)}_{p,E,H}}{\rm{d}}H} \right\Bigg]\quad ,$$
where V, P, M are volume, electric polarization, and magnetization, respectively.
In accordance with the latter statement given above, the lifting of both ∆S CE and ∆T AD in multiferroics can be also connected with an additional contribution to Eqs. (1) and (2) associated with the conventional (∂P/∂H) or reverse (∂M/∂E) magnetoelectric effects as well as strain coupling between two phases.
As we know, only a few papers have been devoted to the study of the different CE nature in the same material. MCE and BCE were investigated in alloys undergoing magnetic and martensitic phase transitions in a narrow temperature range.Reference Annaorazov, Nikitin, Tyurin, Asatryan and Dovletov7–Reference Manosa, Gonzalez-Alonso, Planes, Bonnot, Barrio, Tamarit, Aksoy and Acet9 Recently, we have reported on multiple CE, ECE and BCE investigations in PbTiO3 (PT)Reference Mikhaleva, Flerov, Gorev, Molokeev, Cherepakhin, Kartashev, Mikhashenok and Sablina10 as well MCE and BCE in La0.7Pb0.3MnO3 (LPM)Reference Kartashev, Mikhaleva, Gorev, Bogdanov, Cherepakhin, Sablina, Mikhashonok, Flerov and Volkov11 exhibiting the ferroelectric and ferromagnetic phase transitions at about T FE = 763 K and T FM = 338 K, respectively. No information is concerning studies of CE and especially multiple CE in the composite multiferroic materials.
In the present work, we have studied phase transitions as well as BCE, MCE, and ECE in two volumetric ferromagnetic–ferroelectric composites xLa0.7Pb0.3MnO3–(1−x)PbTiO3 with the following concentration of the magnetic component: x = 0.18 and 0.85. For this purpose, the investigations of the heat capacity and thermal expansion were performed in a wide temperature range. The direct measurements of intensive MCE were carried out using an adiabatic calorimeter. By analyzing the entropy–temperature–pressure phase diagram as well as electric equation of state, the intensive and extensive BCE and ECE were also determined. The caloric efficiency of multiferroic composites under study was compared with that in the pure ferroelectric PT and ferromagnetic LPM components.Reference Mikhaleva, Flerov, Gorev, Molokeev, Cherepakhin, Kartashev, Mikhashenok and Sablina10,Reference Kartashev, Mikhaleva, Gorev, Bogdanov, Cherepakhin, Sablina, Mikhashonok, Flerov and Volkov11
II. PREPARATION AND CHARACTERIZATION
Samples of the volumetric multiferroic composites xLPM–(1−x)PT were prepared in accordance with the conventional ceramic technology. Powders of the initial compounds LPM and PT were mixed in mass ratios of 0.85:0.15 and 0.15:0.85, ground, pressed into pellets and sintered at 800 °C for 24 h in air.
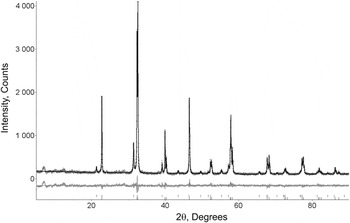
The crystalline structure of the samples with different compositions was characterized using x-ray diffraction. In Fig. 1, one can see the diffraction pattern of the composite with x = 0.85. Diffraction peaks were observed corresponding to the sum of rhombohedral LPM and tetragonal perovskite PT phases. Refinement of the component concentration has given the mass ratios of 0.85(LPM):0.15(PT) and 0.18:0.82. No foreign phases in both ceramic samples were found. Thus, we have not observed any evidences for solid solution formation and interdiffusion between components.
Difference x-ray pattern of 0.85LPM–0.15PT composite.

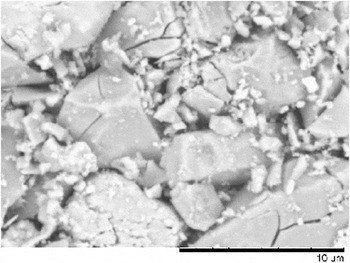
The morphology of the surface and the size of component grains were examined using a scanning electron microscope (SEM) Hitachi TM3000 (Hitachi High-Technologies Co., Ltd., Tokyo, Japan). The typical SEM image of the sample with x = 0.85 can be seen in Fig. 2. The grains of components differ from each other by color: PT is lighter colored than LPM. It must be emphasized that a lot of grains of both components were found to be cracked. Examination of initial compound powders has shown that only PT grains are destroyed. The latter phenomenon is due to very strong volume change in PT at ferroelectric phase transition at T FE = 763 K.Reference Mikhaleva, Flerov, Gorev, Molokeev, Cherepakhin, Kartashev, Mikhashenok and Sablina10 The reason of the LPM grains destruction during sintering of volumetric composites can be associated with the different thermal expansion coefficients β of components.Reference Mikhaleva, Flerov, Gorev, Molokeev, Cherepakhin, Kartashev, Mikhashenok and Sablina10,Reference Kartashev, Mikhaleva, Gorev, Bogdanov, Cherepakhin, Sablina, Mikhashonok, Flerov and Volkov11 Really, at room temperature, β is positive, and there are slow increases in LPM with temperature increase, whereas PT is characterized by negative thermal expansion from about 100 K to the phase transition point where β is changed drastically to a positive value. The SEM micrograph (Fig. 2) clearly shows that the greatest amount of the both component grains have sizes under 10 μm. Rather low sintering temperature chosen to avoid the reaction/interdiffusion of components is the main reason of low relative density of the samples: 90% for x = 0.85 and 75% for x = 0.18.
Scanning electron microscopy image of 0.85LPM–0.15PT composite sintered at 800 °C.

III. EXPERIMENTAL
The heat capacity of both composites was studied in the wide temperature range from 80 to 900 K by two calorimetric methods.
Low temperature measurements between 80 and 370 K were performed using a homemade adiabatic calorimeter with three screens described in Refs. Reference Kartashev, Flerov, Volkov and Sablina12 and Reference Kartashev, Flerov, Volkov and Sablina13. The powdered composite samples with the mass of about 0.4 g were pressed without a binding agent at a pressure of ∼0.1 GPa in the form of cylindrical pellets 8 mm in diameter and 2 mm in height. They were put into a heater consisting of an aluminum foil container with constantan wire cemented to its surface. A reliable thermal contact between the sample and the heater was provided by vacuum grease. Using the data about the heat capacities of the heater C h(T) and contact grease determined in separate experiments, information on the heat capacity of the sample C s(T) was obtained. Experimental measurements of heat capacity were performed using both the discrete (∆T = 1.0–2.5 K) and continuous [dT/dt ≈ (0.15–0.3) K/min] heatings. The error in heat capacity was about 0.2–0.4% in the whole temperature range investigated.
The heat capacity measurements in the high temperature region 370–900 K were carried out by means of a differential scanning calorimeter (Netzsch STA 449 C Jupiter, NETZSCH-Geraetebau GmbH, Selb, Germany). During the experiments on heating and cooling regimes at ±5 K/min rate, argon gas-flow was maintained at a constant flow rate of 35 mL/min. Standard materials In, Ag2SO4, BaCO3, K2CrO4, and KClO4 were used for calibration of the calorimeter. The error in heat capacity did not exceed 4–5%.
The thermal expansion was measured in the temperature range of 100–900 K with a heating rate of 5 K/min by means of a Netzsch model DIL-402C pushrod dilatometer. The ceramic samples were prepared in the form of a cylinder (4 mm in diameter and 5.1 mm in length). The investigation was made under a helium atmosphere flowing at 40 mL/min. The influence of system thermal expansion was removed by calibration of the results with SiO2 and Al2O3 as standard references.
The study of intensive MCE  $\Delta T_{{\rm{AD}}}^{{\rm{MCE}}}$ around the ferromagnetic phase transition point was performed by direct measurements of the temperature change at magnetic field variation using an adiabatic calorimeter. To monitor and control the temperature of the sample + heater system with high precision, a platinum resistance thermometer and a doubled copper–constantan thermocouple were used.Reference Kartashev, Flerov, Volkov and Sablina12
In the first step, some initial temperature of the system was stabilized with a drift of about |dT/dt| ≤ 2 × 10⁻⁴ K/min. The switching on of magnetic field H was followed by an abrupt increase in the temperature  $\Delta T_{{\rm{EXP}}}^{{\rm{ON}}}$. Monitoring of the sample temperature has shown that the drift was the same as observed before applying the field. A perfect reversibility of cycling H = 0–H ≠ 0–H = 0 was proved by high equivalency of the values
 $\Delta T_{{\rm{EXP}}}^{{\rm{ON}}}$ and
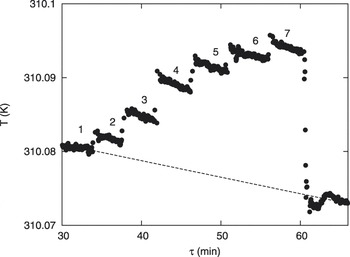
 $\Delta { T}_{{\rm{EXP}}}^{{\rm{OFF}}}$, which was detected at shutdown of the magnetic field. It indicates the negligible quantity of the hysteretic component. Figure 3 shows the results of the ∆T EXP measurements near T FM in the sample with x = 0.18 with magnetic field varying between 0 and 5.4 kOe. The same reversibility of the magnetic field cycling was observed at all temperatures and fields used for both composites under investigation. The uncertainty in determination of ∆T EXP was about ±(0.1–0.5)% depending on the T–T FM distance.
Experimental temperature profile dependence of the 0.18LPM–0.82PT sample on the magnetic field change: 0 kOe (1), 1.1 kOe (2), 2.2 kOe (3), 3.3 kOe (4), 4.2 kOe (5), 4.8 kOe (6), and 5.3 kOe (7).

The energy change of the sample associated with MCE under adiabatic variation of H is spent to increase (or decrease) the temperature of the sample + heater system as a whole. Thus temperature change ∆T EXP recorded in the experiments is less than the value of real intensive MCE  ${\rm{(}}\Delta T_{{\rm{AD}}}^{{\rm{MCE}}}{\rm{)}}$. The relationship between values C h(T), C s(T), ∆T EXP and
 $\Delta T_{{\rm{AD}}}^{{\rm{MCE}}}$ follows from the equationReference Kartashev, Flerov, Volkov and Sablina12,Reference Kartashev, Flerov, Volkov and Sablina13 :
 $$\Delta T_{{\rm{AD}}}^{{\rm{MCE}}} = \Delta {T_{{\rm{EXP}}}}\left( {1 + {{{C_{\rm{h}}}} \over {{C_{\rm{s}}}}}} \right)\quad ,$$
which allows us to obtain information about the actual change in temperature of samples in response to an adiabatic applied and removed external magnetic field. The C h/C s values were found to be 0.7 and 0.53 for x = 0.85 and x = 0.18, respectively. Thus, the total uncertainty in the determination of  $\Delta T_{{\rm{AD}}}^{{\rm{MCE}}}$ can be evaluated at about ±(1–3)% depending on its value.
IV. RESULTS AND DISCUSSION
A. Heat capacity
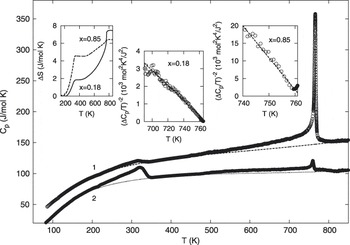
The results of calorimetric studies are presented in Fig. 4 as the temperature dependencies of the isobaric heat capacity C p(T) in a wide temperature range including phase transitions of ferroelectric and ferromagnetic nature in initial compounds. x-ray diffraction and electron microscopy examinations have shown that composites under study are the mechanical mixtures of PT and LPM. Therefore, the heat capacity measured in experiments was presented as molar heat capacity of the samples using molar mass of mixtures.
Temperature dependencies of the heat capacity of composites with x = 0.18 (1) and x = 0.85 (2). Curve 2 is shifted down at 20 J/mol K. Dashed lines are the lattice contribution. Insets represent phase transition entropy ΔS and behavior of the anomalous heat capacity of composites in accordance with relationship Eq. (6).

Two heat capacity anomalies associated with phase transitions in LPM at T FM and in PT at T FE, respectively, were detected in both composites under study (Fig. 4). It is seen, that anomalies at T FM are blurred peaks in a broad temperature range especially compared to C p anomaly observed in single crystal LPM.Reference Kartashev, Mikhaleva, Gorev, Bogdanov, Cherepakhin, Sablina, Mikhashonok, Flerov and Volkov11 To determine correctly the ferromagnetic transition characteristics, the heat capacity of the LPM powder sample was studied too, and heat capacity smearing was also observed. When we consider the phase transition temperature as associated with the maximum of the C p(T) peak, T FM decreases slightly and irregular with an increase in the PT concentration (Table I). Another approach for the strong smeared second order transformations is to consider the temperature of the derivative (∂C p/∂T) minimum as the phase transition point (T FM)deriv associated with the smeared jump of C p. In such a case, (T FM)deriv decreases more regularly, and its values for single crystal and powder LPM are closer to each other than T FM values (Table I).
Some parameters of ferromagnetic and ferroelectric phase transitions in volumetric composites xLPM–(1−x)PT and initial compounds LPMReference Kartashev, Mikhaleva, Gorev, Bogdanov, Cherepakhin, Sablina, Mikhashonok, Flerov and Volkov11 and PT.Reference Mikhaleva, Flerov, Gorev, Molokeev, Cherepakhin, Kartashev, Mikhashenok and Sablina10

sc, single crystal; cer, ceramics.
The behavior of heat capacity near ferroelectric phase transition was not significantly affected by the increase of LPM component concentration. No strong and regular change in T FE compared to PTReference Mikhaleva, Flerov, Gorev, Molokeev, Cherepakhin, Kartashev, Mikhashenok and Sablina10 was observed (Table I). The reason is that we have performed sintering of the samples at rather low temperature (800 °C) to maintain the stoichiometry of initial components. As the results, the x-ray examination of the xLPM–(1−x)PT system has shown that both samples are real volumetric composites involving pure initial compounds.
Another situation was observed in the volumetric xPbZr0.53Ti0.47O3–(1−x)Mn0.4Zn0.6Fe2O4 composites sintered at a much higher temperature 1170–1200 °C.Reference Gridnev and Kalgin14 The T FE temperature has decreased considerably rapidly than T FM with an increase in ferromagnetic and ferroelectric phase concentration, respectively. Strong narrowing of the ferroelectric phase region was explained by the replacement of Ti ions by Fe ones leading to a change in chemical pressure. A similar situation was observed in the CoFe2O4 (CFO)–PbTiO3 thin film composition structures.Reference Murakami, Chang, Aronova, Lin, Yu, Simpers, Wuttig, Takeuchi, Gao, Hu, Lofland, Knauss and Bendersky15 The ferromagnetic Curie temperature was found to be the same for the samples with different average compositions. By contrast, T FE was decreased rapidly with the CFO concentration increase and 0.15CFO–0.85PT composite has exhibited paraelectric–ferroelectric phase transition at room temperature. Such a huge T FE shift, compared to T FE ≈ 490 °C in pure PT, was also supposed to be associated with the diffusion of Fe and Co ions into PT leading to a metastable solid solution, which are dramatically affected by even small additions of solute atoms. The hypothesis about the role of central atom replacement suggested in Refs. Reference Gridnev and Kalgin14 and Reference Murakami, Chang, Aronova, Lin, Yu, Simpers, Wuttig, Takeuchi, Gao, Hu, Lofland, Knauss and Bendersky15 agrees well with the results obtained on bulk solid solution Pb(Fe0.5Ti0.5)O3 showing paraelectric–ferroelectric phase transition around 420 °C.Reference Palkar and Malik16
Because of its additivity, the heat capacity of the volumetric composite should be equal to the sum of component heat capacities. In wide temperature ranges except phase transition regions, the additivity rule was found to be correct for both composite samples. Rather good agreement was observed between the values of measured  $C_{\rm{p}}^{{\rm{exp}}}$(T) and calculated
 $C_{\rm{p}}^{{\rm{calc}}}\left( T \right) = xC_{\rm{p}}^{{\rm{LPM}}}\left( T \right) + \left( {1 - x} \right)C_{\rm{p}}^{{\rm{PT}}}\left( T \right)$ using heat capacities of PTReference Mikhaleva, Flerov, Gorev, Molokeev, Cherepakhin, Kartashev, Mikhashenok and Sablina10 and LPMReference Kartashev, Mikhaleva, Gorev, Bogdanov, Cherepakhin, Sablina, Mikhashonok, Flerov and Volkov11 in relation to their molar concentrations. To get information about integral characteristics of phase transitions, separation of the lattice, C LAT, and anomalous, ∆C p, parts of the heat capacity has been carried out by interpolation of the
 $C_{\rm{p}}^{{\rm{calc}}}$(T) data on phase transition regions. The lattice contribution for both composites is shown as dashed lines in Fig. 4. The total entropy changes as well entropies of ferromagnetic ∆S FM and ferroelectric ∆S FE phase transitions have been determined by integration of the area below the ∆C p/T versus T curve. Their temperature dependencies and values are presented in Fig. 4 and also in Table I compared with those for PT and single crystal as well as ceramic LPM. The decrease of ∆S FE entropy with an increase in the LPM component concentration results from the assignment of this value to the molar mass of the composite. The entropies converted to molar mass of PT component are close to entropy of pure lead titanate. More complicated situation was observed with the entropy change at ferromagnetic transformation. It was seen that the ∆S FM value of the composite with x = 0.85 exceeds the same for powder and single crystal LPM (Table I). One of the reasons can be connected with the difficulties to obtain reliable information about excess entropy for the strong smeared phase transitions of the second order.
B. Thermal expansion
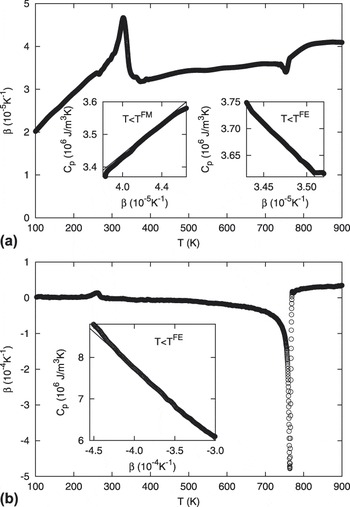
The measurements of linear thermal expansion α were carried out on the ceramic samples. However, it is better to consider the coefficient of thermal volume expansion β = 3α as a more informative value. The temperature dependencies of β studied in a wide temperature range are shown in Figs. 5(a) and 5(b). As for the heat capacity of composites, the β(T) anomalies associated with ferromagnetic and ferroelectric phase transitions were strongly affected by a change in the component concentration. Moreover, in the sample with x = 0.18, the anomaly at T FM was completely suppressed. The positive β peak observed at about 260 K corresponds to the anomalous behavior of thermal expansion observed in pure PT.Reference Mikhaleva, Flerov, Gorev, Molokeev, Cherepakhin, Kartashev, Mikhashenok and Sablina10
Temperature dependence of the volume coefficient of thermal dilatation [(a) x = 0.85 and (b) x = 0.18]. Insets represent the relationship between the heat capacity and the coefficient of volume thermal expansion of composites x = 0.85 and x = 0.18.

Earlier, we have profitably employed the C p(T) and β(T) data to obtain information about the susceptibility of PT and LPM materials to external pressure using the Pippard equation C p = (dp/dT)VTβ + constant.Reference Mikhaleva, Flerov, Gorev, Molokeev, Cherepakhin, Kartashev, Mikhashenok and Sablina10,Reference Kartashev, Mikhaleva, Gorev, Bogdanov, Cherepakhin, Sablina, Mikhashonok, Flerov and Volkov11 The same procedure was followed to determine baric coefficients of the temperatures of ferromagnetic and ferroelectric phase transitions in xLPM–(1−x)PT composites. For the sample with x = 0.85, the linear dependence of C p against β below T FM was observed in the temperature interval 296–317 K [Fig. 5(a)]. The corresponding value of the initial shift of phase transition point under hydrostatic pressure dT FM/dp (Table I) is in good agreement with that calculated using the Ehrenfest equation linking the changes of C p and β at the phase transition point dT FM/dp = T FM(∆β/∆C p) = 1.2 K/kbar.
Analysis of calorimetric and dilatometric data near T FE has shown that C p(T) and β(T) are also proportional to each other in the framework of the Pippard equation [Figs. 5(a) and 5(b)]. In accordance with the values of baric coefficients dT FM/dp and dT FE/dp for both composites (Table I), the ferroelectric transformation is more sensitive to the concentration of the ferromagnetic component. Moreover, the value dT FE/dp is close to change the sign.
Thus, the increase of the opposite component concentration leads to a decrease of the susceptibility of composite to external pressure at ferroelectric and ferromagnetic phase transitions compared to pure PT and LPM.Reference Mikhaleva, Flerov, Gorev, Molokeev, Cherepakhin, Kartashev, Mikhashenok and Sablina10,Reference Kartashev, Mikhaleva, Gorev, Bogdanov, Cherepakhin, Sablina, Mikhashonok, Flerov and Volkov11
C. Caloric effects
The actual intensive MCE was determined using experimentally measured dependencies ∆T EXP(T,H) and Eq. (3).
To make sure that low magnetic field has little or no effect on C s, calorimetric measurements under magnetic field H = 5 kOe were performed on the sample with x = 0.18. And that is the case, the difference between C p values at H = 0 and H ≠ 0 in the temperature range (T FM − 30 K)–(T FM + 30 K) does not exceed ∼0.5%. Thus, one can neglect the field dependence of C s in Eq. (3). Figures 6(a) and 6(b) show the temperature behavior of  $\Delta T_{{\rm{AD}}}^{{\rm{MCE}}}$ for both composites with the magnetic field varying between 2.1 and 5.4 kOe. It is interesting that in spite of T FM decrease with x decrease, maximum values on the
 $T_{{\rm{AD}}}^{{\rm{MCE}}}$(T) curves were found at the same temperature
 $T_{{\rm{MAX}}}^{{\rm{MCE}}}$ = 330 ± 2 K for composites as well as ceramic LPM and lower than
 $T_{{\rm{MAX}}}^{{\rm{MCE}}}$ = 342 ± 1 K in single crystal.Reference Kartashev, Mikhaleva, Gorev, Bogdanov, Cherepakhin, Sablina, Mikhashonok, Flerov and Volkov11 Both
 $T_{{\rm{MAX}}}^{{\rm{MCE}}}$ values exceed the respective phase transition temperatures associated with
 $T_{\max {C_{\rm{p}}}}^{{\rm{FM}}}$ (Table I). The reason for this difference can be explained by the following way.
 $T_{\max {C_{\rm{p}}}}^{{\rm{FM}}}$ is the temperature of the minimum value of the temperature derivative of magnetization square dM 2/dT:maxC pFM = T(∂S/∂T)max ∼ T(∂M 2/∂T)min. On the other hand, according to Eq. (2)
 $T_{{\rm{MAX}}}^{{\rm{MCE}}}$ is connected with the maximum of the derivative dM/dT. As Fig. 6(c) suggests, at close values of H, the LPM single crystal has the largest (
 $\Delta T_{{\rm{AD}}}^{{\rm{MCE}}}$)MAX compared to composite samples. However, it is necessary to take into account that the energy change of the composite samples associated with MCE under adiabatic variation of the magnetic field is spent to increase (or decrease) the temperature of both components in the composite. Using Eq. (3), where in such a case C h is equal to the heat capacity of the PT component, one can obtain information about the actual change in temperature of the LPM component. Converted values of intensive MCE in both composites are increased [Fig. 6(d)]. The behavior of
 ${\left( {\Delta T_{{\rm{AD}}}^{{\rm{MCE}}}} \right)_{{\rm{MAX}}}}\left( H \right)$ in the case of x = 0.85 follows the dependence for single crystal LPM.
Temperature dependence of the intensive MCE for constant fields [(a) x = 0.18 and (b) x = 0.85]. Experimental (c) and converted (d) to pure LPM values of  $\Delta T_{{\rm{AD}}}^{{\rm{MCE}}}$ at the peak position plotted as a function of the field. 1—single crystal LPM, 2—ceramic LPM, 3—x = 0.85, and 4—x = 0.18. RCP(T) (e) and RCP(S) (f) and their converted values (g, h) in both composites compared to pure LPM.

However, it is known that the absolute values of ∆T AD and ∆S CE are not enough to characterize the caloric efficiency of materials.Reference Tishin and Spichkin6,Reference Kartashev, Mikhaleva, Gorev, Bogdanov, Cherepakhin, Sablina, Mikhashonok, Flerov and Volkov11 More informative characteristics are for example relative cooling powers RCP(T) and RCP(S)
 $${\rm{RCP}}\left( T \right) = \Delta T_{{\rm{AD}}}^{{\rm{MAX}}} \cdot {\rm{\delta }}{T_{{\rm{FWHM}}}}\quad ,$$
 $${\rm{RCP}}\left( S \right) = \Delta S_{{\rm{CE}}}^{{\rm{MAX}}} \cdot {\rm{\delta }}{T_{{\rm{FWHM}}}}\quad .$$
Here, δT FWHM denotes the full width at the half maximum of ∆T AD(T) or ∆S CE(T) curves.
In the range of magnetic fields studied, both values of RCPMCE in the composite 0.85LPM–0.15PT as well as ceramic LPM exceed the parameters of LPM single crystal [Figs. 6(e) and 6(f)]. The difference is about 18% at H = 4 kOe. In the narrow magnetic field range (0–5 kOe), the dependences of RCP(T)MCE(H) and RCP(S)MCE(H) are close to linear and their normalized values are almost constant and the same for the single crystal and ceramic LPM as well as the composite 0.85LPM–0.15PT: RCP(T)MCE/∆H = 2.0 ± 0.2 K2/kOe and RCP(S)MCE/∆H = 2 ± 0.2 J/(kg kOe). We also have converted RCP from composites to pure LPM component and found that both values RCP(T)MCE and RCP(S)MCE exceed the same for single crystal and ceramic LPM [Figs. 6(g) and 6(h)]. For x = 0.85, the difference is rather large, about 30% at H = 4 kOe.
The reason for MCE and RCPMCE increase in the manganite component will be discussed later taking into account the data of barocaloric studies.
To study ECE in the xLPM–(1−x)PT composites near T FE, we have used an approach based on the analysis of the electric equation of state applied successfully to some ferroelectrics.Reference Mikhaleva, Flerov, Gorev, Molokeev, Cherepakhin, Kartashev, Mikhashenok and Sablina10,Reference Mikhaleva, Flerov, Bondarev, Gorev, Vasiliev and Davydova17
The anomalous heat capacity existing in both samples below T FE (Fig. 4) was considered in the framework of the phenomenological theory of phase transitions. In accordance with one of the consequences of this theory,Reference Alexandrov and Flerov18 the ratios between the coefficients in the thermodynamic potential ∆Φ = A T(T − T c)P 2 + BP4 + CP6 can be determined from data on the excess heat capacity at T < T FE:
 $${\left( {{{\Delta {C_{\rm{p}}}} \over {\rm T}}} \right)^{ - 2}} = {\left( {{{2\sqrt {{B^2} - 3{A_{\rm{T}}}C} } \over {A_{\rm{T}}^2}}} \right)^2} + {{12C} \over {A_{\rm{T}}^3}}\left( {{T^{{\rm{FE}}}} - T} \right)\quad .$$
Figure 4 shows that the square of the inverse relative excess heat capacity is a linear function of T over the wide temperature ranges: 700–760 K and 740–759 K for the samples with x = 0.18 and 0.85, respectively. The deviation from dependence Eq. (6) as the temperature T FE is approached is due to the smearing of the latent heat of the first order phase transition. To determine the values of the B and C coefficients, we have used A T = 1.1 × 10⁻⁵ K−1 value characteristic for pure PTReference Mikhaleva, Flerov, Gorev, Molokeev, Cherepakhin, Kartashev, Mikhashenok and Sablina10: B = −2.9 × 10⁻⁸ (J/mol)−1, C = 6.8 × 10⁻¹³ (J/mol)−2 (x = 0.18); B = −15 × 10−8 (J/mol)−1, C = 142 × 10−13 (J/mol)−2 (x = 0.85). The thermodynamic surfaces P–E–T for both composites were built by the analysis of the electric equation of state E = 2A T(T − T c)P + 4BP3 + 6CP5 assuming weak effect of electric field on coefficients of the thermodynamic potential. The intensive ECE was determined using the equation  $\Delta T_{{\rm{AD}}}^{{\rm{ECE}}}$ = −(T/C p,E)∫(∂P/∂T)p,EdE. The behavior of
 $\Delta T_{{\rm{AD}}}^{{\rm{ECE}}}$ and ∆S ECE for the composite with x = 0.18 is shown in Figs. 7(a) and 7(b). It is interesting to point out that unlike MCE, intensive ECE is characterized by strong nonlinear dependence on electric field [Fig. 7(c)]. At low E values, the x increase is followed by an increase in
 $\Delta T_{{\rm{AD}}}^{{\rm{ECE}}}$ compared to pure PT, especially in the case of the composite with x = 0.18, and the more rapid saturation of this value at higher electric fields. On the other hand, Fig. 7(d) shows that electric field elevates RCP(T) values for PT as well as composites without saturation at least in the range of E values analyzed. The following values of electric E ≈ 6 kV/cm [Fig. 7(d)] and magnetic H ≈ 5 kOe [Fig. 6(e)] fields are required to get equal values of RCP(T)ECE = RCP(T)MCE ≈ 10 K2.
Temperature dependence of the intensive (a) and extensive (b) ECE in 0.18LPM–0.82PT. The effect of the electric field on ( $\Delta T_{{\rm{AD}}}^{{\rm{ECE}}}$)MAX (1—PT; 2—x = 0.18; 3—x = 0.85) (c). RCP(T) in both composites compared to pure PT (d).

Barocaloric effect is the most common property of the solids because it does not depend on the material nature. Therefore, the study of BCE in the xLPM–(1−x)PT composites was performed near both ferromagnetic and ferroelectric phase transition points. The values of intensive and extensive effects associated as
 $$\Delta T_{{\rm{AD}}}^{{\rm{BCE}}} = - \left( {{T \mathord{\left/ {\vphantom {T {C_{\rm{p}} }}} \right. \kern-\nulldelimiterspace} {C_{\rm{p}} }}} \right)\Delta S_{{\rm{BCE}}} \quad ,$$
were determined on the ground of approach derived in Refs. Reference Strässle, Furrer, Donni and Komatsubara19 and Reference Flerov, Gorev, Tressaud and Laptash20 and successfully applied for ferromagnetic, ferroelectric, and ferroelastic phase transitions.Reference Kartashev, Mikhaleva, Gorev, Bogdanov, Cherepakhin, Sablina, Mikhashonok, Flerov and Volkov11,Reference Flerov, Gorev, Tressaud and Laptash20,Reference Flerov, Gorev, Fokina, Bovina, Bogdanov, Pogoreltsev and Laptash21
We have assumed that low hydrostatic pressure leading to the shift of the phase transition temperatures in composites does not have a significant effect on the heat capacity and entropy of the crystal lattice. In such a case, the functions of total entropy S(T,p) for both samples can be calculated using the data on dT/dp and C p(T) consisting of C LAT and ∆C p
 $$S\left( {T,p} \right) = S_{{\rm{LAT}}} \left( T \right) + \Delta S\left( {T + \left( {{{{\rm{d}}T} \mathord{\left/ {\vphantom {{{\rm{d}}T} {{\rm{d}}p}}} \right. \kern-\nulldelimiterspace} {{\rm{d}}p}}} \right)p} \right)\quad .$$
The baric coefficient locates the position of ∆S(T) part on the S(T) dependence.
Extensive BCE was defined as the difference between total entropies under pressure and without pressure ∆S BCE(T,p) = S(T,p) − S(T,0) at the same temperature. The value of  $\Delta T_{{\rm{AD}}}^{{\rm{BCE}}}$ was calculated from the condition of the entropy constancy at pressure change S(T,0) = S(T + ∆T AD,p). As pointed above, no anomaly in the β(T) dependence in the region of ferromagnetic transformation was detected for the sample with x = 0.18. Therefore, the temperature and pressure behavior of both BCE was studied near T FM and T FE in the sample with x = 0.85 and only around T FE for x = 0.18. In line with the signs of baric coefficients (Table I),
 $\Delta T_{{\rm{AD}}}^{{\rm{BCE}}}$ as well as ∆S BCE for ferromagnetic and ferroelectric phase transitions are characterized by different signs. The pressure switching on leads to the heating and cooling of the ferromagnetic and ferroelectric components, respectively.
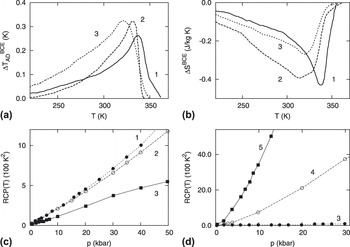
Figure 8(a) shows that at the same rather low pressure 1 kbar, the  $\Delta T_{{\rm{AD}}}^{{\rm{BCE}}}$ value for x = 0.85 and ceramic LPM at T FM is more than that for the single crystal LPM.Reference Kartashev, Mikhaleva, Gorev, Bogdanov, Cherepakhin, Sablina, Mikhashonok, Flerov and Volkov11 On the other hand, the opposite relationship is characteristic for extensive BCE where the single crystal shows the largest ∆S BCE value at low pressure [Fig. 8(b)]. The reason is that in spite of the difference between phase transition entropies (Table I), the derivative dS/dT(T) for single crystal changes in a more narrow temperature range. At high pressure, ∆S BCE value will be the largest for the composite. A more pronounced difference is between parameters of RCP(T)BCE at T FM [Fig. 8(c)]. In the broad pressure range, there is a nonlinearity of the RCP(T)BCE function as was observed also for the RCP(T)ECE [Fig. 7(d)].
Temperature dependence of the intensive (a) and extensive (b) BCE near TFM at P = 1 kbar (1—LPM single crystal; 2—LPM ceramics; 3—composite with x = 0.85). RCP(T) around T FM (c) and T FE (d) (4—composite with x = 0.18; 5—PT).

When these results are compared with those of RCPMCE (Fig. 6), it is apparent that barocaloric and magnetocaloric efficiency of ferromagnetic material can be significantly increased by variation of a relationship between ferromagnetic and ferroelectric components in composites xLPM–(1−x)PT.
BCE at T FE in composites were found to be strongly decreased with an increase in the LPM concentration. That is apparently evident from Fig. 8(d), where the barocaloric relative cooling power of PT and two composites is presented.
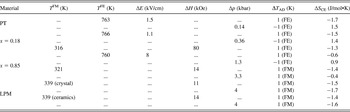
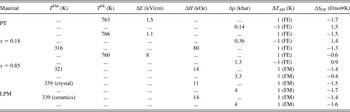
In accordance with the ferroelectric–ferromagnetic nature of composites under study, they can be considered as multiferroic materials. In such a case, it is interesting to compare some parameters characterizing multicaloric efficiency of composites compared with those of initial LPM and PT compounds. In Table II, one can see the values of electric and magnetic fields as well as pressure required to realize the same value of intensive caloric effect at ferroelectric and ferromagnetic phase transitions. For example, small addition of LPM to PT even decreases the electric field to get 1 K of temperature change. Addition of PT to LPM increases the magnetic field only to some extent. In accordance with phase transition entropy and baric coefficient, BCE is larger at ferroelectric transformation. As a result, the pressure is rather different for materials based on PT and LPM. Really 4 kbars are required for temperature change of 1 K in manganite instead of low pressure for lead titanate and the composite with x = 0.18. The extensive parameters are not strongly affected by the relationship between components of the composite and are changed in a rather narrow range of ∆S CE = 1.3–1.7 J/mol K. Only the 0.85LPM–0.15PT composite is an exception characterizing by rather low value of ∆S BCE at T FM. This effect can be explained by low value of the baric coefficient (Table II) and strong smearing of the heat capacity peak. The latter point leads to rather small values of the dS/dT derivative at low pressure.
External fields required to realize ∆T AD = 1 K and some caloric parameters for volumetric composites xLa0.7Pb0.3MnO3–(1−x)PbTiO3 and initial compounds LPMReference Kartashev, Mikhaleva, Gorev, Bogdanov, Cherepakhin, Sablina, Mikhashonok, Flerov and Volkov11 and PT.Reference Mikhaleva, Flerov, Gorev, Molokeev, Cherepakhin, Kartashev, Mikhashenok and Sablina10
Let us return to the intriguing effect of the MCE and RCPMCE converted values increase in composites compared to pure LPM. This phenomenon can be explained by the following way. On the one hand, the strong spin–lattice coupling and a volume anomaly near T FM were confirmed in crystals belonging to the manganites La1−yMe2+yMnO3 family.Reference Kartashev, Mikhaleva, Gorev, Bogdanov, Cherepakhin, Sablina, Mikhashonok, Flerov and Volkov11,Reference Rocco, Silva, Carvalho, Coelho, Andreeta and Gama22,Reference Sun, Kamarad, Arnold, Kou and Cheng23 On the other hand, no structural transformation accompanying the magnetic phase transition has been detected. As a result, the constant high pressure does not affect the magnetization value and leads only to the positive shift of T FM.Reference Rocco, Silva, Carvalho, Coelho, Andreeta and Gama22,Reference Sun, Kamarad, Arnold, Kou and Cheng23 However, it is necessary to take into account that ferromagnetic phase transition in the LPM component takes place when the PT component is in a ferroelectric state. The switching on of the magnetic field leads to  $\Delta T_{{\rm{AD}}}^{{\rm{MCE}}}$ appearance and simultaneously increases the elastic mechanical interaction between magnetostrictive and piezoelectric phases introducing stress in each other. In such a case, one can say about the appearance of pressure of intrinsic nature. Because of rather large BCE in LPM,Reference Kartashev, Mikhaleva, Gorev, Bogdanov, Cherepakhin, Sablina, Mikhashonok, Flerov and Volkov11 there is an additional contribution to the temperature change and RCP of the magnetic component as well as the composite as a whole. This hypothesis is in agreement with the data of BCE and MCE studies in Ni–Mn–Sn(Cu) alloy.Reference Castillo-Villa, Manosa, Planes, Soto-Parra, Sanchez-Llamazares, Flores-Zuniga and Frontera24 It was found that RCP(S)BCE increases under even constant magnetic field.
Thus, the ∆T AD value realized at T FM in composites under magnetic field can be considered as the sum of two intensive effects  $\Delta {T_{{\rm{AD}}}} = \Delta T_{{\rm{AD}}}^{{\rm{MCE}}} + \Delta T_{{\rm{AD}}}^{{\rm{BCE}}}$. Using Eq. (2) and data on the
 $\Delta T_{{\rm{AD}}}^{{\rm{BCE}}}$(p) dependence in LPM,Reference Kartashev, Mikhaleva, Gorev, Bogdanov, Cherepakhin, Sablina, Mikhashonok, Flerov and Volkov11 the possible values of intrinsic pressure leading to the increase of caloric effect in the composite were calculated. At H = 3.3 and 5.3 kOe, the pressure was found to be equal to 120 and 210 bar, respectively.
V. CONCLUSION
We have performed calorimetric and dilatometric investigations as well as direct measurements of intensive MCE on ferromagnetic–ferroelectric composites xLa0.7Pb0.3MnO3–(1−x)PbTiO3 (x = 0.18 and 0.85). Information regarding ECE and BCE was obtained by analysis of heat capacity, entropy and coefficient of thermal volume expansion in the framework of thermodynamic theory, Pippard and Maxwell relationships.
No strong effect of the composition on temperatures of the ferromagnetic and ferroelectric phase transitions in composites was found. This result substantiates the absence of any reaction or diffusion between components leading to formation of solid solutions.
The peculiarity of ECE behavior is that in the low electric fields, the intensive effect is increased with an increase in the LPM component concentration.
Small addition of the piezoelectric PT phase to the ferromagnetic LPM one increases MCE and relative RCPMCE of the sample with x = 0.85. When these results are compared with those of RCPBCE for T FM, it is apparent that both barocaloric and magnetocaloric efficiency of the compositional material can be significantly increased by varying the relationship between components in composites xLPM–(1−x)PT. The reason is associated with the mechanical stress appearing between grains of different ferroic phases under magnetic field.
Summarizing the results obtained, one can suppose that ferromagnetic–ferroelectric composites are really promising materials for their use as effective solid-state refrigerants in magnetic as well as multicaloric cooling cycles built on MCE and BCE as well as ECE and BCE.
ACKNOWLEDGMENTS
This study was supported in parts by The Russian Foundation for Basic Research (Grant No. 12-02-31253-mol-a), Federal Special Program ”Scientific and scientific-pedagogical staff of innovative Russia” (N 8379), and Council on Grants from the President of the Russian Federation for Support of Leading Scientific Schools (Grant NO. NSh-4828.2012.2). Dr. Maxim S. Molokeev is acknowledged for the x-ray characterization of the samples.