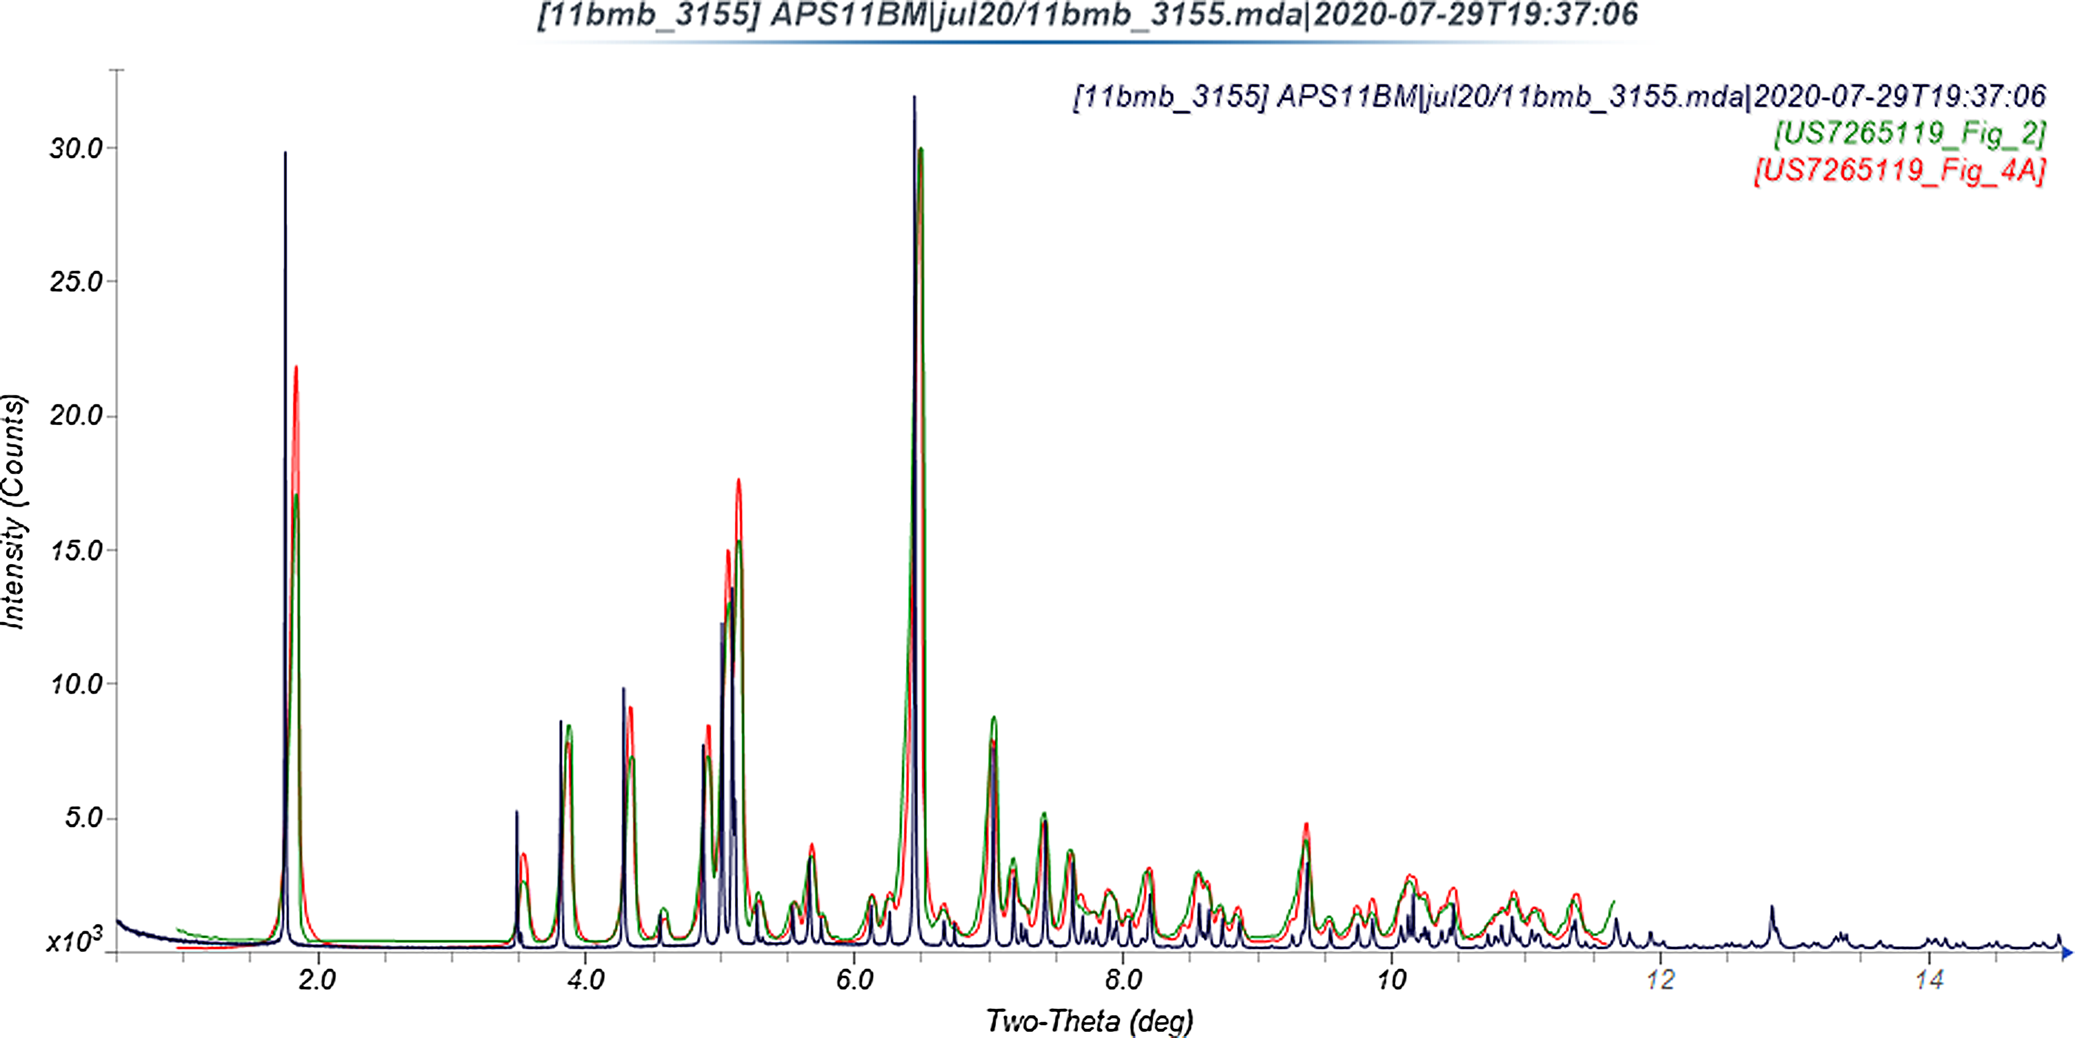
“Varenicline tartrate” (it is a 1:1 salt, so is more correctly called varenicline hydrogen tartrate), sold under the brand names Chantix® and Champix®, is used to treat smoking addition. Commercial varenicline hydrochloride (CASRN 375815-87-5) crystallizes in space group P212121 (#19 with a = 7.07616(2), b = 7.78357(2), c = 29.86149(7) Å, V = 1644.706(6) Å3, and Z = 4). No varenicline crystal structures are reported in the Cambridge Structural Database (Groom et al., Reference Groom, Bruno, Lightfoot and Ward2016) as of the completion of the current study, but X-ray powder patterns of anhydrous Forms A and B of varenicline tartrate are reported in US Patent 7265119 (Bogle et al., Reference Bogle, Williams and Rose2007; Pfizer; Figure 1), as well as a hydrate Form C. Form A is a kinetic polymorph, which converts into the thermodynamically stable Form B. The crystal structures of Forms B and C are also reported in this patent.
Comparison of the synchrotron pattern (black) of varenicline hydrogen tartrate Form B to the experimental (green) and calculated (red) patterns reported by Bogle et al. (Reference Bogle, Williams and Rose2007). The published patterns were digitized using UN-SCAN-IT (Silk Scientific, 2013) and scaled to the synchrotron wavelength of 0.457899 Å using MDI JADE Pro (MDI, 2020).

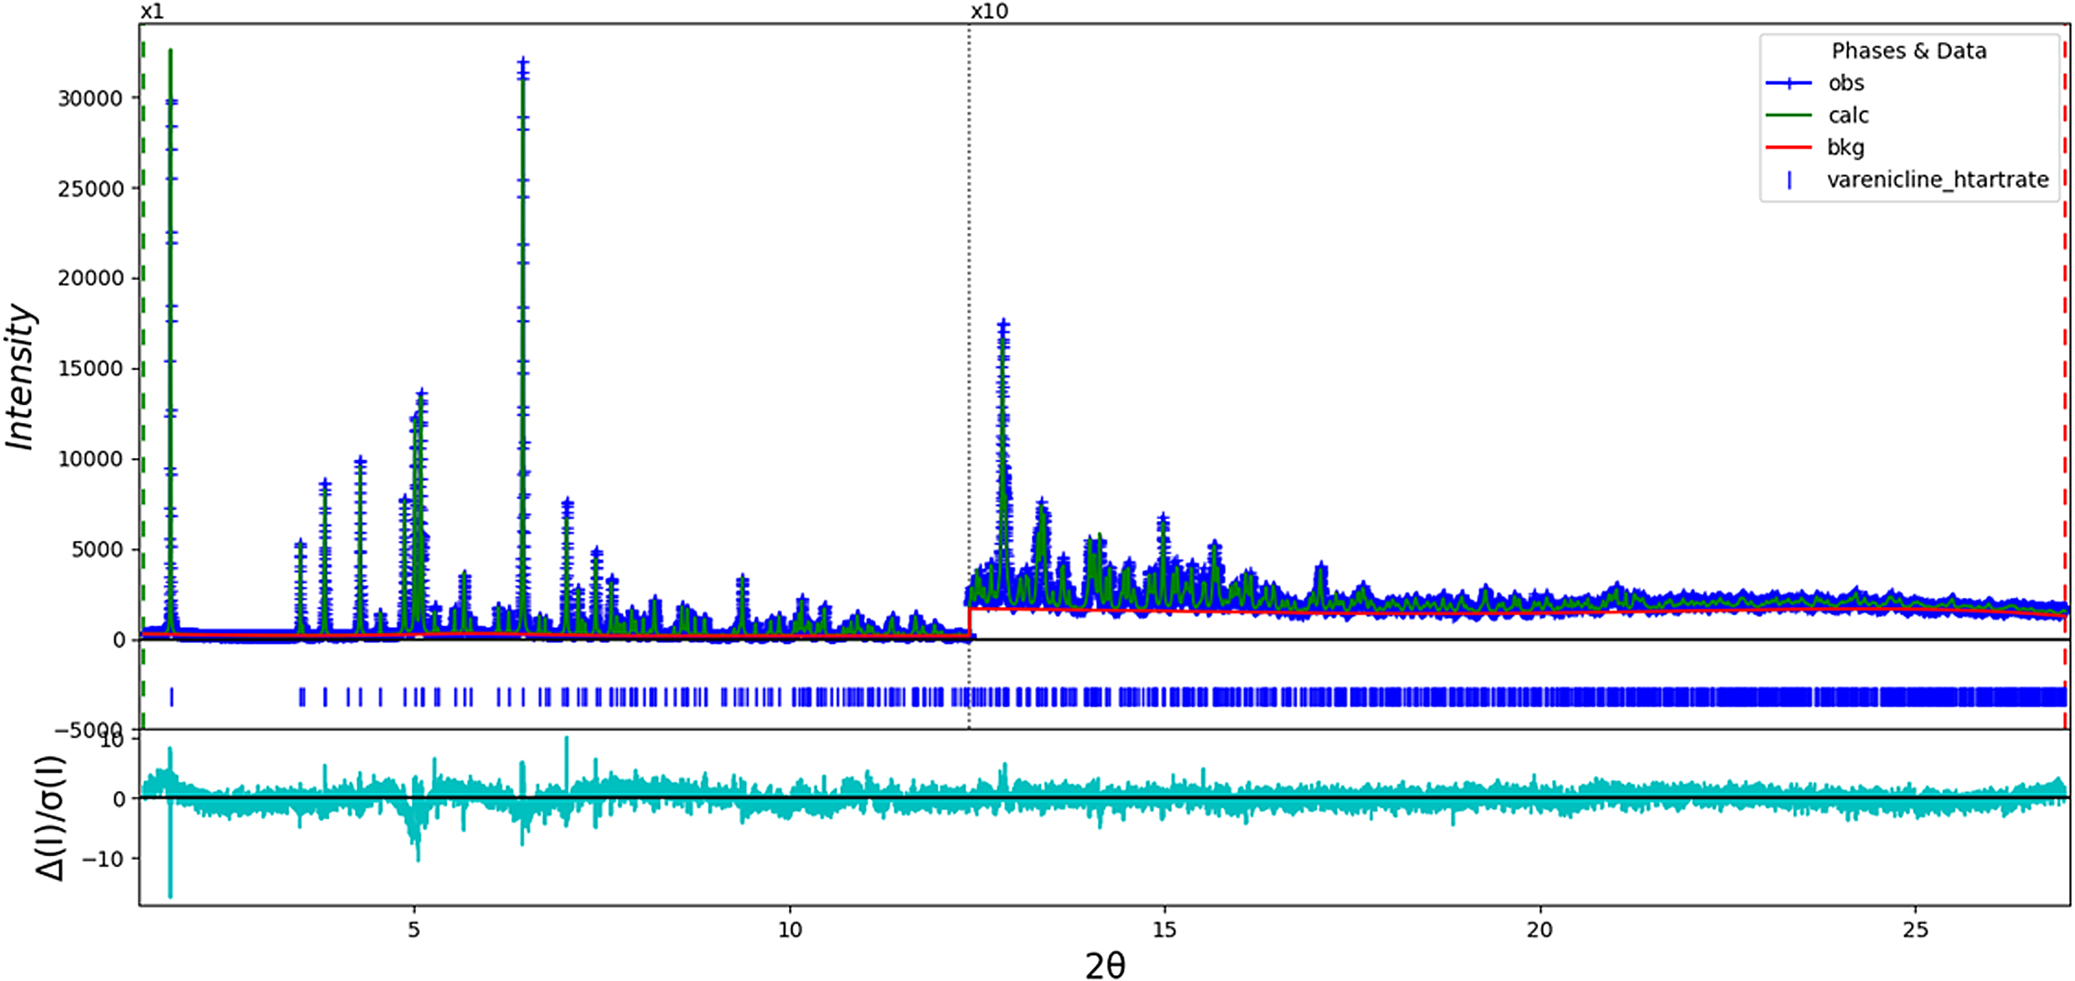
In this work, the sample was ordered from Sigma (Lot #65452) and analyzed as-received. The diffraction data for this study were collected on beamline 11-BM at the Advanced Photon Source, Argonne National Laboratory. The room temperature (295 K) crystal structure was refined (Figure 2) using synchrotron powder diffraction data (λ = 0.457899(2) Å) and optimized using density functional theory techniques. The structure was refined using GSAS-II (Toby and Von Dreele, Reference Toby and Von Dreele2013; d min = 0.981 Å). All bond distances and angles were restrained using the results of a Mercury/Mogul Geometry Check (Bruno et al., Reference Bruno, Cole, Kessler, Luo, Motherwell, Purkis, Smith, Taylor, Cooper, Harris and Orpen2004; Sykes et al., Reference Sykes, McCabe, Allen, Battle, Bruno and Wood2011; Figure 3). The DFT optimization was carried out, along with a Mulliken population analysis, using CRYSTAL14 (Dovesi et al., Reference Dovesi, Orlando, Erba, Zicovich-Wilson, Civalleri, Casassa, Maschio, Ferrabone, De La Pierre, D-Arco, Noël, Causà and Kirtman2014); the B3LYP functional and eight k-points were used. The basis sets for the H, C, N, and O atoms were those of Gatti et al. (Reference Gatti, Saunders and Roetti1994).
The Rietveld plot for the refinement of varenicline hydrogen tartrate Form B. The blue crosses represent the observed data points, and the green line is the calculated pattern. The cyan curve is the normalized error plot. The vertical scale is multiplied by a factor of 10× for 2θ > 12.4°.

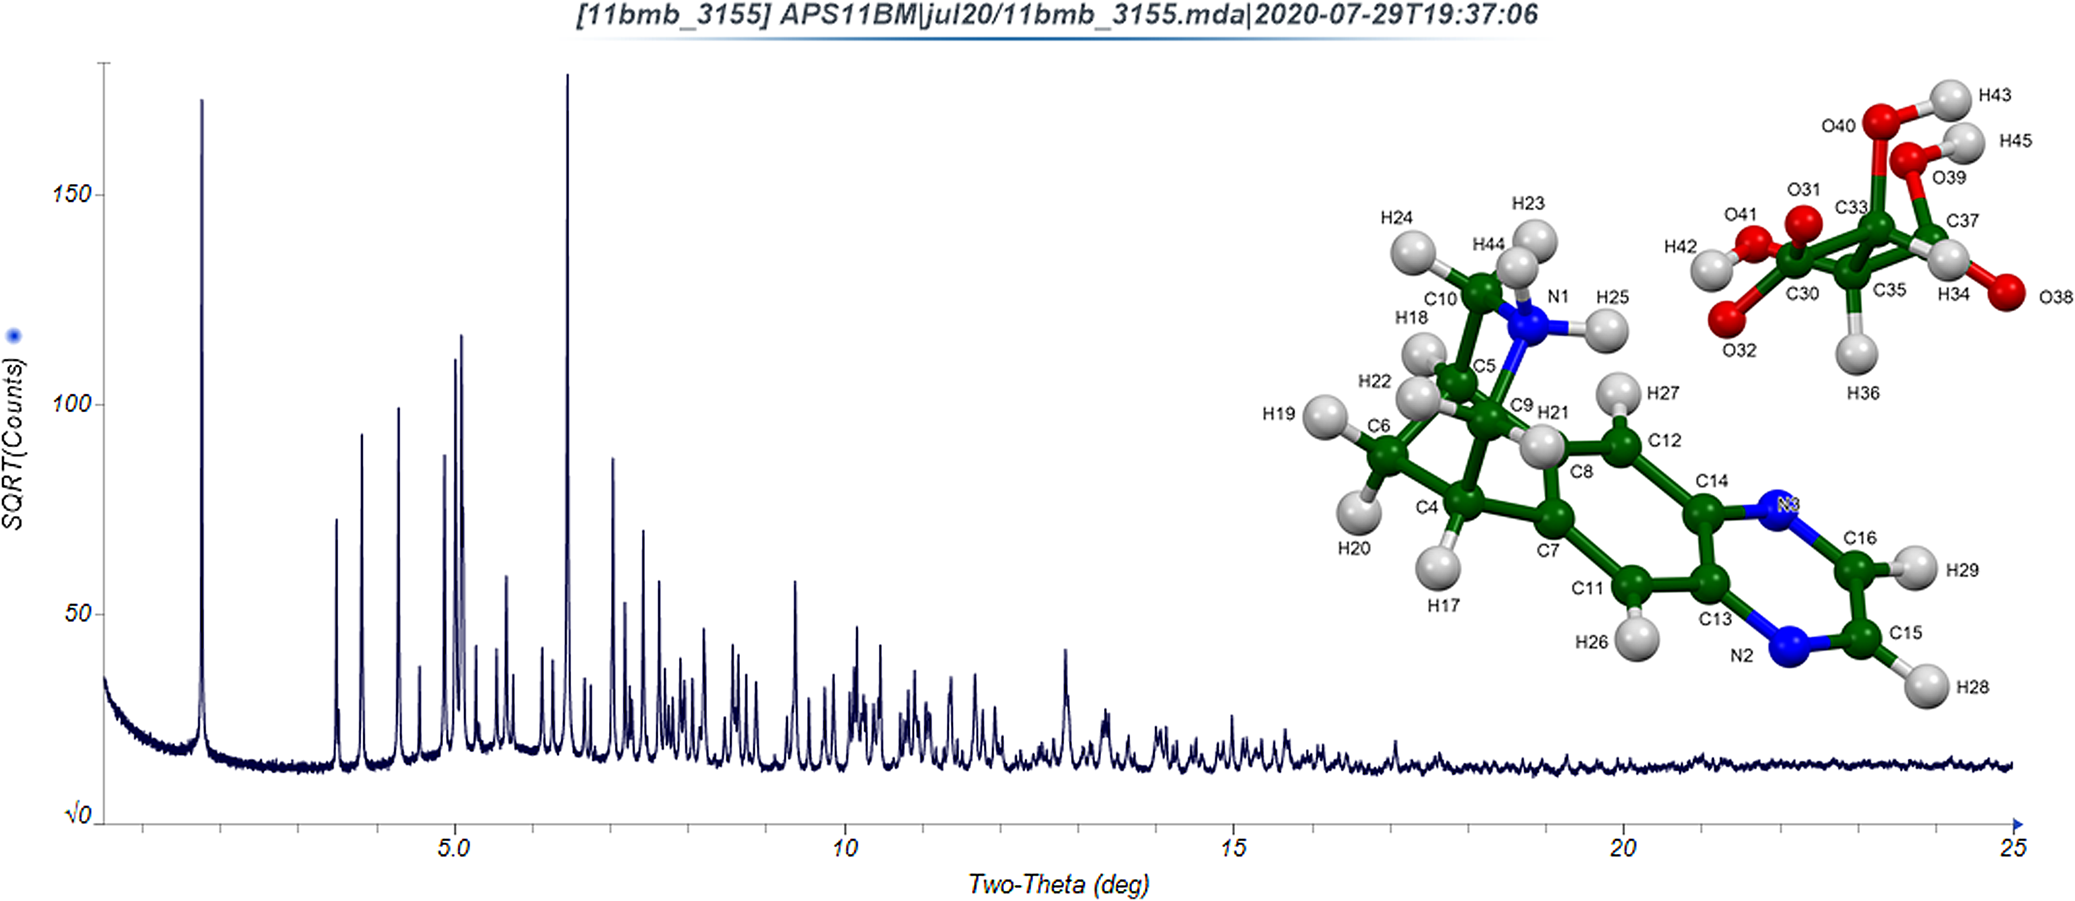
The powder diffraction pattern of varenicline hydrogen tartrate Form B (note that the vertical scale is the square root of the observed intensity) and the refined molecular structure (inset). The atoms are represented by 50% probability spheroids.

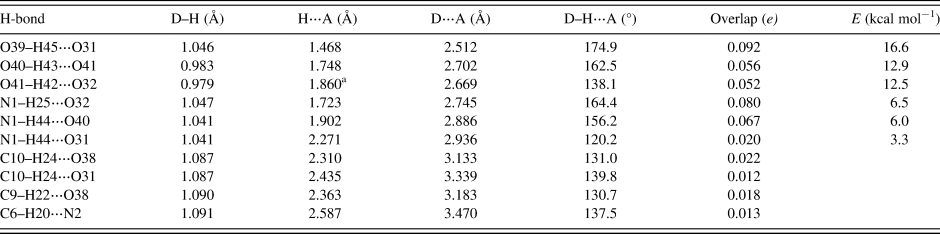
As expected, hydrogen bonds (Table I) are important in the crystal structure. The energies of the O–H⋯O hydrogen bonds were calculated using the correlation of Rammohan and Kaduk (Reference Rammohan and Kaduk2018). The energies of the N–H⋯O hydrogen bonds were calculated using the correlation of Wheatley and Kaduk (Reference Wheatley and Kaduk2019). These hydrogen bonds help rationalize the unusual conformation of the tartrate anion. Several weaker C–H⋅⋅⋅⋅O and C–H⋯N hydrogen bonds also contribute to the crystal energy. Hydrogen bonds link the cations and anions in zig-zag chains along the b-axis.
Hydrogen bonds (CRYSTAL14) in varenicline hydrogen tartrate.

a Intramolecular.
I. DEPOSITED DATA
CIF files were deposited with ICDD. You may request this data from info@icdd.com.
ACKNOWLEDGEMENTS
We thank Lynn Ribaud and Saul Lapidus for their assistance in the data collection, and Andrey Rogachev for the use of computing resources at IIT.
FUNDING
Use of the Advanced Photon Source at Argonne National Laboratory was supported by the U.S. Department of Energy, Office of Science, Office of Basic Energy Sciences, under Contract No. DE-AC02-06CH11357. This work was partially supported by the International Centre for Diffraction Data.
CONFLICTS OF INTEREST
The authors have no conflicts of interest to declare.