Implications
The study provides a method to determine the endogenous losses (EL) of amino acid (AA) and this technique reveals that excess dietary protein, fat or fiber affects the endogenous AA losses and should be considered for readjusting the AA requirements.
Introduction
A reliable methodology for the quantification of endogenous AA losses is needed to better evaluate dietary AA digestibility for the poultry industry. Utilizing labeled AA with stable isotopes is an advantage over other methods to determine EL because an isotope technique can be used with practical diets and support ad libitum feed intake. The limitations of using stable isotopes for measuring EL are the high cost of labeled AA and access to a MS system. A further limitation is the uncertainty about the indicator pool to determine labeling of the endogenous N or AA pool. To minimize costs, it is crucial to know the length of time to feed labeled AA in order to reach the isotopic steady state.
Because it has been reported that dietary protein, types of fats, fiber and anti-nutritional factors affect the endogenous AA (Siriwan et al., Reference Siriwan, Bryden and Annison1989; Angkanaporn et al., Reference Angkanaporn, Choct, Bryden and Annison1994; Danicke et al., Reference Danicke, Jeroch and Simon2000; Kluth and Rodehutscord, Reference Kluth and Rodehutscord2009), digestible AA requirements should be corrected using the endogenous AA losses. Determining the endogenous AA losses with current techniques may have limitations for establishing EL in practical diets. Using a nitrogen-free diet produces, for example, an abnormal physiological response because of the reduced feed and protein intake that depresses the pancreatic secretions (Snook and Meyer, Reference Snook and Meyer1964; Schneeman et al., Reference Schneeman, Chang, Smith and Lyman1977) which has been suggested to underestimate the endogenous AA flow rate (Ravindran et al., Reference Ravindran, Hew, Ravindran and Bryden2004; Adedokun et al., Reference Adedokun, Parsons, Lilburn, Adeola and Applegate2007). Similarly, the enzyme-hydrolyzed casein method uses semipurified broiler diets (Ravindran et al., Reference Ravindran, Hew, Ravindran and Bryden2004) that may interfere with the normal gastrointestinal protein secretion due to the reduced ingestion of feed, fat, fiber and anti-nutritional factors, whereas practical feed ingredients and normal intake of nutrient and anti-nutrient factors may stimulate the normal flow rate of gastrointestinal protein secretion. The use of regression analysis as a method to determine EL assumes that the flow of endogenous AA secretions does not change with the amount of protein consumed (Moughan et al., Reference Moughan, Souffrant and Hodgkinson1998) and finally the homoarginine method, also known as guanidination method, is reliable only for endogenous Lys (Rutherfurd et al., Reference Rutherfurd, Chung and Moughan2007).
Several studies in pigs (Lien et al., Reference Lien, Sauer and Dugan1997b; Leterme et al., Reference Leterme, Seve and Thewis1998; Hess et al., Reference Hess, Ganier, Thibault and Seve2000) and a few in chickens (Danicke et al., Reference Danicke, Jeroch and Simon2000; Xu et al., Reference Xu, Yao, Wang, Meng, Luo, Wu and Yang2011) have tried to measure the endogenous AA losses using practical diets; however, the variations of labeled sources, days of feeding, route of administration have made it difficult to define an accurate and reliable model. Steendam et al. (Reference Steendam, Verstegen, Tamminga, Boer, van’t End, Verstappen, Caine and Visser2004) demonstrated that route of tracer administration (oral or intravenous infusion) did not affect the ileal endogenous nitrogen recovery. It has been shown that most essential endogenous AA losses cannot be determined by labeling pigs with only 15N-leucine (Leterme et al., Reference Leterme, Seve and Thewis1998; Hess et al., Reference Hess, Thibault and Seve1998). It is hypothesized that oral administration with a mixture of labeled AA might result in a better representation of endogenous AA, while utilizing practical broiler diets.
The objectives are (1) establish a method for determining endogenous AA using isotopic AAs, and (2) evaluate the effects of dietary fat, protein and fiber on the EL.
Material and methods
Experiment 1
To determine the number of days to reach isotopic steady state of labeled AA, male broiler chicks (Cobb 500) used for the stable isotope labeled lysine (Lys) study were fed a test diet from 1 to 24 days. The test diet was given in the Supplementary Material S1. In all, 88 broiler chickens were placed randomly in four pens (1.29×3.048 m) with 22 birds/pen. Each pen was equipped with an individual tube feeder and nipple drinker. Fresh wood shavings were used as bedding material. An electronically controlled gas tube heater, ventilation fans and sidewall curtains were utilized to control the temperature and airflow. Ambient temperature was gradually decreased from 32°C at the start of the experiment to 21°C at 21 days of age. Incandescent lamps supplemented natural light to provide 23 h of light/dark. Feed and water were supplied ad libitum throughout the entire experiment. All management practices and procedures were approved by the University of Arkansas Institutional Animal Care and Use Committee.
Deuterium labeled Lys (D4-Lys; 4,4,5,5-D4, 96% to 98%, l-Lys 2HCl; Cambridge Isotope Labs Inc., Andover, MA, USA) was utilized to label endogenous secretions and its indicator pool. The D4-Lys was weighed and mixed with distilled water and kept at 5°C. On day 15, eight birds in each pen were identified by spraying their back with black paint and given between 0.6 and1.0 ml/bird per days of −Lys solution (25 mg/ml) at 2% of the daily dietary Lys intake (25 to 30 mg Lys/kg BW per day) from 15 to 24 days. The amount of daily Lys consumption by test chicks was calculated by multiplying estimated feed intake with formulated dietary Lys. Four additional chicks did not receive D4-Lys to serve as isotopic control (unlabeled Lys) for subsequent calculations. In order to obtain adequate quantity of jejunal and ileal digesta for each broiler on the day of collection, the feed was removed from 1900 to 0700 h the previous day. At 0700 h the D4-Lys was orally administered and immediately thereafter the feed were provided. After 2 h of providing D4-Lys and feed, four birds (one bird per pen) were randomly selected for blood samples (2.5 ml) and then sacrificed by CO2 gas for jejunal and ileal digesta collection. The digesta was immediately frozen and freeze-dried. The ileal digesta, defined from the Meckel’s diverticulum to a point ~4 to 5 cm proximal to the ileocecal junction, was collected from the distal one-half of ileum. Jejunal digesta was collected from the duodenojejunal junction to Meckel’s diverticulum.
Blood samples were taken from the right or left brachial wing vein and collected into 8 ml syringes containing 0.5 ml of heparin (1000 units/ml). Blood samples were centrifuged at 1290×g for 15 min and the plasma as supernatant was transferred into 2 ml caps and stored at −20°C.
Experiment 2
Dietary treatments
Four basal chicken starter (0 to 21 days of age) diets were formulated to prepare 10 diets from five ingredients (corn, soybean meal, animal protein blend, barley or poultry fat). The 10 diets were given in the Supplementary Material S1. A control (C) diet representing the standard commercial diet was first composed; then three basal diets were formulated with additions of fat (high fat diet; HF), protein (high protein diet; HP) and fiber (high fiber diet; HFi). Six intermediate diets were obtained by mixing between diet C and diet HF, HP or HFi, resulting in 10 treatments. All diets were fed in mash form. The CP, digestible Lys, digestible methionine (Met), available phosphorus, calcium, sodium, and micro minerals and vitamins in test diets were formulated to meet the daily nutrient needs of broilers (Cobb-Vantress, 2012) in order to avoid deficiencies of some nutrients due to the potential regulation of dietary ME intake. The dietary nutrients were adjusted to the same ME/nutrient ratio, except the nutrient in evaluation. The HP diet with excess protein was formulated with excess Lys and Met in order to maintain the same ratio of dietary Lys and Met/CP.
Birds, housing and experimental design
Male Cobb 500 chicks were obtained from Cobb-Vantress Hatchery, Fayetteville, AR, USA. Broiler chicks were vaccinated in ovo for Marek’s disease and on day 1 received vaccinations for Newcastle disease and infectious bronchitis post hatch via a coarse spray and randomly allotted to the floor pens. The broilers were placed on new litter (softwood shavings) over concrete floor pens (1.29×3.048 m). Pens were each equipped with an individual tube feeder and nipple drinker. Each of the 10 dietary treatments was replicated six times (25 male chicks/pen). At 16 days of age, 360 chicks were randomly transferred to 60 wire-floor grower battery cages (30-cm high, 75-cm wide, 30-cm deep), using six chicks per cage and six replicate cages per treatment, and given access to the same previous experimental diets containing 0.5% titanium dioxide (TiO2) as a marker. The battery cages were each equipped with an individual linear feeder and nipple drinker. The grower battery cage was placed in a chicken house equipped with electronically controlled gas tube heater, ventilation fans and sidewall curtains to control the temperature and airflow. Ambient temperature was gradually decreased from 32°C at the start of the experiment to 21°C at 21 days of age. Incandescent lamps supplemented natural light to provide 23 h of light/dark. Experimental feed and water were supplied ad libitum. All management practices and procedures were approved by the University of Arkansas Institutional Animal Care and Use Committee.
Analyses in feed and ileal digesta
Ileal samples were analyzed for TiO2, nitrogen (N) and AA; and diet samples were analyzed for TiO2, N, fat and NDF. Dry matter determination for feed was carried out according to standard procedures (Association of Official Analytical Chemists (AOAC), 2000; 930.15). Total N was determined by the combustion method (AOAC, 2000; 990.03) using a NA 2000 Nitrogen analyzer (Fisons Instruments, Milano, Italy). The NDF was treated with amylase and with residual ash based on ANKOM modification (ANKOM, 2006) of the Van Soest procedure (Van Soest et al., Reference Van Soest, Robertson and Lewis1991), using an ANKOM 200 fiber analyzer (ANKOM Technology, Macedon, NY, USA). Dry matter, N, ether extract (AOAC, 2000; 954.02), cysteine (Cys), Met (AOAC, 2000; 985.28) and all other AA (AOAC, 2000; 982.30 E) were analyzed at the Central Analytical Laboratory, University of Arkansas, Center of Excellence for Poultry Science. Titanium content was measured with a UV spectrophotometer (Shimadzu model UV-2101PC; Scientific Instruments Inc., Hawthorne, NY, USA) following a modified extraction procedure of Myers et al. (Reference Myers, Ludden, Nayigihugu and Hess2004).
Blood samples for labeled amino acids
One chick from each replicate pen of six chicks (transferred to cages) was randomly identified by spraying their back with black paint. The identified chick was orally administered with five different 15N-labeled AA for a 5-day period from 17 to 21 days of age. These five labeled AA were selected because the leucine is mostly used in labeled AA for pig, whereas methionine and cysteine, lysine and threonine are considered the first, second and third limiting AA in broiler diets. 15N-labeled AA such as 15N-threonine (15N-Thr), 15N-cysteine (15N-Cys), 15N-methionine (15N-Met), 15N-lysine (15N-Lys) and 15N-leucine (15N-Leu) (98% 15N-enrichment; Cambridge Isotope Labs Inc., Andover, MA, USA) were orally administered on a daily basis at 0700 h with a dose that provided 2% of daily intake of dietary Thr, Cys, Met, Lys and Leu in fed condition, except the last day of digesta and blood collection. At this last day (21 days), chicks were fasted from 1900 to 0700 h. At 0700 h the labeled AA was orally administered and immediately thereafter feed was provided. The AA needed to supply 2% of daily AA intake was similar as described for Experiment 1. The labeled AA was weighed, mixed with distilled water, kept at 5°C; and birds received 0.7 to 0.9 ml of labeled AA solution/day for a 5 day. The concentrations of labeled AA were 23 mg/ml for 15N-Lys, 9 mg/ml for 15N-Met, 8 mg/ml for 15N-Cys, 15 mg/ml for 15N-Thr, and 22 mg/ml for 15N-Leu. The doses varied between 0.7 and 0.9 ml per bird because the estimated daily intake of each test AA changed during the 5-day test period. Chicks received labeled AA and feed, blood and ileal digesta samples were collected after 2 h (0900 h); 3 ml of blood was taken from the right or left brachial wing vein from chicks received labeled AA. One unlabeled chick per replicate was randomly selected for blood samples (3 ml/bird). Blood samples were collected into syringes containing 0.5 ml of heparin and centrifuged at 1290×g for 15 min and the plasma as supernatant was transferred to 2 ml caps and stored at −20°C. Birds that received or did not receive labeled AA were killed by CO2 gas and ileal digesta was collected, frozen and then freeze-dried. The ileal digesta, defined from the Meckel’s diverticulum to a point ~4 to 5 cm proximal to the ileocecal junction, was taken from the distal one-half of ileum.
Preparation of hydrolysates and analyses of labeled AAs is described in the Supplementary Material S2.
Calculations
Apparent ileal digestibility of AA was calculated as follows (Kim et al., Reference Kim, Utterback, Applegate and Parsons2011):
 \scale96%{$${\rm AID}\,\left( \,\%\, \right)\,{\equals}\,\left[ {1\,{\minus}\,\left( {{\rm TiO}_{{2{\rm diet}}} \,/\,{\rm TiO}_{{2{\rm ileum}}} } \right){\times}\left( {{\rm AA}_{{{\rm ileum}}} \,/\,{\rm AA}_{{{\rm diet}}} } \right)} \right]{\times}100$$}
where: AAdiet is the amino acid of diet, AAileum the amino acid of ileal digesta, TiO2diet the titanium dioxide of diet, TiO2ileum the titanium dioxide of ileal digesta.
Real ileal digestibility of AA was calculated as follows (Hess et al., Reference Hess, Ganier, Thibault and Seve2000):
 $$\scale92%{{\rm RID}\,\left( \,\%\, \right)\,{\equals}\,\left[ {1-\left( {{\rm TiO}_{{2{\rm diet}}} \,/\,{\rm TiO}_{{2{\rm ileum}}} } \right){\times}{\rm AA}_{{{\rm ileum}}} {\plus}{\rm EL}} \right]\,/\,{\rm AA}_{{{\rm diet}}} {\times}100$$}
EL of labeled AA were calculated from the AA digested at the ileum and endogenous flow rate (EFR) (Steendam et al., Reference Steendam, Verstegen, Tamminga, Boer, van’t End, Verstappen, Caine and Visser2004).
 $$\eqalignno{ &{\rm EL}\,{\equals}\,{\rm AA}_{{{\rm ileum}}} {\times}{\rm EFR}{\times}\left( {{\rm TiO}_{{2{\rm diet}}} \,/\,{\rm TiO}_{{2{\rm digesta}}} } \right);\cr \quad\quad{\rm expressed}\,{\rm as}\,\,\%\,\,{\rm or}\,{\rm g}/{\rm kg}\,{\rm dry}\,{\rm matter}\,{\rm intake}\left\,( {{\rm DMI}} \right).$$
The EFR is defined as the labeled AA who passes from plasma to ileal digesta, assuming that enrichment of AA in plasma are similar to enrichment of endogenous AA in ileal digesta as demonstrated by Lien et al. (Reference Lien, Sauer and Dugan1997b). The following formula was used according to Yin et al. (Reference Yin, McEvoy, Schulze, Hennig, Souffrant and McCracken2000):
 $$\eqalignno{ &{\rm EFR}=\left( {{\rm APE}_{{{\rm digesta}}} /{\rm APE}_{{{\rm plasma}}} } \right).\,\cr {\rm APE}_{{{\rm digesta \,or \,plasma}}} ={\rm APE}_{{{\rm labeled \,AA}}} -{\rm APE}_{{{\rm unlabeled \,AA}}}; }} $$
APEdigesta is the 15N-enrichment (or enrichment) per bird in atom percent excess (APE) of digesta (ileum or jejunum) above enrichment of feed, and APEplasma is the 15N-plasma (or 2D-plasma) enrichment per bird in APE above baseline. APE is calculated as 15N/(15N+14N)×100 for 15N-enrichment or APE=D4/(D0+D4)×100 for D4-enrichment.
EL of CP (ELcp) were calculated from AA composition of mucin or pancreatic secretions using EFR of Thr, Cys, Met, Leu and Lys:
 $${\rm ELcp}\,{\equals}\,{\rm CP}_{{{\rm ileum}}} {\times}{\rm EFR}_{{{\rm mucin}\,{\rm or}\,{\rm pancreas}}} {\times}\left( {{\rm TiO}_{{2{\rm diet}}} \,/\,{\rm TiO}_{{2{\rm ileum}}} } \right)$$
where: CPileum=CP of ileum, EFRmucin or pancreas=endogenous flow rate of mucin or pancreas.
It was assumed that AA composition of mucin or pancreas was similar between pigs and birds. The EFRmucin or pancreas was calculated using the pig AA composition of mucin (Lien et al., Reference Lien, Sauer and Fenton1997a) and pancreas (Corring and Jung, Reference Corring and Jung1972) by the following equations:
 $$\eqalignno{ &{\rm EFR}_{{{\rm mucin}}} \,{\equals}\, {\rm EFR}_{{{\rm Thr}}} {\times}0.46{\plus}{\rm EFR}_{{{\rm Cys}}} {\times}0.28{\plus}{\rm EFR}_{{{\rm Met}}} {\times} 0.02\cr \!\quad\quad\quad\quad{\plus}{\rm EFR}_{{{\rm Lys}}} {\times}0.08{\plus}{\rm EFR}_{{{\rm Leu}}} {\times}0.16} $$
 $$\eqalignno{ &{\rm EFR}_{{{\rm pancreas}}} \,{\equals}\, {\rm EFR}_{{{\rm Thr}}} {\times}0.24{\plus}{\rm EFR}_{{{\rm Cys}}} {\times}0.08{\plus}{\rm EFR}_{{{\rm Met}}} {\times}0.05 \cr & \!\!\quad\quad\quad\quad\quad{\plus}{\rm EFR}_{{{\rm Lys}}} {\times}0.24{\plus}{\rm EFR}_{{{\rm Leu}}} {\times}0.39$$
Statistical procedures
Statistical analyses were performed using the JMP 10 statistical software (SAS Institute Inc., Cary, NC, USA). In Experiment 1, the steady state of plasma, jejunal digesta and ileal digesta APE in function of time was analyzed using the broken-line model which was described by the following equation: Y=L+U (X LR−R), where Y=APE, L=the ordinate of the breakpoint in the curve, R=abscissa of the breakpoint, X LR=value of X less than R and U=slope of the line for X LR less than R. If X⩽Plateau, Y=L+U(X LR−R); otherwise, Y=L. In Experiment 2, the AID, RID, EFR and EL of CP and AA were analyzed by one-way ANOVA using the GLM procedure testing independently the groups of dietary fat (5.7%, 8.0%, 12.0%, 13.0%), protein (23.1%, 26%, 28.5%, 31%) or fiber (11.5%, 14.0%, 16.0%, 18.0% of NDF). The control diet was run within each group. When a significant F-test was detected, means were separated using the LSMEANS student’s t test. The EFR, EL, AID and RID in function of dietary fat, protein or fiber were analyzed using the linear and quadratic regression models which were described as follows: Y=a+bX; or Y=a+bX+cX 2, where Y=EFR, EL, AID or RID of AA and CP, X=levels of dietary fat, protein or NDF, a=intercept, b=slope or level effect, c=slope of quadratic variable. A probability value of P⩽0.05 was described to be significant, while P-values⩽0.10 are shown and described as a trend.
Results
Experiment 1
The APE of D4-Lys in plasma, jejunal digesta and ileal digesta reached the isotopic steady state at 5.5, 3.4 and 2.0 days of oral administration, respectively, using the broken-line model (Table 1).
Broken-line model of D4-lysine enrichment (atom percent excess (APE)) for plasma, jejunal digesta and ileal digesta in response to days receiving oral D4-lysine (experiment 1)Footnote 1

Y=L+U(X LR−R), where Y=APE, L=the ordinate of the breakpoint in the curve, R=abscissa of the breakpoint; X LR=value of X less than R and U=slope of the line for X less than R.
1 APE values of D4-lysine in plasma, jejunal digesta and ileal digesta collected from 16 to 24 days of age. Blood and digesta samples were collected 2 h after the oral administration and meal.
2 Pooled root mean square error (RMSE).
Experiment 2
Endogenous flow rate, endogenous losses
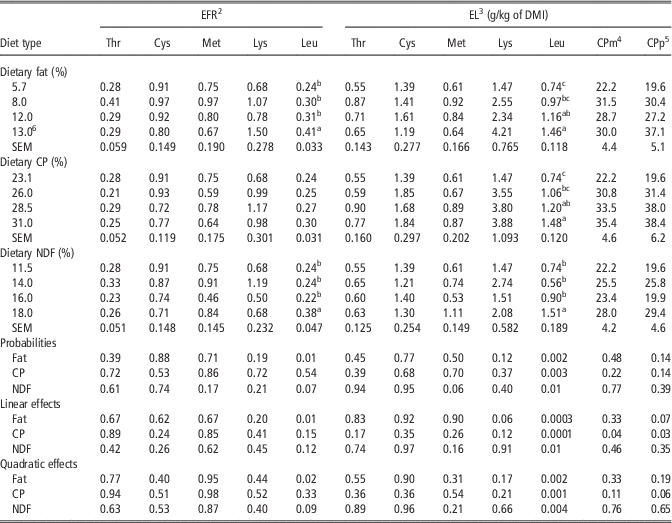
The effects of dietary nutrients on EFR and EL of labeled AA and CP are shown in Table 2. Type of diets had no effect on EFR of labeled AA except 15N-Leu. The EFR of 15N-Leu was increased by dietary fat linearly and by fiber quadratically (P=0.09), but not by dietary protein. The dietary fat, protein and fiber had no effect on EL of Thr, Cys, Met and Lys. In contrast, EL of Leu was linearly increased by dietary fat and protein, and quadratically increased by dietary fiber. Additions of dietary fat stimulated the EL of Lys (P=0.06), Leu, and CP from pancreas (P=0.07). Adding dietary protein linearly increased the EL of Leu and CP estimated from mucin and pancreas.
Influence of diet type on endogenous flow rate (EFR) and endogenous losses (EL) of labeled amino acids and protein from male broiler chicks at 21 days of age (experiment 2)Footnote 1

Thr=threonine, Cys=cysteine, Met=methionine, Lys=lysine, Leu=leucine; SEM=pooled standard error of mean; DMI, dry matter intake.
a,b,cMeans in a column not sharing superscript are significantly different (P⩽0.05).
1 Each value represents the mean of six replicates (one bird per replicate for EFR and six birds per replicate for EL).
2 EFR=APEileum/APEplasma; APE=atom percent excess. APEileum or plasma=APElabeled – APEwithout lalebed.
3 EL (g/kg of DMI)=AA or CPileum×(APEileum/APEplasma)×(TiO2diet /TiO2ileum).
4 Calculated from profile of mucin secretion amino acid composition using the five labeled amino acids. The mucin amino acid composition of pig small intestine was obtained from Lien et al. (Reference Lien, Sauer and Fenton1997a). An average of EFR was obtained as follow: EFRaverage=EFRThr×0.46+EFRCys×0.28+EFRMet×0.02+EFRLys×0.08+EFRLeu×0.16.
5 Calculated from profile of pancreatic secretion amino acid composition using the five labeled amino acids. The pancreatic amino acid composition of pig small intestine was obtained from Corring and Jung (Reference Corring and Jung1972). An average of EFR was obtained as follow: EFRaverage=EFRThr×0.24+EFRCys×0.08+EFRMet×0.05+EFRLys×0.24+EFRLeu×0.39.
6 Value reported as analyzed fat.
Apparent ileal amino acid and protein digestibility
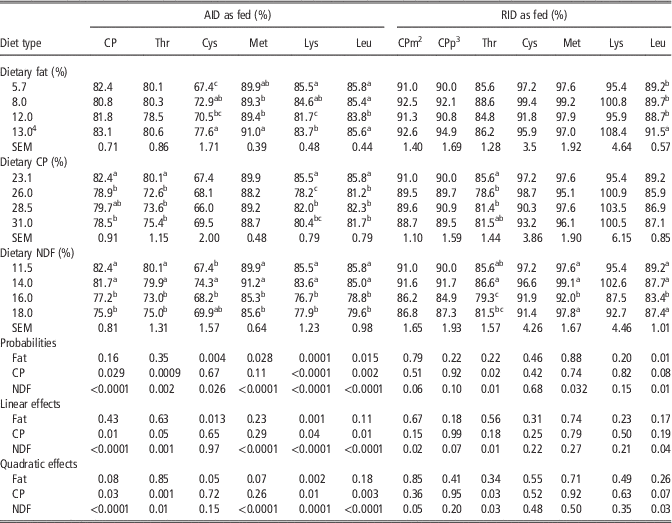
The means, linear and quadratic effects of AID for CP and labeled AA are presented in Table 3. Dietary fat linearly increased the AID of Cys. Further, dietary fat quadratically decreased the AID of protein (P=0.08) but increased the AID of Met (P=0.07). The AID of Lys was reduced linearly and quadratically by dietary fat, but R 2 was higher for quadratic model (0.45 v. 0.41). Broilers fed diets with 12% dietary fat had the smallest AID of Leu. Dietary protein decreased quadratically the AID of Thr, Lys and Leu; and linearly the AID of CP. Similarly, dietary fiber reduced linearly and quadratically the AID of CP, Thr, Met, Lys and Leu. The AID of Cys for broilers fed 14% dietary NDF was higher than the AID of Cys for broiler chickens fed 11.5% or 16% dietary NDF.
Influence of diet type on apparent ileal digestibility (AID) and real ileal digestibility (RID) of labeled amino acids and protein from male broiler chicks at 21 days of age (experiment 2)Footnote 1

Thr=threonine, Cys=cysteine, Met=methionine, Lys=lysine, Leu=leucine; SEM=pooled standard error of mean.
a,b,cValues in a column with different superscripts differ significantly at P<0.05.
1 Each value represents the mean of six replicates (six birds per replicate).
2 Calculated RID of CP from mucin as described in Table 2.
3 Calculated RID of CP from pancreatic secretion as described in Table 2.
4 Value reported as analyzed fat.
Real ileal amino acid and protein digestibility
The EL of AA and CP that were enhanced by dietary nutrients numerically increased the RID (Table 3). The dietary fat or protein did not affect the RID of CP and AA except Leu and Thr. Chicks fed 13% of dietary fat produced the highest RID of Leu. Dietary protein reduced quadratically the RID of Thr and Leu (P=0.07). The dietary fiber reduced linearly the RID of Thr and RID of CP from pancreas (P=0.07) and mucin, and decreased quadratically the RID of Leu. Broilers fed 16% dietary NDF had 6% lower RID of Met than that from broilers fed 11.5%, 14% or 18% of dietary NDF.
Discussion
As molecular fragments monitor the entire molecular weight defined as mass-to-charge ratio, it was assumed that D4-Lys and 15N-Lys lead to a similar isotopic steady state for plasma. As a result of isotopic steady state for plasma, jejunal digesta and ileal digesta found in experiment 1, it was considered that 5 days of oral labeled AA are needed to reach the isotopic steady state. In agreement with the experimental design of providing oral labeled AA for 5 days, Danicke et al. (Reference Danicke, Jeroch and Simon2000) demonstrated that the highest 15N-enrichment of feces in chickens was also reached in 5 days. The theory of EFR states that the pool of AA in plasma is the main parenteral source to produce endogenous nutrients (Lien et al., Reference Lien, Sauer and Dugan1997b). It is assumed that the labeled AA collected at the brachial wing vein is equal to concentration of labeled AA in the mesenteric artery, which is a direct endogenous supplier of AA for the gastrointestinal tract. The similarity of plasma AA enrichment with enrichments from crude mucin (Lien et al., Reference Lien, Sauer and Dugan1997b) and pancreatic secretions (Simon et al., Reference Simon, Zebrowska, Bergner and Munchmeyer1983) in pigs indicates that plasma is the correct precursor pool for the main endogenous secretions. It should be pointed out that the secreted labeled AA in the digestive tract administered orally or by continuous intravenous infusion always will be reabsorbed in the gut. Studies in pigs show that endogenous nitrogen recovery was not affected by the route of tracer administration via oral or intravenous infusion, despite 6% difference in plasma 15N-Leu enrichment and similar digesta 15N-Leu enrichment (Steendam et al., Reference Steendam, Verstegen, Tamminga, Boer, van’t End, Verstappen, Caine and Visser2004).
In contrast to the current results, Honda et al. (Reference Honda, Kamisoyama, Isshiki and Hasegawa2009) found no effects on protein digestibility when chickens fed from 3% to 10% of crude fat. The difference in the later study can be explained by the use of semipurified diets, which might not stimulate the pancreatic juice. Contrary to our results, adding fat improved the apparent digestibility of lysine (Tao et al., Reference Tao, Belzile and Brisson1971). This difference might be attributed to the use of smaller levels of dietary fat than reported herein. In agreement with our results, the RID of AA was not affected by increasing dietary fat (Honda et al., Reference Honda, Kamisoyama, Kubo, Motoori and Hasegawa2010). However, those results are not comparable due to the use of semipurified and protein-free diets to calculate the endogenous AA. The curvilinear reduction of AID of CP, Met and Lys as dietary fat increased suggests that in practical diets, the protein and AA should be adjusted when fat is supplemented.
No reference in broiler chickens had been reported about the effects of dietary protein on AID or RID of protein and AA using practical diets. Using cornstarch-based diets Reference Kluth and RodehutscordKluth and Rodehutscord (2009) reported that the AID of CP and AA was increased when chicks received dietary protein levels from 5% to 13%. However, this study was conducted with smaller levels of protein than reported herein, which an increment may improve the protein digestibility in chickens fed deficient protein diets.
In agreement with the current results, the dietary fiber reduced the AID of CP and AA (Reference Kluth and RodehutscordKluth and Rodehutscord, 2009), even though this study used cellulose as fiber (Reference Kluth and RodehutscordKluth and Rodehutscord, 2009).
The RID AA reflects the broiler AA requirement and not the supply of AA from the feed because the endogenous AA is excreted from the body. Therefore, the RID AA values of feed ingredients are not recommended in feed formulation but EL of AA used as a correction of the standardized ileal digestible AA requirement.
The RID for protein matches closely to the values given for broiler chickens fed rye-soybean meal diets and 15NH4HCO3 (Danicke et al., Reference Danicke, Jeroch and Simon2000). In current study, the average difference of all diets between AID and RID of CP was around 10% (80.1% v. 90.1%). This variation is mostly explained by the highest EL of Cys and Lys. Using other methodology to calculate endogenous N, Danicke et al. (Reference Danicke, Jeroch and Simon2000) reported a difference of 6% between the AID and RID of CP (83.8% v. 90.3%) in rye-soybean meal diet. This discrepancy might be explained because endogenous N was calculated using urine for APE analysis resulting in less endogenous N (13.4 mg/kg DMI) compared with current study (33.4 mg/kg DMI). In chickens using semisynthetic or N-free diets (Lemme et al., Reference Lemme, Ravindran and Bryden2004; Kluth and Rodehutscord, Reference Kluth and Rodehutscord2009) the ileal endogenous N losses were smaller than reported herein.
The range of EL of Thr found herein (0.55 to 0.90 g/kg of DMI) are in agreement with values reported by Lemme et al. (Reference Lemme, Ravindran and Bryden2004) and Angkanaporn et al. (Reference Angkanaporn, Ravindran, Mollah and Bryden1997). Compared with current results, lowest EL of Thr, Cys and Met were reported in N-free diets, semipurified diets and extrapolation to zero nitrogen intakes (Lemme et al., Reference Lemme, Ravindran and Bryden2004; Adedokun et al., Reference Adedokun, Parsons, Lilburn, Adeola and Applegate2007; Kluth and Rodehutscord, Reference Kluth and Rodehutscord2009). In present research the EL of Thr or Cys were not affected by the fat, protein or fiber. However, the EL of protein calculated from mucin composition responded linearly to dietary protein. The Thr and Cys might contribute to this response because they are the two most abundant AA in mucin secretion. In contrast to the current results, Kluth and Rodehutscord (Reference Kluth and Rodehutscord2009) demonstrated that EL of Cys was increased by adding cellulose. However, those Cys EL values were smaller than reported herein, which were calculated by extrapolate the N intake to zero.
The EL of Lys was increased by dietary fat but not affected by dietary protein and fiber using practical diets. To the authors’ knowledge there were no references published similar to this approach. On the other hand, the highest and fluctuated EFRs of Lys might be explained by the interference of bacteria in ileal digesta. In pigs the lysine originated from bacteria was the main contributor for AAs in ileal digesta (Lien et al., Reference Lien, Sauer and Dugan1997b).
The range of Leu EL (0.6 to 1.5 g/kg of DMI) reported herein is comparable with those estimated by homoarginine, but lower than those calculated by N-free diet, extrapolation to zero N intake, or semipurified protein diets (Lemme et al., Reference Lemme, Ravindran and Bryden2004; Adedokun et al., Reference Adedokun, Parsons, Lilburn, Adeola and Applegate2007). The increased EL of Leu due to protein, fat and fiber suggest that the main contribution of these endogenous secretions are originated from the pancreas. The leucine known as the third most abundant AA in pancreatic protein secretion (Corring and Jung, Reference Corring and Jung1972) supports this hypothesis.
In agreement with the current study, the Leu EL was increased by addition of dietary fiber (Siriwan et al., Reference Siriwan, Bryden and Annison1989), AA (Parsons et al., Reference Parsons, Potter and Brown1983; Angkanaporn et al., Reference Angkanaporn, Choct, Bryden and Annison1994; Kluth and Rodehutscord, Reference Kluth and Rodehutscord2009) and protein (Siriwan et al., Reference Siriwan, Bryden and Annison1989). These secretions might be mostly originated from enzyme pancreatic secretions when dietary fiber and protein were provided (Imondi and Bird, Reference Imondi and Bird1967; Lee et al., Reference Lee, Nitsan and Liener1984; Langlois et al., Reference Langlois, Corring and Fevrier1987; Ikegami et al., Reference Ikegami, Tsuchihashi, Harada, Tsuchihashi, Nishide and Innami1990). To our knowledge, this is the first study reporting that dietary fat increased the EL of Leu. In chickens, adding dietary lipid has been shown to enhance pancreatic lipase (Hulan and Bird, Reference Hulan and Bird1972) and chymotrypsin activities (Wicker and Puigserver, Reference Wicker and Puigserver1987), and therefore, increased the AA endogenous secretions.
Considering the plasma AA as indicator pool for labeling endogenous secretions and steady state for D4-lysine is also representative for the 15N-labeled AA, the results of this study shows that: (1) 5 days of isotope administration are needed to reach the isotopic steady state. (2) The EL of Leu was increased with additions of dietary fat, protein or fiber; EL of CP was increased by dietary fat and protein, and EL of Lys was enhanced by dietary fat.
Acknowledgments
The authors would like to thank Adisseo, Inc. (Antony, France) for financial support in the form of a Rovabio Research Grant, 2010–12.
Supplementary material
To view supplementary material for this article, please visit https://doi.org/10.1017/S1751731117002166