Introduction
A key feature of the evolutionary developmental biology (evo–devo) approach to the study of evolutionary change is the interplay between research on how developmental systems evolve and exploration of how developmental processes affect organismal evolution (Müller Reference Müller2007; Moczek et al. Reference Moczek, Sears, Stollewerk, Wittkopp, Diggle, Dworkin, Ledon-Rettig, Matus, Roth, Abouheif, Brown, Chiu, Cohen, De Tomaso, Gilbert, Hall, Love, Lyons, Sanger, Smith, Specht, Vallejo-Marin and Extavour2015). By providing information on the primitive states of developmental characters, the study of ontogenetic series of extinct organisms, or “fossilized ontogenies,” can complement developmental studies on living organisms in pursuing both aims (Fusco et al. Reference Fusco, Garland, Hunt and Hughes2012).
Despite the potential of a developmental approach to phenotypic evolution in extinct clades, the fossil record does not generally preserve a detailed record of development within those clades (Sánchez Reference Sánchez2012). The few exceptions include a major clade of extinct arthropods, the Trilobita. In these arthropods, early postembryonic biomineralization of the exoskeleton has resulted in a record of fossilized ontogenies that is among the most comprehensive for any extinct group (Hughes Reference Hughes2003).
In recent years, several studies have shed light on ancestral features of trilobite postembryonic development. These are commonly descriptive, taxon-specific studies (e.g., Dai and Zhang Reference Dai and Zhang2013; Kihm et al. Reference Kihm, Park and Choi2013; Webster Reference Webster2015), accompanied by several broader comparative analyses of trilobite growth, segmentation, and tagmatic differentiation (e.g., Hughes Reference Hughes2003; Minelli et al. Reference Minelli, Fusco and Hughes2003; Hughes et al. Reference Hughes, Minelli and Fusco2006; Fusco et al. Reference Fusco, Garland, Hunt and Hughes2012). In parallel with these studies, and using a markedly different analytical approach, the unusually rich preservation of the Czech middle Silurian trilobite Aulacopleura koninckii has allowed investigation of the control mechanisms of growth and segmentation in this taxon, providing the oldest window into the dynamics of developmental regulation in Paleozoic arthropods.
Quantitative analyses of articulated (i.e., complete) exoskeletons of this ~429 Myr old trilobite have yielded a degree of insight into the controls of ancient development unusual for any fossil. We have previously examined the specification of adult segment number, showing that the final number was determined precociously in ontogeny, and the regulation of growth, showing that it was targeted (i.e., compensatory), the oldest evidence for this kind of growth control in Metazoa (Fusco et al. Reference Fusco, Hughes, Webster and Minelli2004). More recently, we have established the presence of a juvenile trunk growth gradient, that is, a distribution of differential growth rates along the main body axis, in which segment growth rates were dependent on the specification of relative position within the trunk, possibly deriving from a graded signal, similar to those provided by morphogens in extant organisms (Fusco et al. Reference Fusco, Hong and Hughes2014). These studies demonstrate that specific hypotheses about the control of ancient development can be formulated and tested in an extinct organism. In this paper we examine whether growth gradients existed in other parts of the body and during other growth phases.
In trilobites, as in arthropods in general, exoskeletal growth occurred in a stepwise manner, with postembryonic development paced by the molt cycle. The succession of molts thus provides a standard periodization of their postembryonic development divided into a series of stages (or instars) (Minelli and Fusco Reference Minelli and Fusco2013).
Major subdivisions of the postembryonic life of trilobites are traditionally based on the development of articulating joints between segments (Chatterton and Speyer Reference Chatterton and Speyer1997; Hughes et al. Reference Hughes, Minelli and Fusco2006). At the anterior of the main body axis, conjoined segments comprised the cephalon, a structure with an apparently stable complement of segments throughout ontogeny. The trunk region succeeded the cephalon and changed dynamically during ontogeny in both the number of segments expressed and in the number of articulating joints between segments. The earliest widely recognized phase of trilobite ontogeny is the protaspid period, during which all body segments (cephalic and trunk) formed an undivided biomineralized shield (Chatterton and Speyer Reference Chatterton and Speyer1997). This period typically embraced a small number of instars, and is unknown for A. koninckii, although the closely related species A. wulongensis had at least three identifiable protaspid stages (Yuan et al. Reference Yuan, Li, Zhou and Zhang2001). Later, postprotaspid instars were characterized by the development of a series of articulations involving the trunk region, the first of which appeared at the cephalic/trunk boundary.
The onset of cephalic/trunk articulation marked entry into the meraspid period (the first postprotaspid period), starting with the division of the dorsal exoskeleton into two components, the cephalon and a set of conjoined trunk segments called the pygidium. At this first meraspid stage the pygidium included all trunk segments. During subsequent meraspid stages, new articulations developed sequentially at the anterior of the pygidium, resulting in a set of articulating trunk segments, collectively called the thorax, in front of it (Fig. 1). In parallel, new trunk segments appeared sequentially in a subterminal zone within the pygidium, and the expression of new segments near the rear of the pygidium and release of older segments at the anterior of the pygidium maintained an approximate balance in A. koninckii. The meraspid period was divided into a series of meraspid degrees defined by the number of freely articulating segments within the thoracic region, and in the case of A. koninckii each degree appears to have comprised one stage (Fusco et al. Reference Fusco, Hughes, Webster and Minelli2004), although this is not the case in all trilobites (e.g., Dai et al. Reference Dai, Zhang and Peng2014; Hou et al. Reference Hou, Hughes, Lan, Yang and Zhang2015). Progressive release of trunk segments into the thorax continued until the individual entered the final, holaspid period (the second postprotaspid period) of development, characterized by a stable number of thoracic segments, despite continued molting and growth. In contrast to most other trilobites, A. koninckii varied intraspecifically in the final (holaspid) number of thoracic segments, from 18 to 22, partitioning the species into five distinct morphotypes (t18–t22).
Aulacopleura koninckii landmark configuration. Dots, cephalic landmarks; diamonds, trunk landmarks. Black symbols are axial landmarks. All cephalic landmarks with the exclusion of that marking the anterior margin of the occipital ring contribute to CCS. Bars on the left show the main body regions (pyg., pygidium). Bars on the right show the main axial morphometric characters used in this study: CEL, cephalic length; FAL, frontal area length; GLL, glabellar length; PGL, preoccipital glabellar length; ORL, occipital ring length; TRL, trunk length; PYL, pygidial length. The number of thoracic segments (TS) with their landmarks varies among specimens (illustrated here is a stage s11 meraspid specimen, with 11 TS). TS landmarks were positioned at the intersection between the sagittal axis and the transversal line connecting the articulating processes at the two sides of each segment (black lines).

In contrast to stages, which have a developmental meaning, morphs of A. koninckii have a purely morphological connotation: they reflect the observed number of thoracic segments of the fossil, and range from m4 to m22 in our data set. Specimens of morphs m4 to m17 were certainly meraspid, but of unknown morphotype, and specimens of morph m22 were certainly holaspids of morphotype t22. However, small specimens of morphs m18 to m21 represent a mix of late meraspids (of a morphotype with more segments) and early holaspids, while morphs m18–m21 of larger size were holaspids of the corresponding morphotype. There is no way obvious to determine the final thoracic segment number of any individual below a minimal size above which all specimens were almost certainly holaspid (Hong et al. Reference Hong, Hughes and Sheets2014).
Another way to characterize trilobite ontogeny, and one that makes it more comparable with that of extant arthropods (Fusco and Minelli Reference Fusco and Minelli2013), relates to the appearance of trunk segments. Almost all trilobites had an anamorphic phase of multiple stages, during which new trunk segments were added at the rear of the trunk, followed by an epimorphic phase, during which the number of trunk segments remained constant across stages. This postembryonic mode of segmentation is known as hemianamorphic development (Minelli et al. Reference Minelli, Fusco and Hughes2003). In A. koninckii the start of the epimorphic phase coincided with onset of the holaspid period, and this coincidence is referred to as synarthromeric development (Hughes et al. Reference Hughes, Minelli and Fusco2006).
The aim of this paper is to examine whether growth gradients, similar to the one detected in the meraspid trunk, existed in the meraspid and holaspid cephalon and in the holaspid trunk of A. koninckii. We find that they did, that they were quantitatively different from those that characterized the meraspid trunk, but that they could have shared with the latter a common mechanism of growth control.
Materials and Methods
Data Set
Our work is based on a data set of morphometric measurements on 352 specimens, from early meraspid (degree 4= stage s4) to late holaspid (Hong et al. Reference Hong, Hughes and Sheets2014). These were collected from multiple bedding planes within 1.2 m of middle Silurian (Homerian) mudstone at the Na Černidlech locality in the Czech Republic (Hughes et al. Reference Hughes, Kříž, Macquaker and Huff2014). Measured specimens were articulated exoskeletons with minimal evidence of postmortem distortion selected from more than 10,000 juvenile and adult articulated specimens inspected. The fossils were coated with ammonium chloride sublimate and photographed with a Nikon D100 digital camera and macrolens, through a Nikon SMZ-U stereomicroscope with a Nikon CoolPix995 digital camera, or with a Leica MZ16 stereomicroscope with a Leica DFC420 digital camera. The resulting images were digitized using the ImageJ software package (Abràmoff et al. Reference Abràmoff, Magalhães and Ram2004) with the x- and y-coordinates recorded for each of a series of marker points on each specimen. A scale in half-millimeter divisions was included in each image.
Details of the data set and measurements are given in Hong et al. (Reference Hong, Hughes and Sheets2014). Meraspid specimens are the same analyzed in Fusco et al. (Reference Fusco, Hong and Hughes2014), to which we will frequently refer. Conversely, this data set differs from that used in Fusco et al. (Reference Fusco, Hughes, Webster and Minelli2004) (for comparisons between the two, see Hong et al. Reference Hong, Hughes and Sheets2014).
Basic Features of the Morphometric Analysis
This study is based on two types of morphometric data that require different processing: cross-sectional and mixed cross-sectional data (Cock Reference Cock1966). Cross-sectional data are those for which assignment of a given specimen to a certain developmental stage is done on the basis of a criterion independent of size. This applies to meraspid specimens up to stage s17 (n=148, meraspid data set), for which stage assignment was made on the basis of the number of thoracic segments. Mixed cross-sectional data are those for which a size-independent criterion of stage assignment is not available. This applies to all specimens with 18–22 thoracic segments, that is, meraspids from stages s18–s21 and holaspids (n=204, holaspid data set). The option for excluding all the morphs m18–m21 below a certain body size from the analyses, to obtain an exclusively holaspid data set, would have resulted in leaving out a significant fraction of early-stage holaspids, producing a bias (of decreasing magnitude from morphotype t18 to t21) toward late holaspid stages. We opted not to exclude any specimen meeting the preservational criteria (Hong et al. Reference Hong, Hughes and Sheets2014) and, for simplicity, the label “ holaspid” is thus applied to the data set of all specimens with 18–22 thoracic segments throughout the text.
Morphometric Characters
Thirty morphometric characters were extracted from landmark data (Fig. 1). One, the cephalic centroid size (CCS, based on 15 cephalic landmarks), is a standard geometric morphometric measure used as a main reference in most allometric analyses. The others are linear distance measures along the main body axis. The cephalic main axis was measured in three sections: frontal area length (FAL, from the anterior margin of the cephalon to the anterior margin of the glabella), preoccipital glabellar length (PGL, from the anterior margin of the glabella to the anterior margin of the occipital ring), and occipital ring length (ORL, from the anterior margin of the occipital ring to the posterior margin of the cephalon). Glabellar length (GLL) corresponds to PGL+ORL and cephalic length (CEL) corresponds to FAL+GLL. The whole trunk length (TRL) was partitioned into thoracic segments (TS1–TS22), the actual number depending on the developmental stage and morphotype) and pygidial length (PYL). For more precise measurement, TS landmarks were positioned by drawing a line along the sagittal axis on the image of each specimen, then drawing a transverse line connecting the articulating processes at the fulcra of the two sides for each segment, and finally placing the landmarks at the intersections of these lines. As consequence of this choice, the trunk anterior boundary is defined paraxially, such that it does not coincide exactly with the medial posterior boundary of the cephalon (the posterior end of the occipital ring) but lies slightly anterior to it (overlap is on the order of 2% of TRL). This does not affect the analyses carried out here, but it should be noted that CEL and TRL do not sum to body length.
Growth-Gradient Detection
Growth gradients can appear either as (1) differentials in per-stage growth rates (absolute growth; Minelli and Fusco Reference Minelli and Fusco2013) among serially arranged body parts (e.g., segments) for cross-sectional meraspid data, or (2) as differentials in allometric coefficients (relative growth; Minelli and Fusco Reference Minelli and Fusco2013) among serially arranged body parts with respect to a more inclusive body region or a different body region (e.g., thoracic segments with respect to the trunk, or with respect to the cephalon) for both cross-sectional meraspid data and mixed cross-sectional holaspid data.
The average per-stage (per-molt) meraspid growth rate for a given body part (Y) was calculated as the antilogarithm of the arithmetic mean of the size increments from one stage to the next, after natural logarithmic transformation of Y measures (Fusco et al. Reference Fusco, Garland, Hunt and Hughes2012). Average meraspid growth rates were computed on the 137 meraspid specimens in the ontogenetic interval s9–s17, as meraspid stages s4–s8 are too poorly represented in the data set (11 specimens only) to provide sufficiently accurate stage-specific size estimates (see Fusco et al. Reference Fusco, Hong and Hughes2014).
The ontogenetic allometric coefficient for a given body part (Y) with respect to another body part (X) was calculated as the reduced major axis (RMA) linear regression slope of Y versus X, after natural logarithmic transformation of both variables. For meraspid ontogeny, allometric coefficients were computed on the 148 specimens in the ontogenetic interval s4–s17, and for holaspid ontogeny, on the remaining 204 specimens with 18–22 thoracic segments (the complete holaspid data set), or on the n specimens of a particular morph of interest (e.g., for morph m18, n=19).
Growth Progressions
A growth progression is a representation of the size variation of a given body part across ontogeny. Cross-sectional meraspid data allow straightforward developmental stage–based representation, but this is not possible for mixed cross-sectional holaspid data. However, to show the growth progressions during both meraspid and holaspid periods in the same graph, we adopted a convenient rescaling of the allometric coefficients (with respect to CCS) among holaspids to attain a proxy of meraspid developmental periodization, that is, the succession of stages. Assuming CCS had a constant per-stage growth rate (i.e., that it conforms to Dyar’s rule; Minelli and Fusco Reference Minelli and Fusco2013) throughout ontogeny, ln(CCS) per-stage growth parameters were estimated by ordinary least-squares (OLS) linear regression of ln(CCS) versus stage in the ontogenetic interval s9–s17. The stage of a given holaspid specimen (morph>m17) is therefore a rescaled measure of its ln(CCS) on the basis of ln(CCS) per-stage growth parameters (Supplementary Appendix A), and as such can take noninteger values. The growth progressions thus obtained may be nonexact in terms of absolute per-stage growth rates (being based on the nontestable assumption of a constant per-stage growth rate of CCS), but they do correctly reproduce the observed body proportions (with respect to CCS) throughout the whole holaspid ontogeny.
Growth-Gradient Modeling
Axial growth gradients in the meraspid cephalon and in the holaspid cephalon and trunk cannot be rigorously tested for alternative models of growth dynamics. For the meraspid cephalon only two axial landmarks are available between the extremities of the cephalon (the posterior margin of the frontal area and the posterior margin of the preoccipital glabella), and this results in considerable statistical uncertainty about the growth-gradient parameters. For the holaspid cephalon and trunk, the mixed cross-sectional nature of the holaspid data does not allow exact specimen staging.
Despite the fact that these three gradients cannot be statistically compared with the continuous steady growth gradient found for the meraspid trunk (Fusco et al. Reference Fusco, Hong and Hughes2014), their decaying shapes (see “Results”) are nonetheless compatible with gradients of the meraspid trunk type. Accordingly, we carried out an exploratory comparison among the shapes of the four gradients by assuming that all were the result of a similar growth dynamic to that detected in the meraspid trunk, that is, a continuous steady growth gradient based on positional specification.
For the meraspid cephalon (cross-sectional data) we used the same fitting procedure of Fusco et al. (Reference Fusco, Hong and Hughes2014). We carried out a nonlinear least-squares regression fitting of the relative position (with respect to CEL) of the posterior boundary of the first two cephalic sections (FAL and PGL) in two successive stages across meraspid stages s9–s17 (n=16). The model expTG in Fusco et al. (Reference Fusco, Hong and Hughes2014) was a two-parameter exponential decaying function defined in the close interval [0,1], representing the local per-stage growth rate at any relative position along the main cephalic axis (with 0 corresponding the cephalon posterior end). Details on the function and the fitting procedure are given in Supplementary Appendix B.
For the holaspid cephalon and trunk (mixed cross-sectional data) we adopted a different, more approximate procedure. We carried out a nonlinear least-squares regression fitting of average per-stage growth rates of different sections of the region (either cephalic sections or trunk segments) versus their average relative position within the region (n=2 for the cephalon, n=16 for the trunk). The model is the same two-parameter exponential decaying function used for the other gradients. Details of the functions and the fitting procedure are given in Supplementary Appendix C.
Computations
All calculations and statistical testing were carried out with the statistical package Statgraphics Centurion, Version XVI and the spreadsheet software Microsoft Excel 2010. Standard errors of all statistics are shown as ±SE.
Results
Cephalic Axial Growth
Cephalic Meraspid Growth Gradient
There was an axial growth gradient in the cephalon during the meraspid period (Fig. 2), as the average per-stage growth rates of the three sections of the cephalon (FAL, PGL, and ORL) in the ontogenetic interval s9–s17 exhibited significantly declining values from anterior to posterior (Spearman rank correlation test, r =1, p<0.0001, n=3). The growth gradient had an opposite polarity to that detected in the trunk, with more modest growth rate differentials (Fusco et al. Reference Fusco, Hong and Hughes2014: Fig. 2b).
Axial growth gradient (per-stage growth rates) in the meraspid cephalon. FAL, frontal area length; PGL, preoccipital glabellar length; ORL, occipital ring length. Stages s9–s17 (n=9). Bars are SEs.

Cephalic Growth Gradient across the Meraspid/Holaspid Boundary
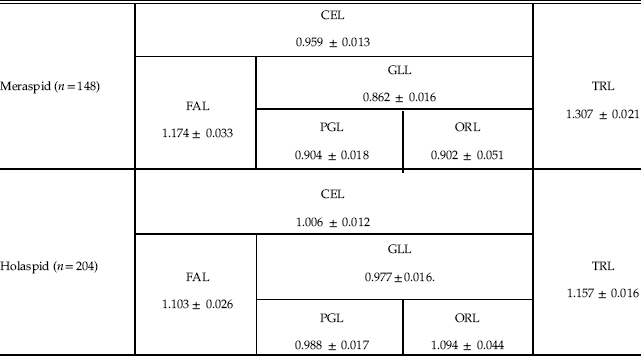
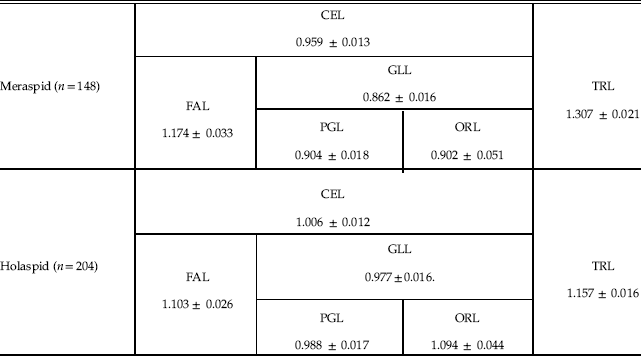
For the three cephalic sections, FAL, PGL, and ORL, we obtained the following allometric coefficients with respect to CCS for holaspids (RMA regressions coefficients): 1.103, 0.988, and 1.094, respectively (Table 1). The meraspid gradient apparently vanishes, but this actually depends on the modest differences in the allometric coefficients with respect to the statistical error, in particular for ORL (the occipital ring is a tiny portion of the whole cephalon, and ORL measurement is thus proportionally challenging). In fact, considering only two sections of the cephalon, by conjoining PGL and ORL into what is actually GLL, we obtained an allometric coefficient that is slightly but significantly smaller than that of FAL (one-tailed Student’s t-test, n=204, p<0.001) (Table 1), evincing persistence of an axial gradient during the holaspid period with the same orientation as in the meraspid period. However, holaspid growth differentials were significantly attenuated with respect to those of the meraspid period, as the meraspid allometric coefficient of FAL was significantly larger than the corresponding holaspid value (one-tailed Student’s t-test, n m=148, n h=204, p<0.043), and the meraspid allometric coefficient of GLL was significantly smaller than the corresponding holaspid value (one-tailed Student’s t-test, n m=148, n h=204, p<0.001) (Fig. 3, Table 1).
Axial growth gradients (allometric coefficients with respect to CCS) in the cephalon during meraspid (black diamonds, n=148,) and holaspid (gray dots, n=204) periods. FAL, frontal area length; GLL, glabellar length. Bars are SEs.

Allometric coefficients of different axial sections of the body with respect to CCS for meraspid and holaspid periods (RMA regressions coefficients ± SE).
Trunk Axial Growth
Trunk Growth Gradient across the Meraspid/Holaspid Boundary
Fusco et al. (Reference Fusco, Hong and Hughes2014) found a growth gradient in the trunk of A. koninckii during the meraspid period. Allometric analysis shows that a similar gradient persisted during the holaspid period, although with different characteristics than those pertaining in the juvenile stage (Fig. 4). In particular, differentials in thoracic segment allometric coefficients with respect to TRL were attenuated, but thoracic segments anterior to TS9 grew faster during the holaspid period than in the meraspid period, while segments posterior to it grew more slowly during the holaspid period than in the meraspid period. Also, isometric growth with respect to TRL moved from being close to TS10 in meraspids to TS14 in holaspids. The asymmetric distribution of allometric coefficients among the thoracic segments produced an ontogenetic change in the profile of segment lengths during the holaspid period, although a less marked change than that during the meraspid period, which resulted in a posterior shift of the segmental position of the longest segment, from TS6 at meraspid stage s17, to about TS9 among late holaspids.
Observed trunk growth gradients (allometric coefficients with respect to TRL) of thoracic segments during meraspid (black diamonds) and holaspid (gray dots) periods. Bars are SEs. Meraspid, n=148 for TS1–TS4; n=147, 145, 141, 140, 137, 129, 117, 101, 86, 69, 48, and 29 for TS5–TS16, respectively. Meraspid ontogenetic allometry for TS17 cannot be calculated, as all data refer to a single developmental stage (s17). Holaspid, n=204 for TS1–18; n=185, 102, 52, and 12 for TS19–TS22, respectively.

This change in growth rate distribution within the thorax during the holaspid period extended to the pygidium. Although at the onset of the holaspid period the pygidium started growing at a faster rate than during the meraspid period (an expected consequence of the cessation of segment release into the thorax), the observed rate of growth is lower than that expected if meraspid growth parameters were maintained (see “Pygidium Growth Progression”).
Trunk Growth Progression
The relative growth rate of TRL with respect to CCS declined slightly but significantly at passage into the holaspid period, as the allometric coefficient changed from 1.307 to 1.157 (one-tailed Student’s t-test, n m=148, n h=204, p<0.001) (Fig. 5, Table 1). However, during the holaspid period the TRL allometric coefficient remained larger than the CEL allometric coefficient (one-tailed Student’s t-test, n=204, p<0.001), such that the trunk’s relative length with respect to the whole-body length increased until the end of the animal’s life.
Trunk length (TRL) progression throughout meraspid (black diamonds, thick line, n=148) and holaspid (gray and open symbols, thin lines, n=204) periods. For holaspid data, the specific progressions of morph m18 (gray triangles, lower thin line, n=19) and morph m22 (gray diamonds, upper thin line, n=12) are shown. Regression lines are from OLS regression for meraspid data and RMA regression for holaspid data. Holaspid data have stage assignment based on CCS (see text).

As specimens of the different holaspid morphotypes entered the holaspid period at a different stage (from s18 to s22), the expected TRL ontogenetic progression differed slightly between morphotypes, with those with more thoracic segments tending to have longer trunks as a consequence of a prolonged meraspid period that was characterized by higher trunk-growth rates (Fig. 5). Using the CCS-based staging, at stage s32 (where the calculated ln(CCS) reached the maximum values observed in the data set), the expected trunk length varies from 18.0 mm for morphotype t18 to 19.1 mm for morphotype t22.
Pygidium Growth Progression
The most conspicuous aspect of pygidial growth is that markedly different growth rates characterized the meraspid and holaspid periods. Per-stage average growth rate was practically zero during the meraspid period (nonsignificant OLS regression coefficient, two-tailed Student’s t-test, n= 9, p>0.09), but growth rate increased to 1.144 during the holaspid period (RMA regression with CCS-based staging, n=204) (Fig. 6, Table 2). This pattern resulted from the fact that during the meraspid period, the pygidium released its most anterior segments, one per stage, into the thorax, but this process stopped at the first holaspid stage. The pygidium was thus not a homologous unit in terms of segment identity across the whole ontogeny. During the meraspid period it continuously changed its segmental composition and stabilized segmentally only at the onset of the holaspid period.
Pygidial length (PYL) progression across in meraspid (black diamonds, n=148) and holaspid (gray and open symbols, n=204) periods. For holaspid data the specific progressions of morph m18 (open triangles, upper line, n=19) and morph m22 (open diamonds, lower line, n=12) are shown. Regression lines are from OLS regression for meraspid data and RMA regression for holaspid data. Holaspid data have stage assignment based on CCS (see text). Dashed line is the expected PYL progression for a hypothetical average morphotype t20 specimen if the meraspid trunk growth gradient was maintained during the holaspid period (Supplementary Appendix D).

Per-stage average growth rates of TRL and PYL for meraspid period (OLS regressions coefficients ± SE) and holaspid period (RMA regressions coefficients ± SE, CCS-based staging, see text).

Because the different morphotypes entered the holaspid period at different stages, from s18 to s22, the expected PYL ontogenetic progression differs slightly between the morphotypes, with morphotypes with fewer thoracic segments tending to have longer pygidia because they achieved the holaspid period at an earlier stage, and thus transitioned into the higher PYL growth rate before those with more segments (Fig. 6).
The holapsid PYL per-stage average growth rate was higher than TRL growth rate (RMA regressions, one-tailed Student’s t-test, n=204, p<0.001) (Table 2) so that pygidium relative length increased with respect to TRL until the end of the animal’s life. However, the observed per-stage average growth rate of the holaspid PYL is much lower than that expected had it maintained meraspid growth-gradient parameters (Fig. 6, Supplementary Appendix D). Hence, for stage s32 the expected PYL trunk proportion would be about 35% based on maintained meraspid growth rates, while the observed PYL proportion for the largest specimens is around 16%. This is consistent with the significant flattening of the trunk growth gradient inferred on the basis of thoracic segment growth data (Fig. 4).
Overall Axial Growth Dynamics
Meraspid Cephalon
The fitted growth gradient across meraspid stages s9–s17 (n=16) is visibly flatter than that in the trunk, reaching a local per-stage growth rate at the anterior end of the cephalon of 1.117 ± 0.001 (Fig. 7, Supplementary Appendix B). Notably, the estimated local value of growth rate at the posterior boundary of the cephalon is higher than the growth rate observed at the anterior boundary of the trunk (1.072 ± 0.021 vs. 1.059 ± 0.001) and equates to a value that is observed at about the midtrunk. Although the difference is not significant (Student’s t-test, n m=16, n h=100, p>0.05), apparently because of the high statistical uncertainty about the cephalon growth-gradient parameters, the equivalence of the two gradient terminal values is not significant either (equivalence test on the confidence interval of the difference, p>0.05). This observation thus does not provide significant support for a hypothesis that the cephalic and trunk gradients were part of a single, bipolar growth gradient throughout the whole body axis.
Cephalon and trunk growth gradients modeled as continuous functions of the relative position within each body region. Black lines indicate meraspid gradients; gray lines indicate holaspid gradients. The meraspid trunk gradient is from Fusco et al. (Reference Fusco, Hong and Hughes2014). For the other three curves, see text. The area under each curve (the integral of the gradient function in the closed interval [0,1]) equals the average per-stage growth rate of the length of the corresponding region (cephalon or trunk) in the ontogenetic period (meraspid or holaspid). The specific absolute length of the two body regions here is that of a young morph m19, but the curves do not vary among morphotypes or stages. (See Supplementary Appendixes B and C.)

Holaspid Cephalon and Trunk
The holaspid cephalic growth gradient was flatter than the corresponding gradient during the meraspid period, and flatter than the trunk gradient during the same holaspid period (Fig. 7). Here also, as for the meraspid/holaspid transition in the trunk (Fig. 4), the flattening of the gradient was obtained both through a deceleration of the fastest-growing parts during the meraspid period (in this case, the anterior cephalon) and through an acceleration of the slowest-growing parts during the meraspid period (in this case, the posterior cephalon). Similarly, the holaspid trunk growth gradient was flatter than the corresponding gradient during the meraspid period, with balanced adjustment of growth rates similar to that observed in the cephalon, as expected from the observed trunk-growth patterns (Fig. 4). Interestingly, in contrast to the two cephalic and trunk meraspid growth gradients, which apparently do not match at the cephalic/trunk boundary, the holaspid growth gradients of the two regions do seem to coincide at the boundary.
Discussion
Our results show that the axial growth gradient governing meraspid trunk development in A. koninckii (Fusco et al. Reference Fusco, Hong and Hughes2014) was complemented by growth gradients expressed during holaspid trunk growth and during the meraspid and holaspid growth of the cephalon. The meraspid cephalic axial growth gradient was notably flatter than that of the meraspid trunk and had the opposite polarity, with fastest growth occurring toward the anterior of the cephalon rather than near the posterior, as in the trunk. Both gradients persisted during the holaspid period, although they flattened with respect to the meraspid period through a balancing adjustment of growth rates toward both the respective extremities (Fig. 7).
Overall, the observed growth patterns in the cephalon and in the holaspid trunk are compatible with the mechanism of growth control observed in the meraspid trunk (Fusco et al. Reference Fusco, Hong and Hughes2014). Thus, the same type of growth control, based on positional specification, may possibly have operated in the two main body regions and during the whole of postembryonic ontogeny of A. koninckii. However, statistical uncertainty about the local growth rates at the posterior end of the cephalon and at the anterior end of the trunk did not permit us to test whether cephalic and trunk gradients could be combined with confidence into a single bipolar growth gradient throughout the whole body axis. Nevertheless, the cephalic/trunk boundary was apparently a significant limit for axial growth processes, either as the border between distinct cephalic and trunk gradients or as the inflection point in a bipolar gradient.
The meraspid/holaspid transition is defined by the cessation of new trunk segment articulation that, in this synarthromeric species, occurred as the last new trunk segment appeared. Because these two transitions occurred in the same stage, we cannot determine to which the changes in growth gradients may have been more strictly linked. Indeed, marked changes in the growth patterns between meraspid and holaspid A. koninckii need not imply that this was accomplished across one stage. Data close to this border simply do not permit sufficiently high-resolution analyses to resolve this because of uncertainty in pinpointing the onset of the holaspid phase due to variation in the number of holaspid thoracic segments in this species. Nevertheless, our results do suggest that transition in the development of particular trunk segments likely corresponded to a change in how growth was controlled regionally, not only throughout the trunk, but also in the cephalon. Resolving whether the change in growth gradient was linked principally with the onset of the holaspid period or the onset of epimorphosis will require identifying similar growth-gradient transitions in protarthrous (holaspid phase that preceded onset of the epimorphic phase) and protomeric (epimorphic phase that preceded onset of the holaspid phase; Hughes et al. Reference Hughes, Minelli and Fusco2006) species with invariant numbers of holaspid thoracic segments.
In extant arthropods with anamorphic development, the new segments appear sequentially in an antero-posterior progression from a subterminal trunk region, often referred to as the generative zone (Fusco Reference Fusco2005; Minelli and Fusco Reference Minelli and Fusco2013), but information about morphogenesis and gene expression associated with anamorphosis is scarce (e.g., Bortolin et al. Reference Bortolin, Benna and Fusco2011), as are quantitative morphometric studies of growth across the anamorphic/epimorphic boundary (e.g., Iatrou and Stamou Reference Iatrou and Stamou1988). From the point of view of axial growth, the fact that the same meraspid growth gradient spanned the whole trunk in A. koninckii (Fusco et al. Reference Fusco, Hong and Hughes2014) suggests that the generative zone was not actually a zone of special growth (proliferative zone), but just an area posterior to the last specified pygidial segment where new segmental boundaries were specified at each anamorphic stage. Moreover, as has been shown here, a trunk gradient with higher growth rates toward the posterior of the pygidium persisted even after the cessation of the anamorphic phase. This suggests that the function of the generative zone was more that of a “segment organizer,” as has been argued for extant anamorphic myriapods (Fusco Reference Fusco2005), rather than that of a “segment generator.” Accordingly, the axial growth differential between the cephalon and trunk cannot be attributed to trunk segmental addition, since the differential persisted in the epimorphic phase of A. koninckii, as has also been observed in the epimorphic phase of the hemianamorphic centipede Lithobius (Andersson Reference Andersson1976).
This issue of the posterior-most body division again highlights the peculiar nature of the trilobite pygidium, which is a structure explicitly defined by the state of segment articulation (Hughes et al. Reference Hughes, Minelli and Fusco2006). The continuous change in its segmental composition during the meraspid period of all trilobites, and also in the early holaspid period of those trilobites with protarthrous and protomeric development, encouraged Minelli et al. (Reference Minelli, Fusco and Hughes2003) to question whether the pygidium was a “real” tagma. This argument, based on a stringent definition of tagma (see Fusco and Minelli Reference Fusco and Minelli2013), finds further support in trilobites like A. koninckii that had a homonomous segmental pattern, with all trunk segments sharing similar basic form regardless of their allocation to the pygidium or thorax and with thoracic and pygidial segments alike experiencing the same trunk-wide growth gradient. However, in other derived trilobites the set of segments that comprises the holaspid pygidium does become notably distinct from the set defining the holaspid thorax (Hughes Reference Hughes2007). In such cases, a stronger argument can be made for viewing the holaspid pygidium as a morphologically, and also likely functionally, distinct tagma. Quantitative studies of trunk ontogeny in forms with distinct batches of segments will throw important light on how segmental growth differed between batches and the relationship of this growth to other characteristics, such as the development of articulation.
Limited attention has been paid to the relative sizes of segments in the trilobite body, other than from a systematic perspective. Several authors have noted taxa in which the position of the longest trunk segment in fully grown individuals lay within the trunk and not at its anterior margin, with striking examples among odontopleurid trilobites. These quite commonly located their longest segment toward the rear of the holaspid thorax (e.g., Acanthalomina minuta and various species of Leonaspis; Ramsköld Reference Ramsköld1991; Ramsköld and Chatterton Reference Ramsköld and Chatterton1991) or, equally remarkably, showed all adult thoracic segments to be of similar length, as in species of Exallaspis (Ramsköld and Chatterton Reference Ramsköld and Chatterton1991). Similar patterns are seen in members of other derived clades, such as lichids, encrinurids, and scutelluids, but are rare among Cambrian polymerid trilobites, in which the longest adult trunk segment was usually the first (e.g., Bergström and Levi-Setti Reference Bergström and Levi-Setti1978; Hou et al. Reference Hou, Hughes, Lan, Yang and Zhang2015; Webster Reference Webster2015). While these differences are intriguing, they are static descriptions in the sense that they are based on holaspid form only, but A. koninckii shows that size distribution of trunk segments can be the result of growth dynamics controlled at the level of a more inclusive growth field. What is now required is a series of comparable studies of other well-preserved, articulated trilobite species spanning the phylogenetic and ecological history of the group in order to dissect what patterns are general to the clade as a whole and to seek explanations for any exceptions observed. Fortunately, several species with extended postembryonic articulated ontogenies are beginning to become available, many of which are Cambrian in age (e.g., Hou et al. Reference Hou, Hughes, Lan, Yang and Zhang2015).
Aulacopleura koninckii is one of the most intensely studied trilobite species, and the discoveries from these analyses might make it tempting to consider the species as a “model system” for trilobite development. However, while some of the insights gained from A. koninckii could illuminate patterns general to the clade, and possibly also to early Euarthropoda, this is just one species out of more than 20,000 described, in a group that showed wide morphological and habitat variation throughout their collective almost 300 Myr history. Only expanded taxon sampling can assess the generality, or otherwise, of our specific findings in A. koninckii. Nevertheless, this study, along with others on the same species that preceded it, shows that through morphometric analysis of appropriate data sets, it is possible to address questions of high interest for evolutionary developmental biology using data from fossils.
By extending this kind of study to other species, we can begin to address the questions anticipated in the “Introduction.” For instance, establishing whether some kinds of regional growth control, similar to those documented herein, operated generally among trilobites is a testable hypothesis that can provide a basis for exploring how variations in segmentation and segmental patterning evolved in these animals. Information on the size and shape of body patterns at ancient nodes of the arthropod tree, along with complementary information on the developmental processes generating those patterns, is crucial to these investigations, because it is the evolutionary change at the level of these particular processes that underlies the diversity of body architectures seen in subsequent evolutionary time. Seated at the interface between developmental research on living and fossilized animals, these studies can help elucidate both how developmental processes evolved and how they themselves affected the evolution of organismal body patterning.
Acknowledgments
This work was funded by NSF EAR-0616574 to N.C.H. and Basic Research Project (GP2015-005) of KIGAM to P.S.H. We are grateful to two referees for their helpful advice during the review process.
Supplementary Material
Supplemental material deposited at Dryad: doi:10.5061/dryad.6069g