I. INTRODUCTION
Valve steel is an important part of heat-resistant steels. It is mainly applied for intake and exhaust valves of combustion engines. Reference Qin1 Valves are among the most important components of engines and regulate both the intake of air for the combustion process and the discharge of the exhaust gases generated in the combustion chamber. Usually, intake valves and exhaust valves are made of martensitic and austenitic steels, respectively. Reference Atapour and Ashrafizadeh2 Valves are complexly loaded structural parts in combustion engines and subjected to high temperature, high pressure, thermal shocks, friction with valve base, and severe high-temperature corrosion condition all the time. Reference Berns, Escher and Streich3,Reference Grzesik, Smola, Adamaszek, Jurasz and Mrowec4 Furthermore, exhaust valves are the ones most likely to burn because they run hotter than the intake ones which makes them much more vulnerable to erosion and burning than the intakes. Reference Ramalho, Kapsa, Bouvard, Abry, Yoshida and Charpentier5 Taking Otto and Diesel engines as an example, the operation temperature can reach 550 °C and 700–800 °C, even 900 °C under some more severe conditions in the intake and exhaust valves during service time. Furthermore, the gases and fuel vapors cause the operational environment to be extremely oxidant, which makes the valves expose to a severe high-temperature corrosion condition. Reference Voorwald, Coisse and Cioffi6 Consequently, valve steels should characterize with good high-temperature stability, wear resistance, fatigue strength, and oxidation/corrosion resistance at elevated temperatures. Reference Azadi, Roozban and Mafi7,Reference Hu, Xu, Gan, Guo and Huang8 X45CrSi93 as martensitic valve steel investigated in this study exhibits excellent hardening capacity, high-temperature stability, oxidation/corrosion resistance. Reference Qin1 X45CrSi93 valve steel is mainly used for intake valves in internal combustion engines.
The hot deformation behavior of metals and alloys is important to designers for metal-forming processes (hot rolling and forging) because of its effective role on metal flow pattern as well as the kinetics of metallurgical transition. Reference Lin, Chen and Zhong9 Many researchers have investigated the hot deformation behaviors of different kinds of metallic materials. Zheng et al. established the constitutive equation of 5Cr21Mn9Ni4N valve steel by compression tests in the deformation temperature range of 800–1100 °C and strain rate range of 0.005–1.0 s−1. Reference Zheng, Zhang, Song and Mo10 Momeni and Dehghani studied the hot deformation behavior of 410 martensitic stainless steel and obtained its constitutive equation and processing map. Reference Momeni and Dehghani11 Lin et al. investigated the influence of temperature and strain rate on the compressive deformation behavior of 42CrMo steel to perform numerical simulation of forging and obtained processing parameters of hot deformation. Reference Lin, Chen and Zhong9 Han et al. and Farnoush et al. studied the hot deformation behaviors of 2304 and 2205 duplex stainless steels under varying process conditions of deformation temperature and strain rate, respectively. Reference Han, Zou, Chen, Fan and Zhang12,Reference Farnoush, Momeni, Dehghani, Mohandesi and Keshmiri13 Cai et al. established the constitutive equation and processing map of a Ni-base superalloy by using the hot compression tests over the deformation temperature range from 1000 to 1200 °C and strain rate range from 0.001 to 1.0 s−1. Reference Cai, Xiong, Liu, Sun and Yao14 In spite of different kinds of alloys, all research studies arrived at the same conclusion that the flow stress decreases with the increasing temperature.
In this study, a systematic study of hot deformation behavior under varying hot working conditions for X45CrSi93 valve steel was conducted and the abnormal variation mechanisms of flow stress for X45CrSi93 were investigated by metallographic observation, phase diagram calculation, and phase analyses to optimize for rolling process design and microstructure control of X45CrSi93 bar product.
II. EXPERIMENTAL DETAILS
A. Materials
The average chemical composition of X45CrSi93 as-rolled bar product with a diameter of 18 mm for this investigation is 0.41C, 9.25Cr, 2.24 Si, 0.28 Mn, 0.08 Ni, and balance Fe (wt%) analyzed by AA-6300 atomic absorption spectrophotometer (Shimadzu Corporation, Japan) and EMIA-820V C-S analyzer (The HORIBA Group, Japan).
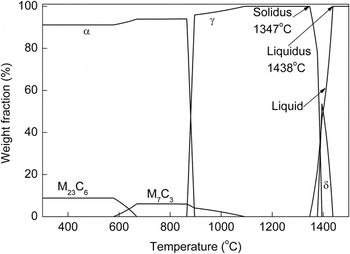
Figure 1 shows the phase diagram of X45CrSi93 under equilibrium condition calculated by Thermo-Calc and it presents all predicted equilibrium phases and their weight fractions in the whole temperature range. The calculated liquidus and solidus temperatures for the tested alloy are 1438 and 1347 °C, respectively. The δ-ferrite, austenite, and α-ferrite are predicted to exist in the temperature range of 1438–1377 °C, 1395–865 °C, and below 896 °C, respectively. The austenite and α-ferrite coexist at temperatures between 865 and 896 °C, and their weight fractions change with temperature. In other words, the calculated equilibrium phase transition temperatures of Ae1 and Ae3 are 865 and 896 °C, respectively. Except the matrix phases, the carbides of M7C3 and M23C6 are predicted to exist in the tested alloy as well. The M7C3 carbide forms within the temperature range from 1092 to 578 °C and its weight fraction reaches maximum of 6.1% at temperatures between 840 and 671 °C. The M23C6 carbide begins to precipitate at 699 °C and reaches maximum weight fraction of 8.8% below 578 °C.
Phase diagram of X45CrSi93 calculated by Thermo-Calc.

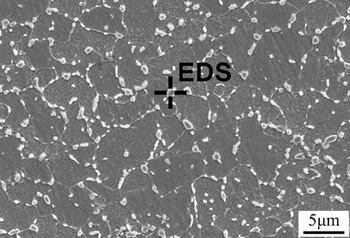
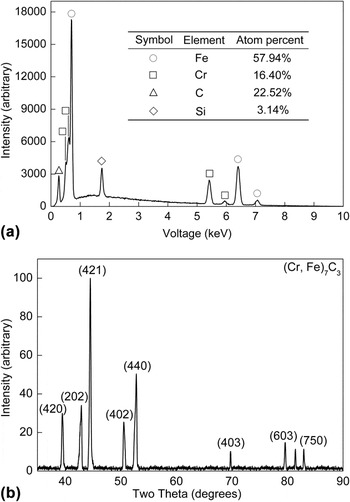
Scanning electron microscope (SEM) morphology of the as-rolled specimen is shown in Fig. 2. The microstructure consists of dark colored matrix and granular precipitates distributed at the grain boundaries evenly. To determine the granular precipitates, EDS and x-ray diffraction (XRD) analyses were conducted. From EDS analysis, the granular precipitates are probably carbides containing Fe and Cr as shown in Fig. 3(a) (the analysis zone of EDS is shown in Fig. 2). Further, XRD result shows the precipitates, electro-extracted from the solution of HCl and CH3OH, to be (Cr, Fe)7C3 as shown in Fig. 3(b). M23C6 carbide does not appear in X45CrSi93 unlike the result calculated by Thermo-Calc. This is because the thermodynamic calculation by Thermo-Calc is under equilibrium condition while M23C6 is difficult to precipitate due to the inadequate dynamic condition in real situation.
SEM morphology of the as-rolled specimen of X45CrSi93.

(a) EDS and (b) XRD pattern of the precipitates in the as-rolled specimen of X45CrSi93.

B. Experiment
To study the effects of temperature and strain rate during the hot compressive tests, cylindrical specimens with the diameter of 8 mm and the height of 12 mm were scalped with their cylinder axes parallel to the axial of the as-rolled bar. Compressive tests were conducted on a Gleeble-1500 thermomechanical simulator (Data Science International, USA) over the temperature range from 850 to 1100 °C at 50 °C intervals as well as the strain rates of 1, 5, 10, and 20 s−1 with reduction of 50%. All the specimens were heated with a rate of 10 °C/s to the deformation temperatures and held for about 5 min before deformation. As soon as the compressive tests completed, the specimens were water quenched so that the microstructure at high temperature can be retained. The time between unloading and quenching samples was about 0.5 s. Meanwhile, to analyze the plasticity of this steel and then provide advice for industrial production, tensile tests were carried out on the same hot working simulator with the tensile specimens (Φ10 × 120 mm) at temperatures of 800, 900, 1000, 1100, and 1200 °C under the strain rate of 0.01 s−1. Similarly, the specimens were water quenched immediately after the fracture of the specimens.
The solution treatment for X45CrSi93 was carried out in the temperature range from 850 to 1100 °C at 50 °C intervals. All the specimens were held for about 5 min at different temperatures and then water quenched.
All the deformed specimens that were cut parallel to the deformation axis and solution specimens were prepared for further microstructure analyses. The microstructure analyses were studied by means of JSM-6510 SEM (Japan Electron Optics Laboratory Co. Ltd., Japan) after being etched in a solution of 2.5 g CuSO4·5H2O, 15 mL HCl, and 35 mL H2O for 5–10 s. The phase characterization was analyzed using the DMAX-RB X-ray diffractometer (Rigaku Corporation, Japan). The critical temperatures of phase transition were determined by thermal expansion tests and the quantitative analysis of certain elements was conducted using JXA-8230 electron probe micro-analyzer (EPMA; Japan Electron Optics Laboratory Co. Ltd., Japan).
III. RESULTS AND DISCUSSION
A. Hot deformation behavior
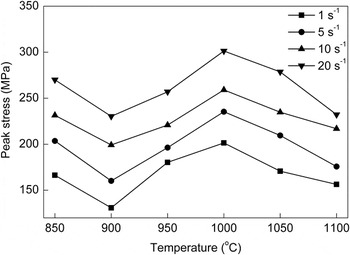
Figure 4 shows the peak stress changing with deformation temperature at different strain rates obtained from compressive deformation tests. It is clearly shown that the flow stress exhibits abnormal variation at elevated temperatures. The peak stress decreases with the increasing deformation temperature between 850 and 900 °C as well as above 1000 °C. However, the flow stress rises anomalously with increasing temperature between 900 and 1000 °C at the same strain rate.
Effect of deformation temperature on the peak stress at different strain rates.

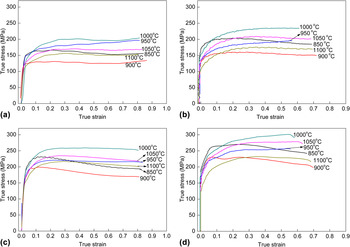
Figure 5 summarizes the true stress–true strain curves of compressive deformation at different deformation conditions. Apparently, the points on curves at 1000 °C are higher than others and the points on curves at 900 °C are the lowest at the same strain rate, respectively. Simultaneously, the types of true stress–true strain curves are different at different temperature ranges. Taking the curves at the strain rate of 5 s−1 as an example [Fig. 5(b)], the flow curves exhibit dynamic recovery type at the deformation temperatures of 850, 900, 1050, and 1100 °C. This type of flow curves reveals a rapid increase to the peak stress followed by a gradual fall or a steady state flow. However, when the deformation temperatures are 950 and 1000 °C, the flow curves indicate work hardening type and the stress rises continually with increasing strain.
True stress–true strain curves of hot compressive deformation at different temperatures and strain rates of (a) 1 s−1, (b) 5 s−1, (c) 10 s−1, and (d) 20 s−1.

In addition, it must be noted that the rising temperature during deformation at high strain rate should be taken into consideration. The deformation temperature change ΔT may be approximated by
 $$\Delta T = {{\left( {\eta \beta \int\limits_0^{\bar \varepsilon } {\bar \sigma d\bar \varepsilon } } \right)} \mathord{\left/ {\vphantom {{\left( {\eta \beta \int\limits_0^{\bar \varepsilon } {\bar \sigma d\bar \varepsilon } } \right)} {\rho c}}} \right. \kern-\nulldelimiterspace} {\rho c}}\quad ,$$
where η is the percentage of deformation work converted into heat (set η equal to 0.9); β is a factor which describes the degree of adiabaticity of the compressive test, when the strain rate is 20 s−1 the value of β is about 0.97–1.0; ρ and c are the density and specific heat of the tested materials, respectively;
 $\bar \sigma$
and
 $\bar \varepsilon$
are the effective stress and effective strain, respectively.
Reference Oh, Semiatin and Jonas15
As to the experiments in this study, the temperature change is not greater than 35 °C by integral computation when deformed at the strain rate of 20 s−1. However, compared to the experimental data recorded by Gleeble-1500 simulator, the real deformation temperature variation range is not greater than 10 °C because of the temperature automatic feedback system in the simulator. Therefore, the rising temperature during deformation could be ignored even at the strain rate of 20 s−1 for X45CrSi93 valve steel.
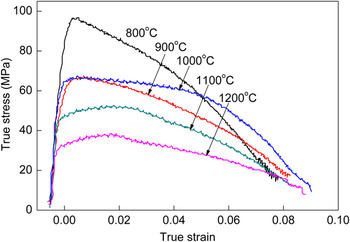
Figure 6 shows the true stress–true strain curves of hot tensile deformation at different deformation temperatures (800–1200 °C) under the strain rate of 0.01 s−1. As shown in Fig. 6, the characteristics of the flow curves pertaining to the temperatures below 1000 and beyond 1000 °C are different to a great extent. At the deformation temperatures of 800 and 900 °C, the flow curves reveal a rapid increase in the peak stress followed by a rapid fall, especially at 800 °C. However, when the deformation temperature is above 1000 °C, the flow curves exhibit a slow increase to the peak stress followed by a very slow fall, relatively.
True stress–true strain curves of hot tensile deformation at different temperatures at a strain rate of 0.01 s−1.

During the hot working process, the deformation caused dislocation multiplication which results in work hardening. While, the dynamic recovery caused by heat activation and dynamic recrystallization are the most important softening mechanisms at hot working. When the deformation temperature is low (800 and 900 °C), dynamic recovery is difficult to occur due to the weak action of heat activation. Therefore, the work hardening is notable and the stress increases rapidly. With the multiplication and accumulation of dislocation, recrystallization nucleation generates gradually and dynamic recrystallization occurs when the critical deformation reaches which results in the decrease of stress. When the deformation temperature is above 1000 °C, dynamic recovery can generate because of the enhancement of the atoms thermal motion and heat activation. In this case, the softening caused by dynamic recovery offsets part of work hardening which results in a slow increase to the peak stress on the flow curves.
Furthermore, the flow stress at 1000 °C is greater than that of 900 °C overall which exhibits abnormal variation. The tensile specimen deformed at 1000 °C exhibits double necking phenomenon as shown in Fig. 7. And the two positions of necking are symmetrical about the thermocouple in the middle of the tensile specimen. With the proceeding of tensile deformation, one of the necking stopped and remained the same until the end of tensile deformation while another developed continually till rupture.
The double necking specimen after tensile deformation at 1000 °C.

As a general rule, the deformation resistance of metallic materials decreases as the temperature increases because of the increasing atomic energy and thermal vibration amplitude with the rising temperature, then making dislocation motion, dislocation climb, and cross-slip easier. For that matter, the flow stress and deformation resistance decrease with the increasing temperature. In addition, the recovery and recrystallization can weaken work hardening more easily with increasing temperature which can contribute to reducing the flow stress and deformation resistance as well. Nevertheless, the relationship between flow stress and deformation temperature exhibits a complicated rule for X45CrSi93 in this study. This phenomenon will be analyzed further in the sections below.
B. Microstructure and phase analyses
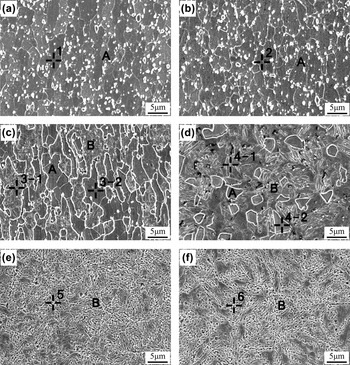
Figure 8 shows the microstructure of X45CrSi93 after compressive deformation within the temperature range from 850 to 1100 °C at a strain rate of 5 s−1. The matrix and carbide vary dramatically with deformation temperature. When the deformation temperature is lowered than 900 °C, only one phase (phase A) can be observed in the final microstructure [Figs. 8(a) and 8(b)] except the carbide precipitated at grain boundaries like the original microstructure. The microstructure is consisted of banded grains after compressive deformation. If the deformation temperature is between 950 and 1000 °C, the microstructure is composed of dual phases of A and B [Figs. 8(c) and 8(d)]. And the number of phase A decreases, while B increases with the rising temperature. When the deformation temperature is 950 °C, phases A and B are approximately equal. However, only a little phase A embedding in phase B remains after deformation at 1000 °C as shown in Fig. 8(d). When the specimen is deformed at higher temperature than 1050 °C, only phase B can be observed in the final microstructure [Figs. 8(e) and 8(f)]. In addition, the carbide begins to dissolve at about 950 °C and decrease with increasing deformation temperature.
SEM microstructure of X45CrSi93 after hot compressive deformation at different temperatures of (a) 850 °C, (b) 900 °C, (c) 950 °C, (d) 1000 °C, (e) 1050 °C, and (f) 1100 °C. The letters of A and B represent different phases. And the numbers represent the analysis zones of EPMA which will be used in Fig. 13.

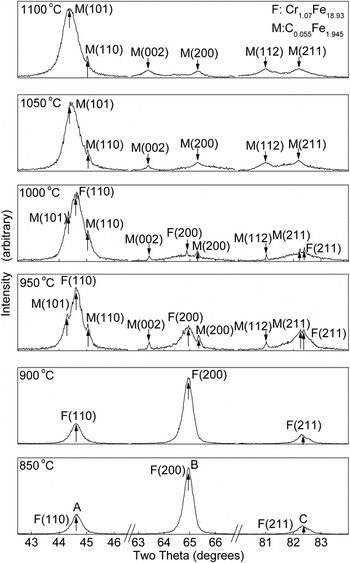
Further phase analyses were conducted using XRD to determine the types of phases A and B. Figure 9 shows the XRD patterns of X45CrSi93 after deformation at different temperatures. The XRD results show that the matrix is Cr-containing ferrite (Cr1.07Fe18.93) with body-centered cubic (BCC) structure after deformation at 850 and 900 °C. When the specimens were deformed at 950 and 1000 °C then water quenched, the matrix is consisted of Cr-containing ferrite and martensite (C0.055Fe1.945) with body-centered tetragonal structure. And the matrix changes to martensite completely after deformation at 1050 and 1100 °C. In other words, the phase transition from α-ferrite to austenite occurs between 900 and 1050 °C, confirmed by XRD analyses. In addition, the precipitates in different specimens are all (Cr, Fe)7C3 according to the results of XRD.
XRD patterns of X45CrSi93 after compressive deformation at different temperatures.

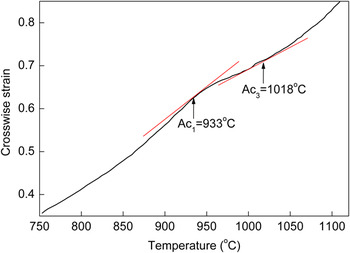
As mentioned above, the equilibrium phase transition temperatures of Ae1 and Ae3 calculated by Thermo-Calc are 865 and 896 °C, respectively. However, thermodynamic calculation can only reveal the equilibrium conditions and the results may differ from the real situation. Consequently, the critical temperatures of phase transition were determined by thermal expansion tests. The tested alloy was heated to 1150 °C with a heating rate of 10 °C·s−1 and the thermal expansion curve was obtained as shown in Fig. 10. The critical temperatures of phase transition of Ac1 and Ac3, acquired by tangent method, are 933 and 1018 °C, respectively.
Thermal expansion curve of X45CrSi93.

C. Solution treatment
Solution treatment was conducted to determine the mechanism of phase transition. The solution treatment for X45CrSi93 was carried out in the temperature range from 850 to 1100 °C at 50 °C intervals. All the specimens were held for about 5 min at different temperatures and then water quenched. And the specimens were also prepared for SEM observation and XRD analyses.
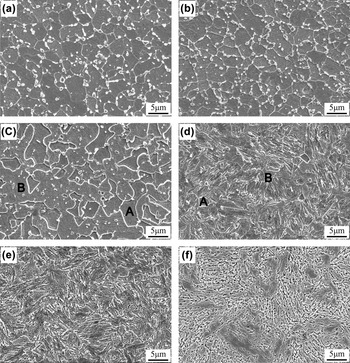
Figure 11 shows the microstructure of X45CrSi93 after solution treatment within the solution temperature ranging from 850 to 1100 °C. As similar to the microstructure of those deformed specimens, the matrix and carbide vary dramatically with solution temperature. Initially, only ferrite can be observed in the microstructure when the solution temperature is 850 and 900 °C [Figs. 11(a) and 11(b)] according to the results of XRD for solution specimens. Then the microstructure is composed of dual phases of ferrite and martensite if the specimens are held at 950 and 1000 °C [Figs. 11(c) and 11(d)]. Finally, only martensite can be observed in the microstructure after being water quenched when the solution temperature is higher than 1050 °C [Figs. 11(e) and 11(f)]. In addition, the number of carbides decreases with increasing temperature. The only one difference is that the microstructure after solution treatment is consisted of equiaxial grains while banded grains after deformation.
SEM microstructure of X45CrSi93 after solution treatment at different temperatures of (a) 850 °C, (b) 900 °C, (c) 950 °C, (d) 1000 °C, (e) 1050 °C, and (f) 1100 °C. The letters of A and B represent ferrite and martensite, respectively.

The similar microstructure characteristics and phase analysis results after solution treatment and deformation illustrate that the phase transition is caused by temperature rather than deformation-induced phase transition.
D. Mechanisms of flow stress abnormal variation
Microstructure is closely related to the properties in the material. The main changes for X45CrSi93 steel during hot working process involve in phase transition and carbide dissolution. So the discussion for mechanism of flow stress abnormal variation will be conducted from the above two aspects.
1. Phase transition
The phase transition from α-ferrite to austenite occurs between 900 and 1050 °C as mentioned above. On the basis of related theories, the phase transition influences the flow stress strongly at elevated temperatures. Austenite characterizes with face-centered cubic (FCC) crystal structure while ferrite is BCC crystal structure. FCC crystal structure is close-packed while BCC is not. So the diffusion rates of elements in austenite are less than that in ferrite. Reference Wu16 In addition, the stacking fault energy of austenite is lower than that of ferrite and the width of extended dislocation in austenite is greater than that in ferrite. Reference Yu17 It is difficult for austenite to conduct dislocation climb and cross-slip as well as softening behavior like dynamic recovery at elevated temperature. Reference Chen, Xie and Ye18 Therefore, the deformation resistance and high-temperature strength of austenite are higher than that of ferrite at the same strain rate. As mentioned above, only ferrite and austenite can be observed in the microstructure at 900 and 1050 °C, respectively. And the peak stress at 1050 °C is higher than that at 900 °C as shown in Fig. 4 which provides direct evidence for the theory that austenite has higher deformation resistance and high-temperature strength than that of ferrite at the same strain rate.
Only ferrite exists in X45CrSi93 after deformation below 900 °C and only austenite above 1050 °C. In these circumstances, the main factor affecting high-temperature strength is deformation temperature. Thermal motion of atoms is enhanced, the resistance of dislocation motion is reduced, and the softening behavior such as dynamic recovery occurs more easily with the rising temperature. So the flow stress decreases with the increasing temperature. Also the true stress–true strain curves exhibit dynamic recovery type at these temperature ranges. However, the descending rate of stress above 1050 °C is less than that below 900 °C especially at higher strain rate as shown in Fig. 5 due to the different properties between austenite and ferrite as mentioned above.
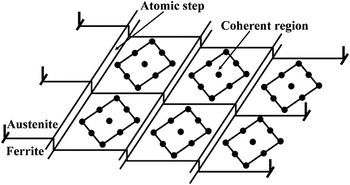
When the deformation temperature is between 950 and 1000 °C, the microstructure of X45CrSi93 is consisted of ferrite and austenite. In this case, the main factor affecting high-temperature strength is the fraction of austenite. Austenite has greater high-temperature strength than that of ferrite, and the fraction of austenite increases as the rising temperature. Hence, the materials characterize with greater flow stress when the deformation temperature is higher, and the flow curves indicate the characteristic of work hardening. In addition, the phase interface of austenite and ferrite exhibits step structure with monatomic thick to increase the degree of coherency between austenite and ferrite. Many coherent regions appear on the atomic steps by local adjustment of some atoms as shown in Fig. 12. Reference Yu17 This kind of phase interface cannot move easily and can generate strengthening effect for X45CrSi93 as well.
The schematic of phase interface of austenite and ferrite with atomic step structure.

2. Carbide dissolution
M7C3 carbide begins to dissolve at higher deformation temperature than 950 °C. Studies have indicated that M7C3 carbide in martensite heat-resistant steel 403 has no precipitation-hardening effect and does not contribute to the high-temperature strength. Reference Zhu and Lu19 However, the elements in carbide such as carbon and chromium dissolve into the matrix when the carbide dissolves. So the redistribution of alloying elements may impact the hot deformation behavior for X45CrSi93.
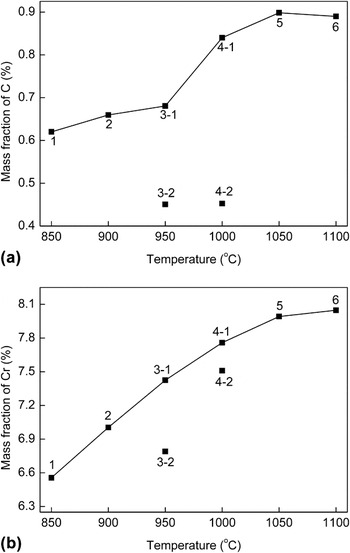
Figure 13 shows the mass fraction of carbon and chromium obtained by EPMA in the specimens after compressive deformation within the deformation temperature range from 850 to 1100 °C at a strain rate of 5 s−1. The numbers in Fig. 13 represent the analysis zones as shown in Fig. 8. It is noted that the content of carbon is a qualitative analysis. It can be clearly seen in Fig. 13 that the mass fraction of carbon and chromium in matrix increases with the increasing deformation temperature as a whole. Taking carbon as an example, the mass fraction increases slowly at the temperature of 850–950 °C. However, the mass fraction rises rapidly within the temperature range from 950 to 1050 °C due to the dissolution of carbide. And the mass fraction remains unchanged when the temperature is above 1050 °C. At the same time, the mass fraction of carbon and chromium in austenite (zone 3-1 and 4-1) is more than that in ferrite (zone 3-2 and 4-2) which shows that the austenite has greater solution strengthening than ferrite.
EPMA of the chemical elements in matrix including the mass fraction of (a) carbon and (b) chromium at different deformation temperatures. The numbers represent the analysis zones as shown in Fig. 8.

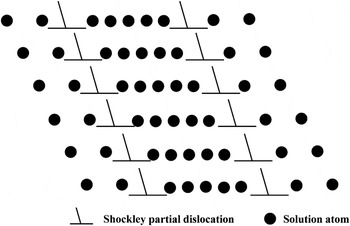
In addition, the stacking fault energy of alloying elements such as Cr is different from that of the matrix element (Fe) which causes the nonuniform distribution of alloying elements inside and outside of the stacking fault zone. Therefore, Suzuki atmosphere generates due to the segregation of solute atoms as shown in Fig. 14 and it can significantly hinder the dislocation cross-slip especially at elevated temperatures. Reference Chiba and Kim20
The schematic of Suzuki atmosphere.

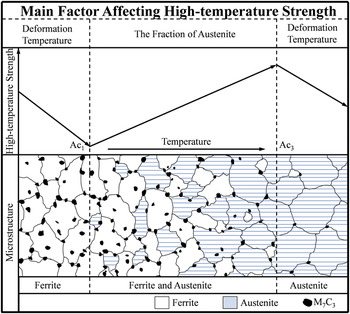
In conclusion, within the deformation temperature range of single-phase region (only ferrite below Ac1 and only austenite above Ac3), the main factor affecting high-temperature strength is the deformation temperature. The resistance of dislocation motion reduces and the softening behavior occurs more easily with the rising temperature. So the flow stress decreases with the increasing temperature. Within the temperature range of two-phase region (Ac1 ∼ Ac3), the fraction of austenite increases as the rising temperature. In this case, the main factor affecting high-temperature strength is the fraction of austenite. Austenite has greater high-temperature strength than that of ferrite and exhibits greater solution strengthening effect. Therefore, the flow stress gets greater with the increasing deformation temperature. The high-temperature strength reaches a minimum value at Ac1 (933 °C) and a maximum value at Ac3 (1018 °C) as shown in Fig. 15. The results may offer reasonable advice to the optimization of rolling process for X45CrSi93 for industrial production.
The relationship between microstructure and high-temperature strength and the mechanisms of high-temperature strength variation tendency at different temperature ranges.

E. The double necking phenomenon in tensile process
Taking the analysis in the section of “Mechanisms of flow stress abnormal variation” into consideration, the double necking phenomenon in the tensile specimen deformed at 1000 °C can be explained clearly.
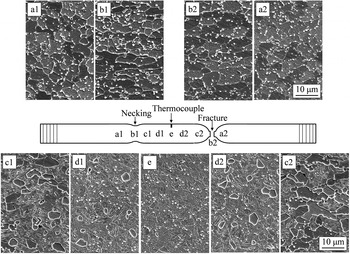
The tensile specimens were sectioned parallel to the deformation axis and the cut surfaces were prepared for microstructure observation. Figure 16 shows the microstructure of X45CrSi93 after tensile deformation at 1000 °C. The microstructure at different positions of the tensile specimen exhibits various characteristics as shown in Fig. 16.
SEM images of X45CrSi93 after hot tensile deformation at 1000 °C. The microstructure of the tensile specimen is symmetrical about the thermocouple.

Only ferrite and carbide precipitated at grain boundaries are observed in the areas of a1, a2 and b1 (necking area), b2 (fracture area) like Figs. 8(a) and 8(b). However, the microstructure in a1 and a2 is consisted of equiaxed grains while banded grains along the tensile axis in the areas of b1 and b2. The phase transition from α-ferrite to austenite occurs in the areas of c1 and c2 and the microstructure in the two areas is composed of ferrite and martensite after being water quenched like Fig. 8(c). And more ferrite transforms into austenite in the areas of d1, d2 and e (thermocouple area) as well as only a little α-ferrite embeds in martensite matrix after being water quenched like Fig. 8(d). The number of α-ferrite in the area of e is less than that in d1 and d2 which shows that the temperature in area e is higher. In addition, most of the carbides dissolve in the matrix in the areas of d1, d2 and e. In a word, the microstructure of the tensile specimen is symmetrical about the thermocouple as a whole.
The symmetrical microstructure shows that the actual temperature in different positions of the tensile specimen is also symmetrical about the thermocouple. The temperature is the highest (1000 °C) in the thermocouple area. In this area, the phase transition from α-ferrite to austenite has almost completed. With the increasing distance to the thermocouple, the actual temperature of the specimen decreases gradually inferred by different microstructure characteristics as mentioned above. The temperature in the area of c1 and c2 has dropped to about 950 °C and the temperature in b1, b2 and a1, a2 is lower than Ac1 (933 °C). In other words, the tensile specimen deformed at 1000 °C has the negative temperature gradient from the middle to the end.
The deformation resistance is minimum in necking and fracture areas. So the actual temperature of necking and fracture areas is critical phase transition temperature (Ac1) and only ferrite can be observed in the two areas as shown in Figs. 15 and 16. As mentioned above, austenite has greater high-temperature strength than that of ferrite and exhibits greater solution strengthening effect. Therefore, the high-temperature strength and deformation resistance in necking and fracture areas are lower than that in the dual-phase areas like the areas of c1, c2, d1, d2 and e as shown in Fig. 16. Moreover, the temperature of necking and fracture areas is higher relative to the areas of a1 and a2. The thermal motion of atoms is enhanced, the resistance of dislocation motion is reduced, and the softening behavior occurs more easily in necking and fracture areas. So the high-temperature strength in necking and fracture areas is lower than that in a1 and a2 as well.
In conclusion, the negative temperature gradient from the middle to the end in the tensile specimen causes the symmetrical microstructure which is the main reason for double necking phenomenon in the tensile specimen deformed at 1000 °C. The high-temperature strength and deformation resistance in necking and fracture areas are minimum in the tensile specimen. These two areas are deformed initially in the tensile process and the tensile specimen exhibits double necking phenomenon finally.
IV. CONCLUSIONS
-
(1) The flow stress decreases with the increasing temperature between 850 and 900 °C followed by an abnormal increase with the increasing temperature between 900 and 1000 °C under the compressive conditions. A normal decrease of the flow stress is continued with the increasing temperature above 1000 °C.
-
(2) The ferrite can be observed only in the final microstructure when the deformation temperatures are 850 and 900 °C. The microstructure is composed of ferrite and martensite if the specimens are deformed at 950 and 1000 °C because of phase transition from α-ferrite to austenite. Martensite can be observed only in the final microstructure after being water quenched when the temperature is higher than 1050 °C. In addition, the carbide begins to dissolve at about 950 °C and decrease with the increasing temperature.
-
(3) The critical phase transition temperatures of Ac1 and Ac3 for X45CrSi93 are 933 and 1018 °C, respectively. Within the deformation temperature range of single-phase region (below Ac1 and above Ac3), the main factor affecting high-temperature strength is deformation temperature. The resistance of dislocation motion is reduced and the softening behavior occurs more easily with the rising temperature and the flow stress decreases with the increasing temperature. Within the temperature range of two-phase region (Ac1 ∼ Ac3), the main factor affecting high-temperature strength is the fraction of austenite which increases as the rising temperature. Austenite characterizes with greater high-temperature strength than that of ferrite and exhibits greater solution strengthening effect. Therefore, the flow stress gets greater with the increasing deformation temperature. The phase transition strengthening and solution strengthening at elevated temperatures are the main reasons for the abnormal variation of flow stress for X45CrSi93.
-
(4) The tensile specimen deformed at 1000 °C has the negative temperature gradient from the middle to the end. The actual temperature of necking and fracture areas is about Ac1. The high-temperature strength and deformation resistance at Ac1 temperature are minimum. Therefore, these two areas are deformed initially in the tensile process and the tensile specimen exhibits double necking phenomenon finally.
-
(5) The flow stress abnormal variation deformed between Ac1 and Ac3 of X45CrSi93 should be taken into consideration for industrial production. These experimental results may provide good help for hot working process design and microstructure control of X45CrSi93 bar product during continuous rolling process.
ACKNOWLEDGMENTS
The authors would like to thank for the financial support from MCC Capital Engineering & Research Incorporation Limited and the facilities provided by materials experimental test center in School of Materials Science and Engineering, University of Science and Technology Beijing.