Introduction
Thorite and huttonite, two dimorphs of ThSiO4, are well-known naturally occurring actinide orthosilicates. Thorite is often found in a metamict (radiation-damaged) state. The available data on huttonite are limited (Ewing and Haaker, Reference Ewing and Haaker1980; Förster et al., Reference Förster, Harlov and Milke2000). Both minerals have a structure composed of isolated SiO4 tetrahedra and ThO8 (in thorite) or ThO9 (in huttonite) edge-sharing polyhedra (George, Reference George1951; Pabst and Hutton, Reference Pabst and Hutton1951). The density of huttonite is 7.1 g/cm3, while ρ = 6.7 g/cm3 for thorite, both ideally ThSiO4. The primary structural distinction is the presence of large voids in the structure of thorite (Taylor and Ewing, Reference Taylor and Ewing1978). These voids form channels parallel to the c axis and may contain water (Strzelecki et al., Reference Strzelecki, Barral, Estevenon, Mesbah, Goncharov, Baker, Bai, Clavier, Szenknect, Migdisov, Xu, Ewing, Dacheux and Guo2021). Metamict thorite may contain up to 70 mol.% of water (Ewing, Reference Ewing1994). ‘Thorogummite’ (Th,U)(SiO4)1-x(OH)4x was discredited a decade ago (Piilonen et al., Reference Piilonen, Rowe, Poirier, Grice and McDonald2014).
The phase transition of thorite (zircon-type I41/amd) into huttonite (monazite-type P2/c) for natural and synthetic samples is reported in the range of 715–1225°C. According to Finch et al. (Reference Finch, Harris and Clark1964) and Seydoux-Guillaume and Montel (Reference Seydoux-Guillaume, Wirth, Heinrich and Montel1997), the thorite–huttonite phase transition occurs at temperatures of 1225 ± 10°C and 1210 ± 10°C, respectively, however Dachille and Roy (Reference Dachille and Roy1964) reported a significantly lower value of phase transition temperature of 1000°C. The phase diagram for dependence on pressure and temperature was determined by Mazeina et al. (Reference Mazeina, Ushakov, Navrotsky and Boatner2005). Huttonite is more stable at high pressures and high temperatures.
The recrystallisation of the metamict thorium silicates is the subject of numerous publications. Huttonite was reported to crystallise from the metamict thorite upon heating above 1000°C (Robinson and Abbey, Reference Robinson and Abbey1957). According to Pabst (Reference Pabst1952), during the examination of five thorium silicate metamict specimens, it was observed that both thorite and huttonite phases were capable of crystallising simultaneously at 715°C, with thorite dominating over huttonite in the temperature range of 850–935°C. The heat treatment at 1400°C resulted in the complete transformation of thorium silicate phases into huttonite. Staatz et al. (Reference Staatz, Adams and Wahlberg1976) heated thorite at 1000°C for 1 h, which led to the crystallisation of thorite and cubic (Th,U)O2.
Thorite and huttonite are regarded as actinide-bearing phases in multiphase ceramic waste forms (Lumpkin et al., Reference Lumpkin, Gao, Gieré, Williams, Mariano and Geisler2014; Shelyug et al., Reference Shelyug, Rafiuddin, Mesbah, Clavier, Szenknect, Dacheux, Guo and Navrotsky2021). In ion irradiation experiments conducted on hydrothermally synthesised huttonite and thorite, it was observed that the former exhibits a lower critical amorphisation temperature (Meldrum et al., Reference Meldrum, Zinkle, Boatner and Ewing1999b). It was observed that the area of radiation damage in huttonite was smaller than in thorite, which was tentatively attributed to a higher density of the former (Cartz et al., Reference Cartz, Karioris and Gowda1982). The study of thorium silicate minerals has the potential to enhance our comprehension of the long-term behaviour of these actinide bearing phases (Yudintsev et al., Reference Yudintsev, Nickolsky, Ojovan, Stefanovsky, Nikonov and Ulanova2022).
The aim of the current study is to comprehensively examine the thermal behaviour of initially amorphous thorium silicates. Our research is driven by the limited knowledge of the behaviour of huttonite upon temperature rise. Huttonite is rarely encountered, necessitating further investigation with more samples of metamict thorium silicates. Moreover, there is a lack of annealing experiments, and most of them were conducted in the past century under less refined conditions. In this study, we employ high-temperature powder X-ray diffraction to investigate three metamict samples from the syenite pegmatites of the Larvic Plutonic Complex, Norway, thereby enabling the in situ observation of their recrystallisation.
Experimental section
Materials for the study
Three mineral samples were obtained from the former collection of the department of mineral deposits in St. Petersburg State University and originate from the syenite pegmatites of the Larvic Plutonic Complex, Norway. MTS1 (catalogue number 183/9) is an orange zonal crystal (∼1 cm) with preserved tetragonal shape embedded in the feldspar (Fig. 1). MTS2 (catalogue number 191/4) and MTS3 (catalogue number 183/5) represent an individual brownish crystal and black crystal cluster ∼ 2 cm wide each, both with a greasy lustre, respectively. In the text below, we refer to the metamict thorium silicate samples as MTS, and recrystallised thorium silicate samples obtained by heating metamict samples as RTS (Table 1).
MTS1, MTS2 and MTS3 thorium silicate samples from the syenite pegmatites of the Larvic Plutonic Complex, Norway used in this study.

The designations of the mineral samples utilised in this study (MTS = metamict thorium silicate; RTS = recrystallised thorium silicate; BSE = back scattered electron)

* After undergoing heat treatment, the black rim of MTS1 transforms into a yellow hue.
Chemical analysis
To investigate the chemistry of the heat-treated samples, selected grains (Fig. 2) from each of the metamict samples were heated for 10 hours at 1200°C in air. The water content was calculated as the difference between the total sums of RTS (i.e. anhydrous) and MTS (i.e. hydrated) samples. The nomenclature of sample names is detailed in Table 1.
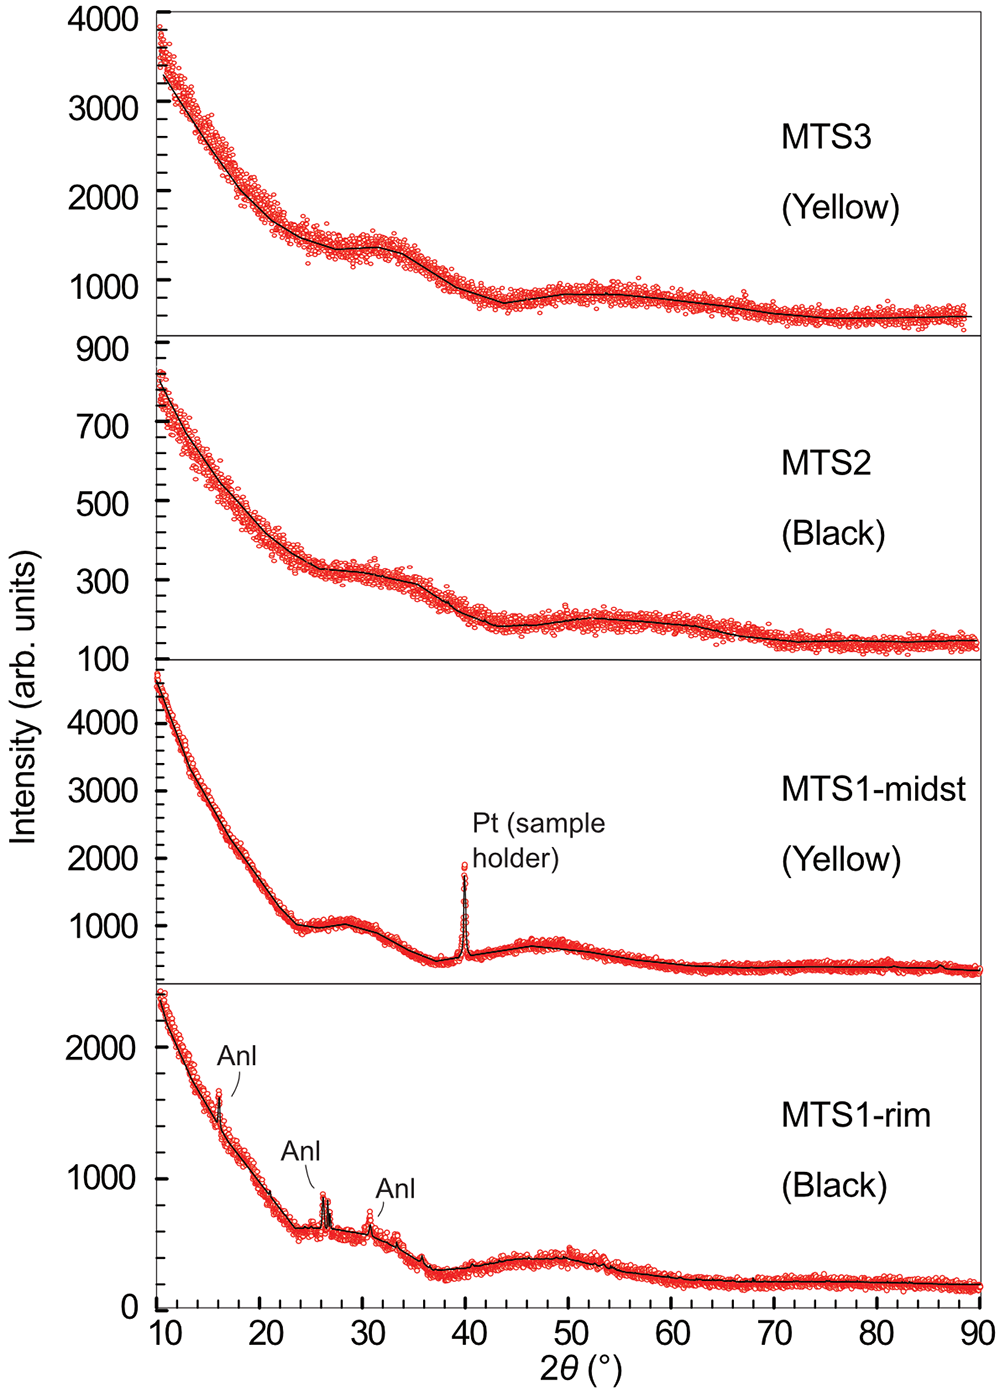
PXRD patterns of the MTS1, MTS2 and MTS3 samples demonstrating their metamict nature. The powder sample colour is indicated in brackets. The reflection observed in the pattern of MTS1-midst is attributed to the platinum sample holder, which appears because of the tiny amount of available material used for the study. MTS1-rim contains a minor admixture of analcime.

The MTS and RTS grains were mounted into an epoxy resin. Electron probe microanalyses (EPMA) was undertaken on the samples using a Hitachi S-3400N scanning electron microscope, equipped with a Oxford Instruments X-Max 20 spectrometer. Quantitative analyses were performed with an accelerating voltage of 20 kV, a beam current of 1.8 nA and acquisition time was 30 s. An EDX spectrometer was calibrated against a set of synthetic and natural standards [Pb – PbTe, Ca; O – calcite; Si – albite; Th – Th containing glass (Micro Analysis Consultants Ltd., UK); and U – derriksite (mineral)]. The Az-Tec Tru-Q ® technique was used for the overlap corrections. No studies for the determination of the detection limits for chosen elements in given matrix were carried out, however the measured quantities meet 3σ criterion. Generally, the detection limits are expected to be higher than 0.1 wt.%. A full list of the data is given in Supplementary Table 1.
Electron back-scatter diffraction analysis
Electron back-scatter diffraction (EBSD) analyses of the RTS1-midst sample were performed by the means of a Hitachi S-3400N Scanning Electron Microscope (SEM) equipped with Nordlys Nano EBSD detector. The composition and structural data, including EDX and EBSD single-point measurements and mapping, were collected and processed with Oxford AzTec and Channel5 software packages. The reference data from Fuchs and Gebert (Reference Fuchs and Gebert1958) for thorite and monazite data (Ni et al., Reference Ni, Hughes and Mariano1995) for huttonite were used for diffraction pattern indexing and phase identification.
No crystalline relics were detected within the MTS1 sample, indicating that the material is amorphous, as evidenced by the EBSD patterns. The surrounding matrix has been identified as a feldspar.
Raman spectroscopy
Raman spectra were acquired using a Horiba Jobin-Yvon LabRam HR800 Raman spectrometer, equipped with an Olympus BX41 optical microscope with a resolution of 2 cm−1 and the laser beam spot size of 5 μm. Raman spectra were excited using both 532 and 325 nm lasers.
When a laser wavelength of 532 nm was employed, the Raman bands of the heat-treated samples RTS1, RTS2, RTS3 were well resolved, whereas the metamict sample displayed a robust fluorescence background. We used a 325 nm laser to investigate the metamict samples, to minimise fluorescence. Baseline correction was used to improve the signal-to-noise ratio using CrystalSleuth software.
Powder X-ray diffraction and high-temperature X-ray diffraction
Hand-picked grains from the MTS samples were ground into a powder for further analysis using a Rigaku Ultima IV diffractometer. Powder X-ray diffraction (PXRD) analysis of MTS1-midst, MTS2 and MTS3 exhibited amorphous halos on the pattern with no crystalline relics (Fig. 2). Phase analysis revealed the presence of a minor analcime (Meier, Reference Meier1973) admixture in sample MTS1-rim taken from the black rim.
The recrystallisation of all MTS samples was studied in air by high-temperature X-ray diffraction (HTXRD) using a Rigaku Ultima IV diffractometer (CoKα radiation, 40 kV/30 mA, Bragg–Brentano geometry, PSD D-Tex Ultra) with a thermo-attachment in the range 30–1200°C with a 30°C step. A finely ground sample was deposited on a platinum sample holder (20 × 12 × 1.5 mm) from an ethanol suspension. Phase analysis was performed using the PDF-2 database (ICDD, 2022), PDXL (Rigaku, Reference Rigaku2010) and TOPAS V.5.0 (Bruker, Reference Bruker2015) software.
The thermal expansion of the several RTS samples was studied using the same equipment and conditions. The visualisation and calculation of the thermal expansion was performed using the RTT program package (Bubnova et al., Reference Bubnova, Firsova, Volkov and Filatov2018).
Thermal analysis
The most homogeneous sample, MTS3, was utilised for the thermal analysis using a NETZSCH STA 429 thermal analyser in the range 40–1300°C (20°C/min). The powdered sample was placed in a corundum crucible and heated to 1300°C at 20°C/min in air. At the same rate, it was cooled to 300°C.
Results
Chemistry of metamict MTS samples
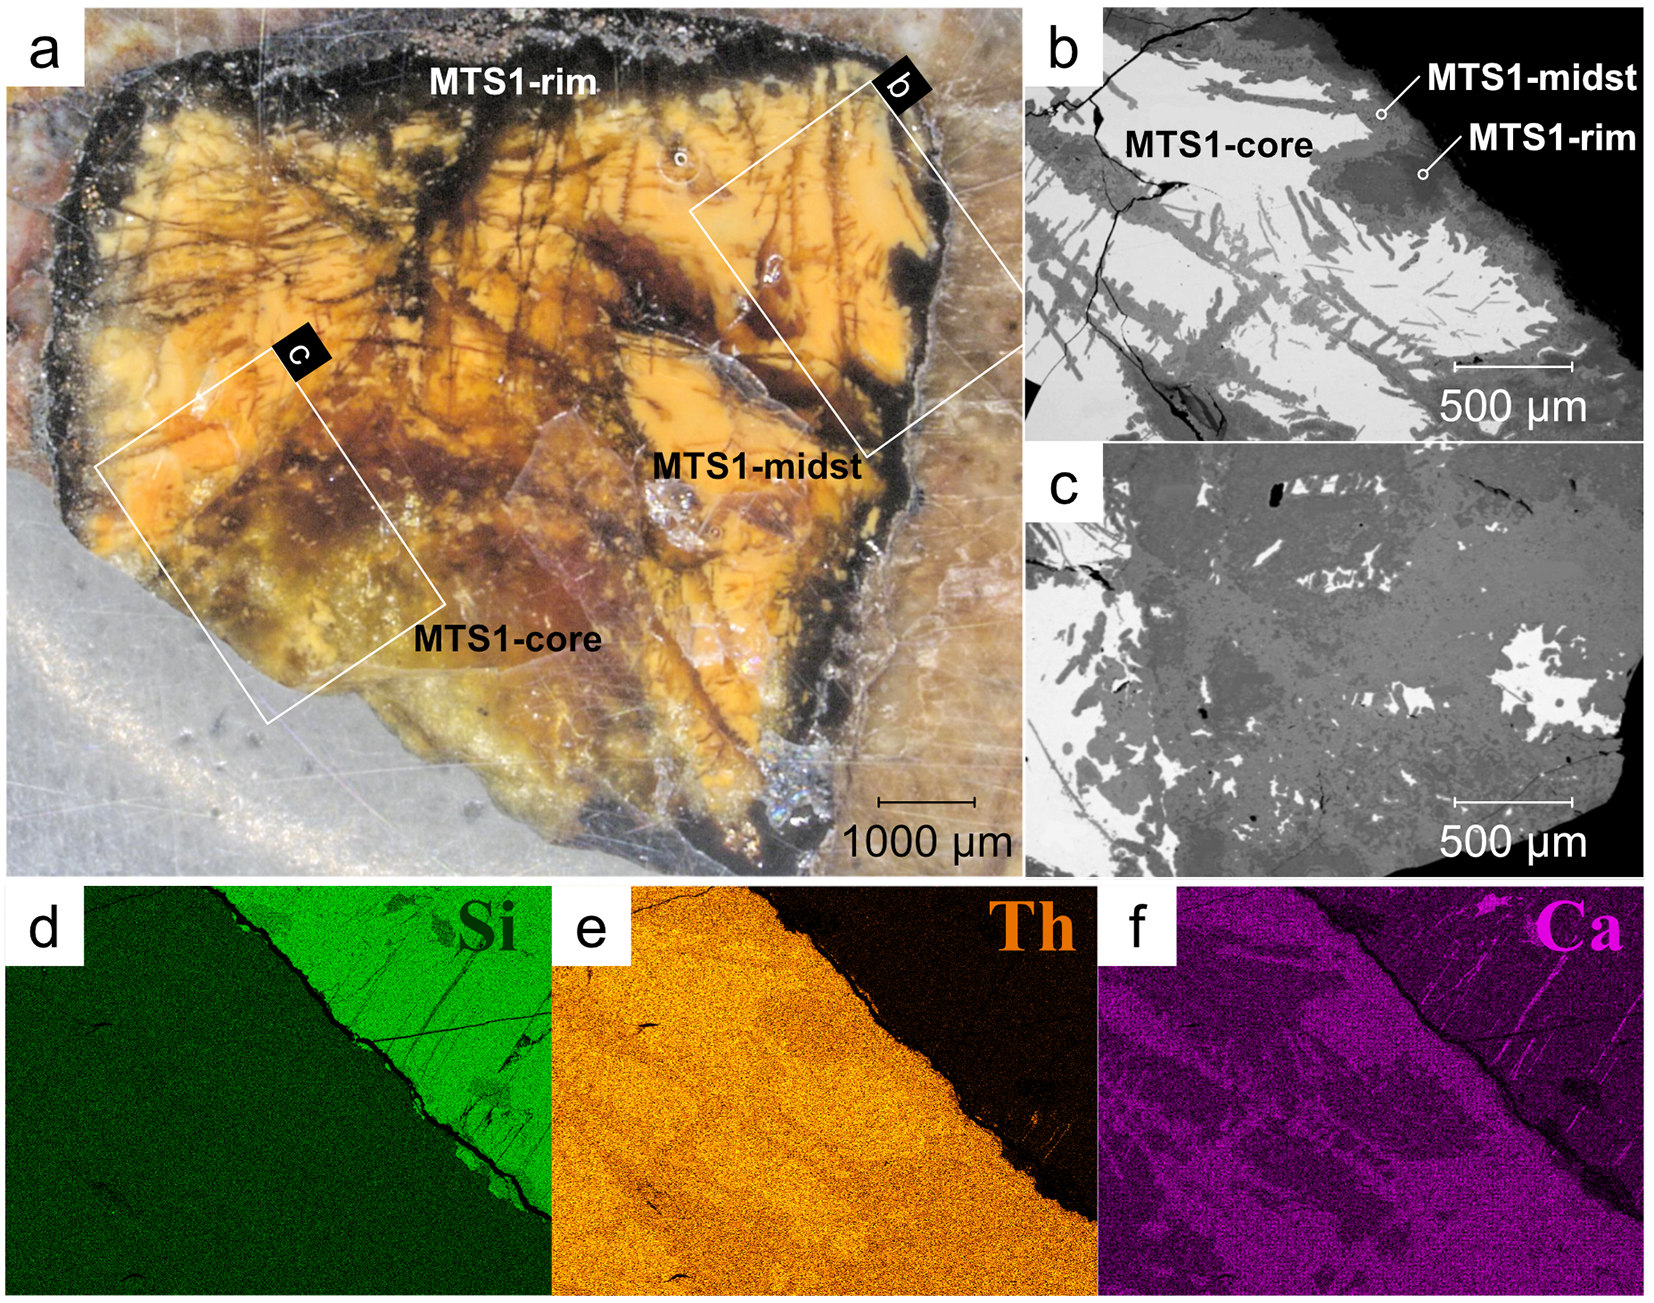
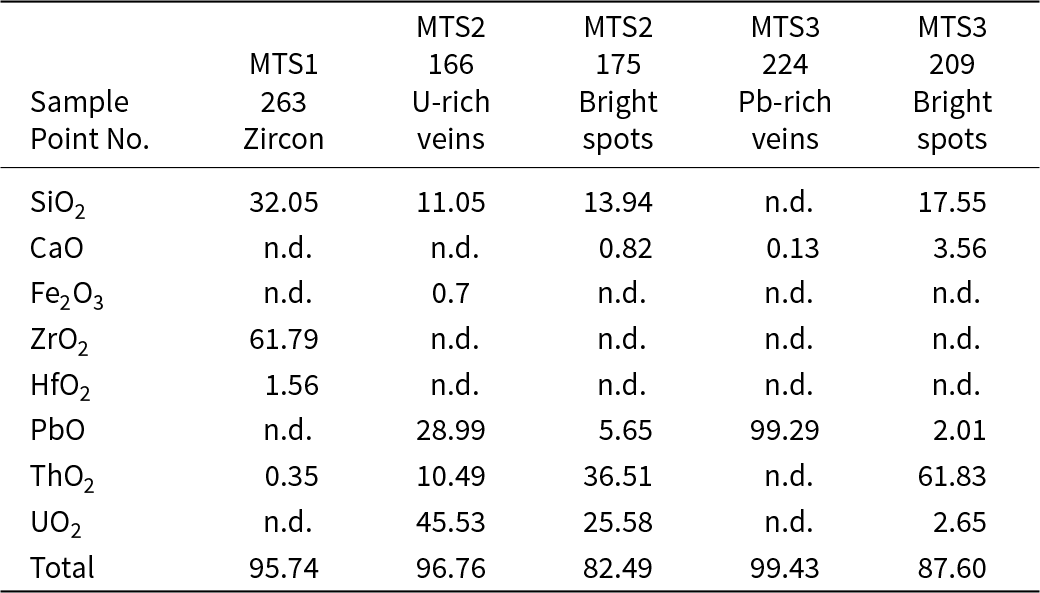
Three distinct regions are observed in the back-scattered electron (BSE) image of MTS1. They are easy to identify by their BSE contrast from core to rim: brightest grey, light grey, and dark grey. These regions correspond to the macroscopically visible colours in Fig. 3a: yellow opaque, yellow translucent and black. BSE images of the enlarged areas are shown in the insets of Fig. 3b and c. The element-distribution maps of Si, Th and Ca are in Fig. 3d, e and f, respectively. Silicon has a uniform distribution across the three regions. Additionally, the MTS1-core exhibits higher Th levels and lower Ca levels compared to the MTS1-midst and MTS1-rim. To study the composition using the EDX, an area was selected on the boundary between the yellow and black zones in MTS1 (Fig. 4a). Outside the black boundary, a small greyish fragment of zircon was identified (Fig. 4a) (Table 2, point 263).
Polished colour-zoned metamict thorium silicate (MTS1 sample) with preserved tetragonal shape embedded in albite matrix. Three zones/areas are distinguished: MTS1-core, MTS1-midst and MTS1-rim, which correspond to the back-scattered electron (BSE) image (from the core to the rim) bright grey, light grey and dark grey, respectively (a). The areas highlighted with white rectangles indicate areas for BSE images further shown in (b) and (c) insets. Element-distribution maps of Si (d), Th (e) and Ca (f) are for the selected region shown in (b).

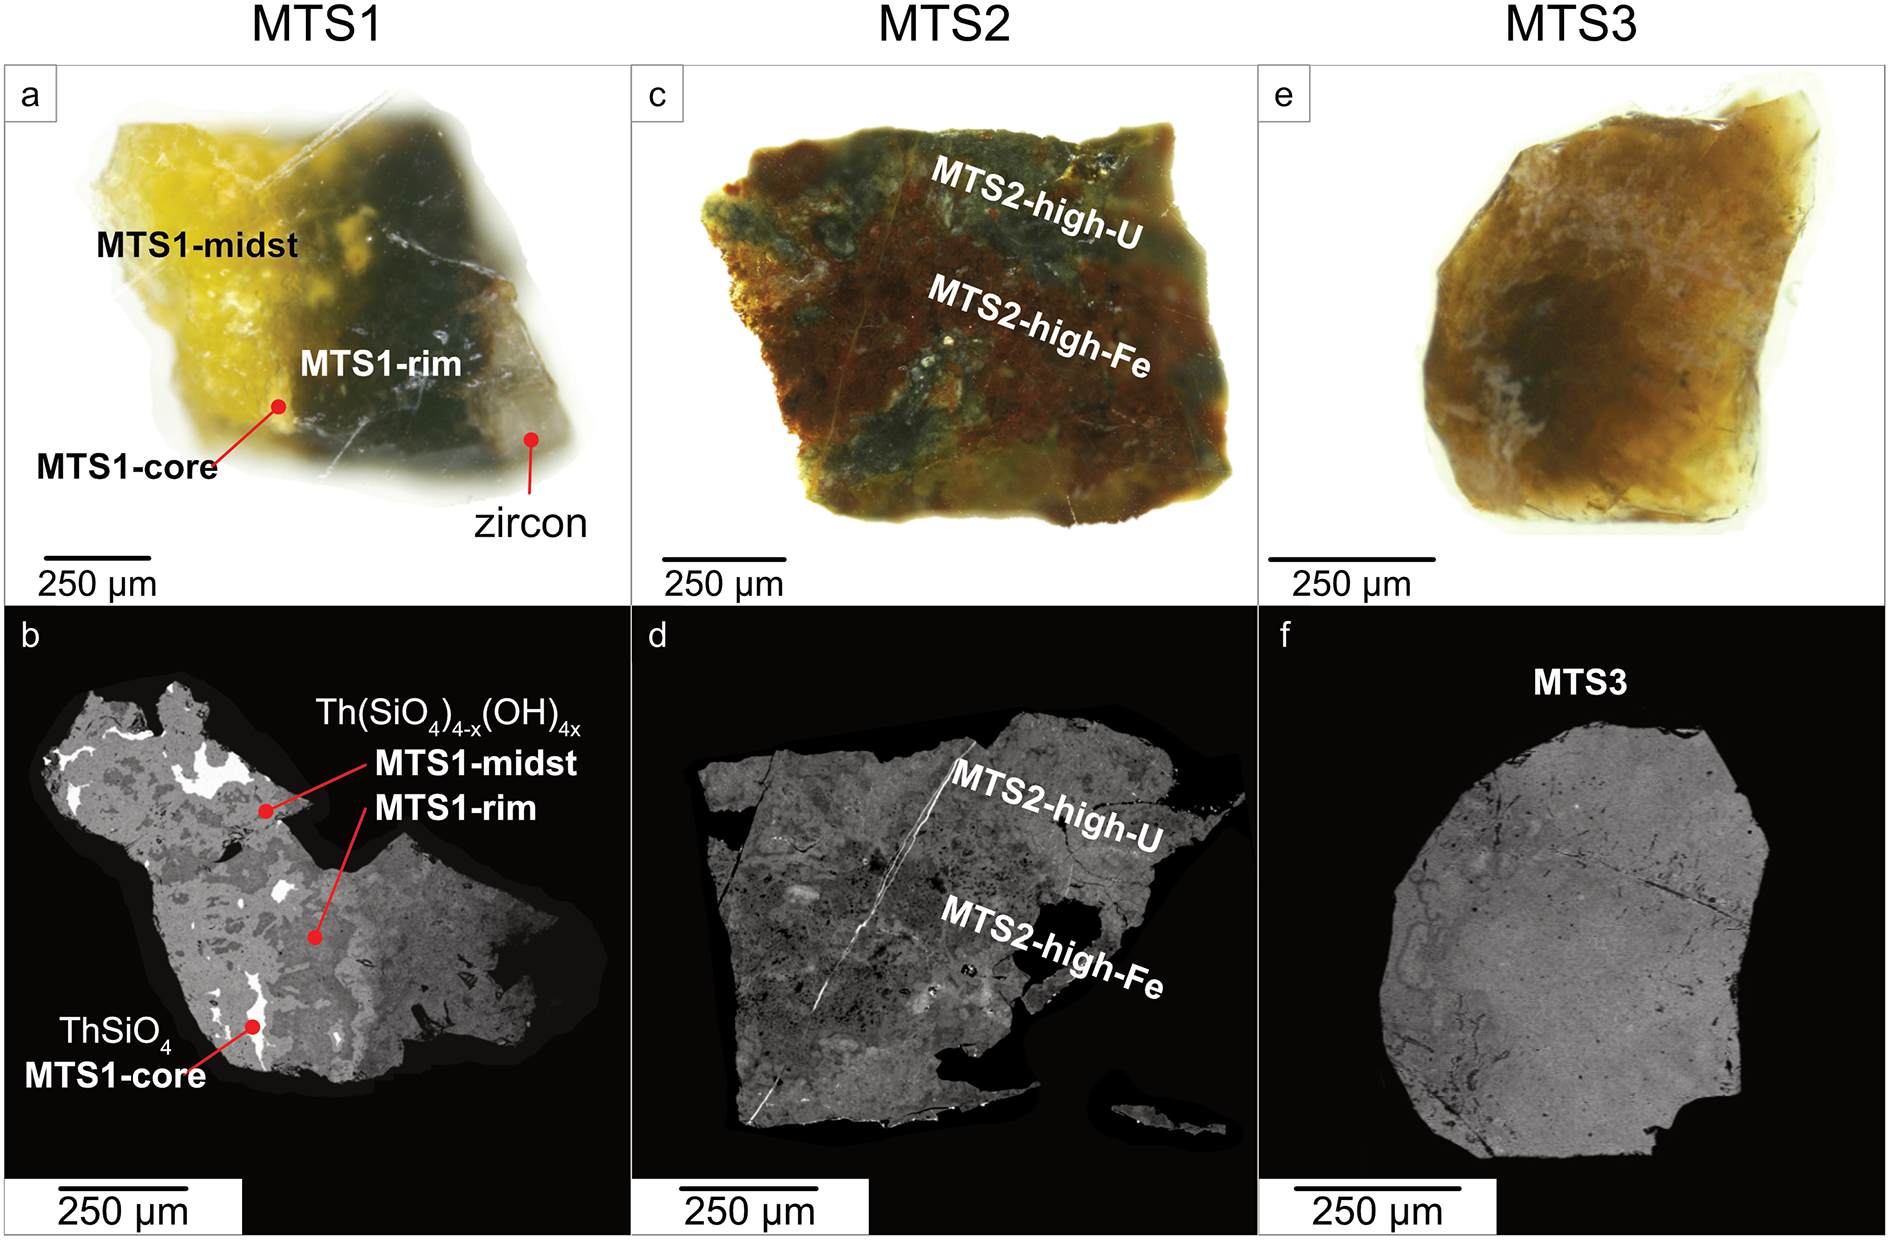
Photographs and BSE images depicting the selected grains from MTS1, MTS2 and MTS3 samples. MTS1 is represented by a grain consisting of yellow opaque (MTS1-core), yellow translucent (MTS1-midst) and black areas (MTS1-rim) (a). The grain consists of both almost anhydrous ThSiO4 (yellow opaque areas) and heavily hydroxylated silicate thorium (b). A grain from the MTS2 sample consists of black (MTS2-high-U) and brown areas (MTS2-high-Fe) irregularly distributed over the sample (c). Brown areas are characterised by high Fe content, whereas black areas are rich in U (d). A grain from the MTS3 sample (e) is relatively homogeneous in BSE (f).

Chemical composition (wt.%) of inclusions observed in metamict MTS samples

Notes: n.d. – not detected.
The grain from sample MTS2 is heterogeneous, featuring irregularly distributed black and brown areas, as depicted in Fig. 4c. These two areas are distinguished by their uranium and iron content, denoted as MTS2-high-U and MTS2-high-Fe, corresponding to the lighter and darker regions in the BSE image, respectively (Fig. 3d). Detailed chemical analyses of these areas are discussed below. A narrow, bright vein (Table 2, point 166), less than 2 μm wide, is observed in the BSE image of MTS2 (Fig. 3d). It consists of a uranium silicate phase with a high Pb content (32 wt.% PbO and 46 wt.% UO2). In addition, in the BSE image of MTS2, white dots of 1–2 μm size can also be observed spread throughout the volume. The uranium content of these white dots surpasses that of the thorium silicate substrate, reaching up to 25 wt.% UO2 (Table 2, point 175).
The MTS3 sample is relatively homogeneous (Fig. 4e, f). There are several bright spots in the thorium silicate matrix that indicate an elevated level of uranium (Table 2, point 209). The Pb-rich veins are also observed in the MTS3 sample (Table 2, point 224).
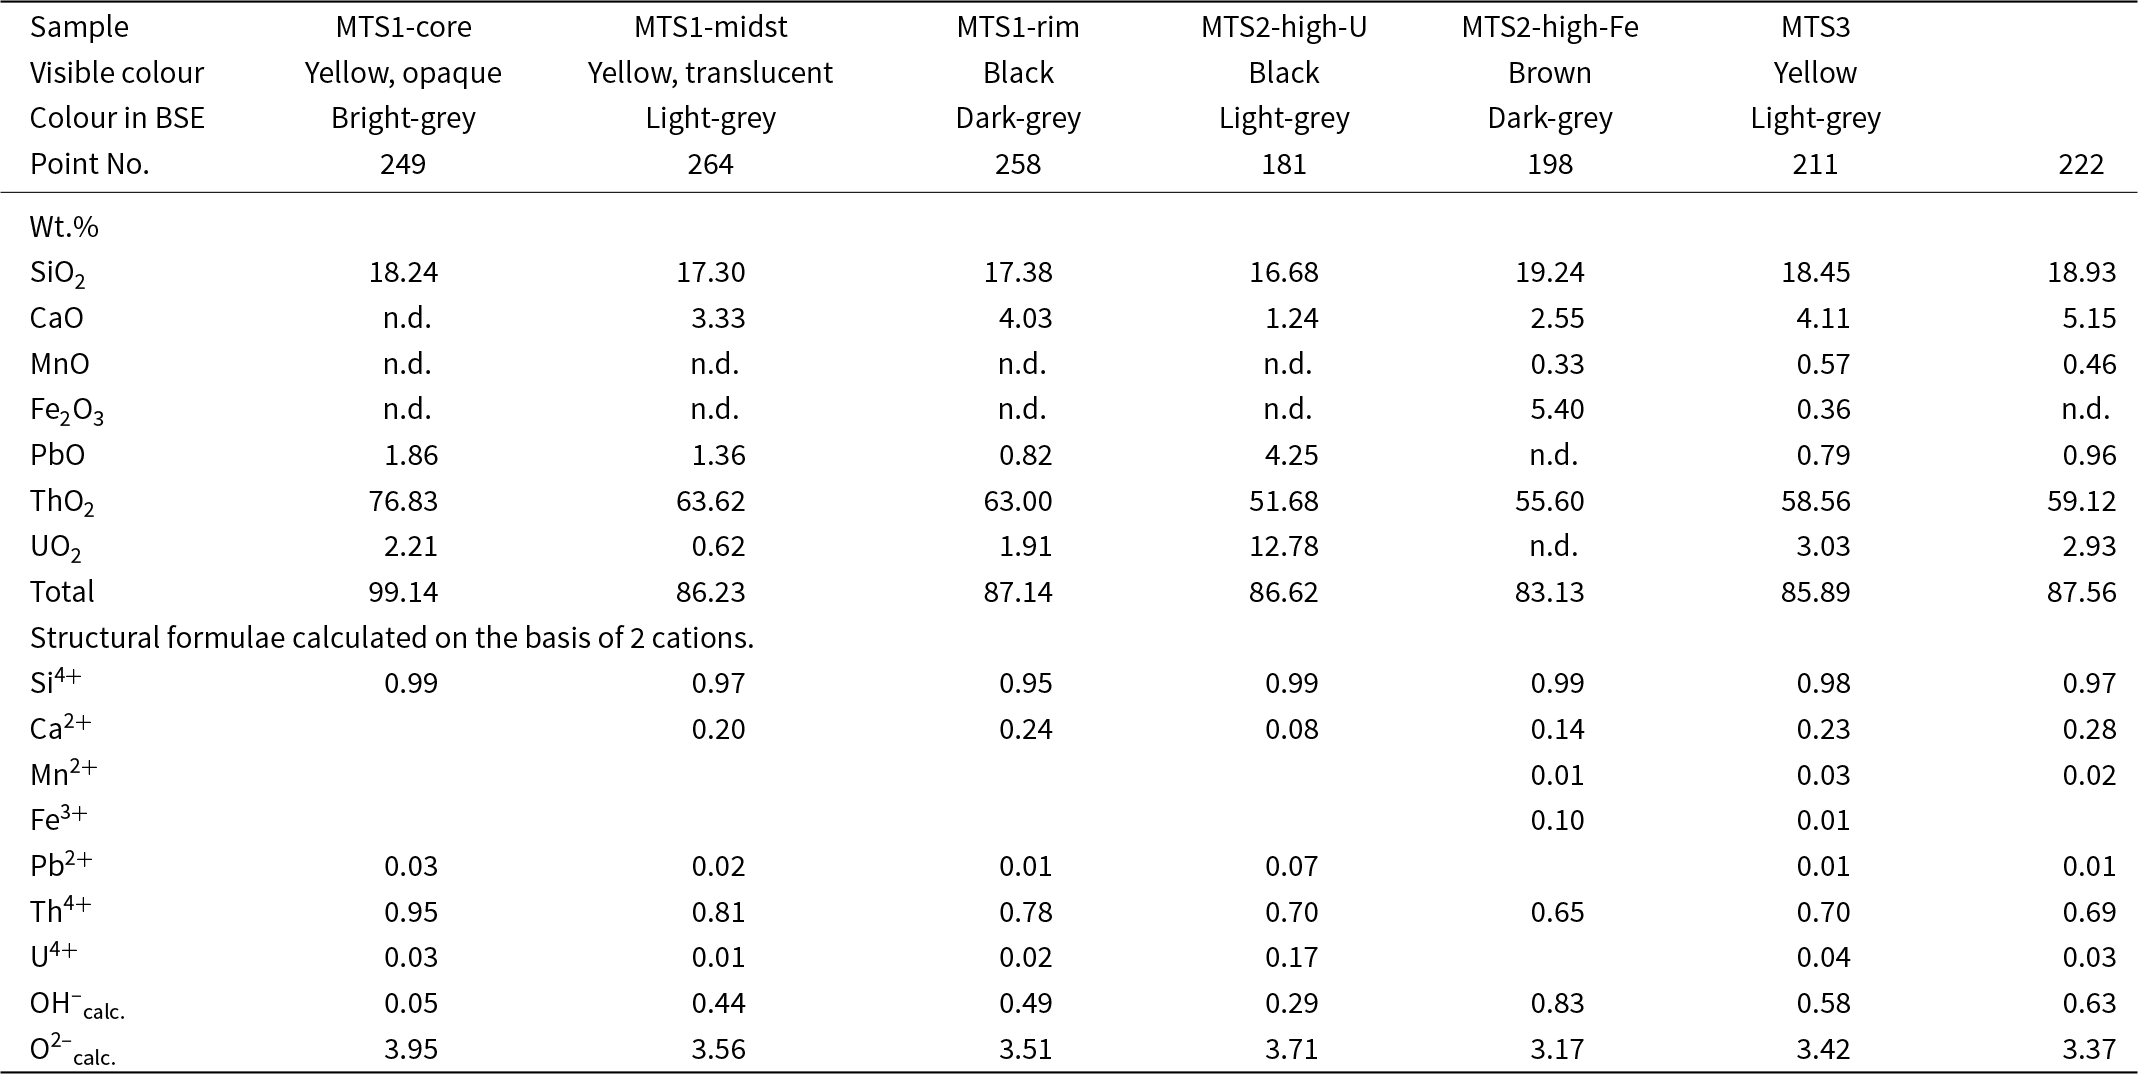
In general, the results of an electron microprobe analysis of MTS1, MTS2 and MTS3 (Table 3) reveal a variable uranium (UO2 = 0–25.68 wt.%) and thorium (ThO2 = 36.67–78.05 wt.%) content. Analytical totals are low due to high water content (up to 14 wt.%), which is common for metamict thorite.
Chemical composition (wt.%) and atoms per formula unit of metamict thorium silicates from the syenite pegmatites of the Larvic Plutonic Complex, Norway (MTS)

Notes: OH–calc. and O2–calc. are calculated from charge balance; n.d. – not detected.
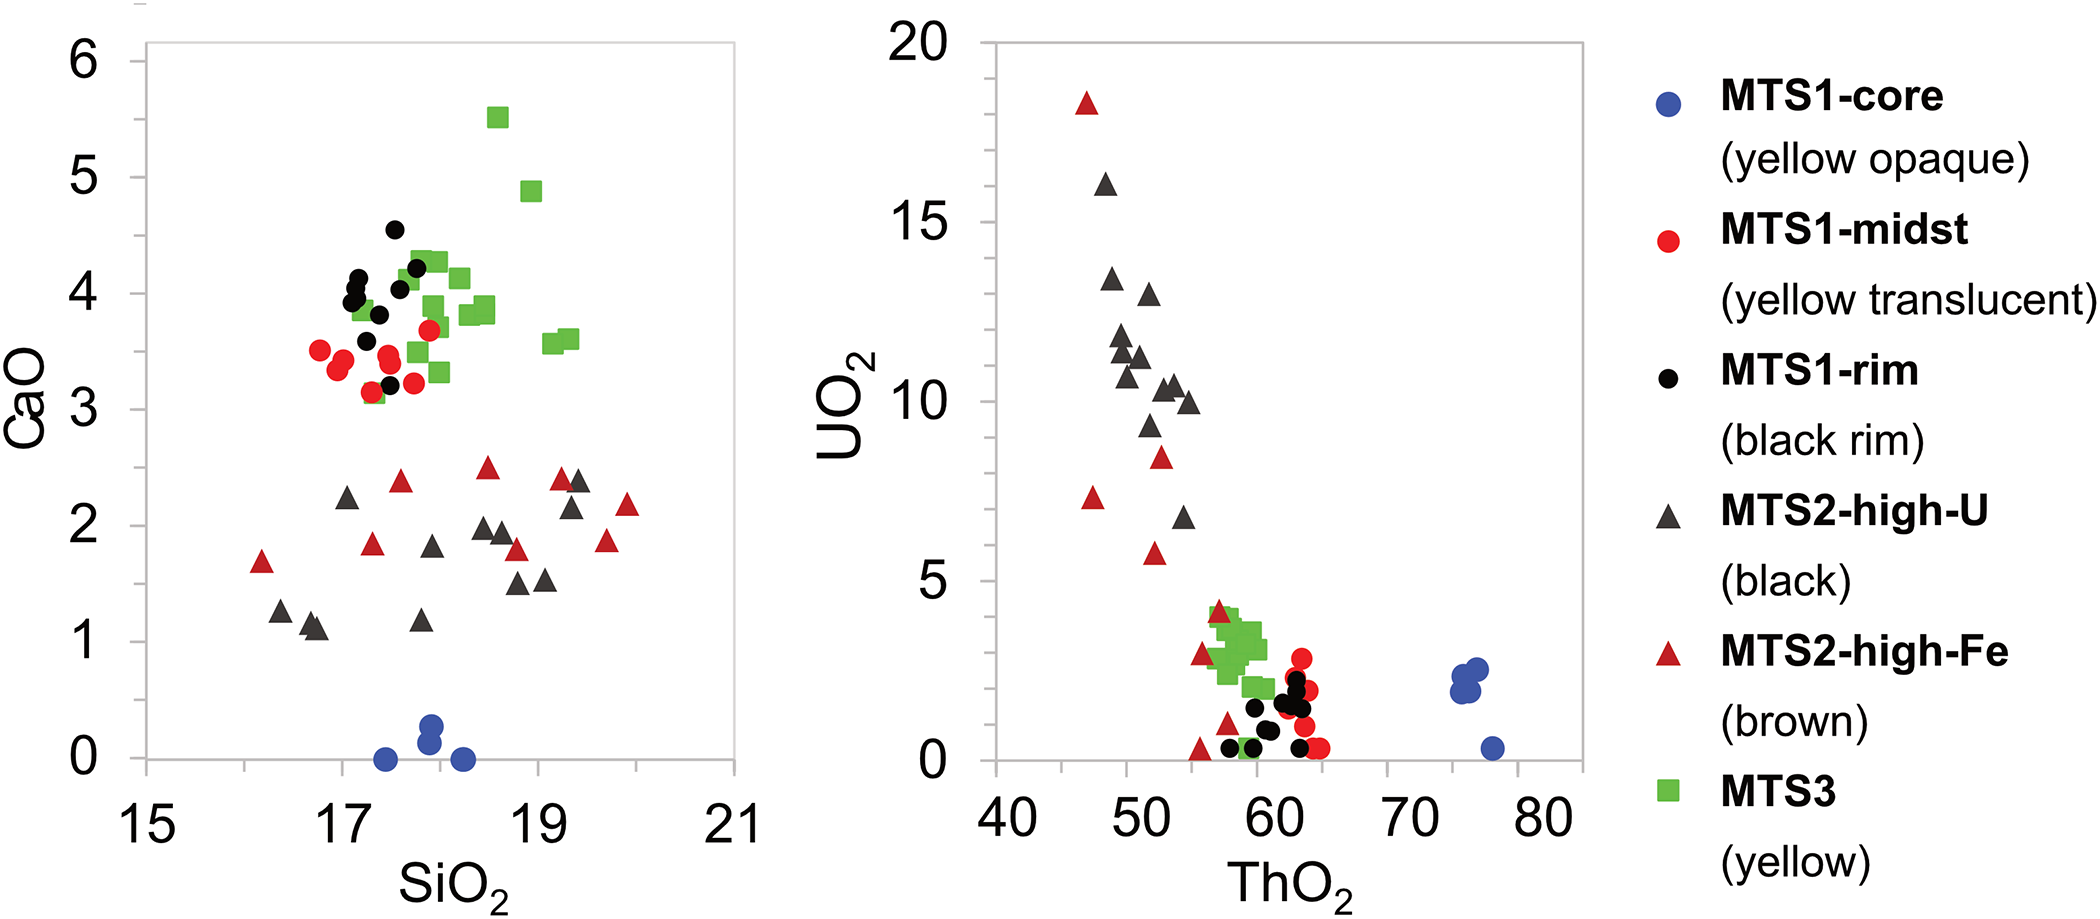
Two diagrams, UO2 vs ThO2 and CaO vs SiO2 (wt.%), are shown in Fig. 5 to distinguish MTS samples in terms of chemical composition. The MTS1-core analyses are close to the composition of ideal ThSiO4. In contrast, the MTS1-midst, MTS1-rim, MTS2-high-U, MTS2-high-Fe and MTS3 are hydrated and altered thorium silicates.
Compositional variations of thorium silicates in wt.% for MTS samples.

Detailed chemical compositions are given in Table 3. The MTS1-core areas correspond to the opaque yellow areas from the core part of the MTS1 sample. It is almost ideal with the presence of only slightly hydrated thorium silicate, with an average total of 98 wt.%. Among the samples studied, MTS1-core areas have the highest ThO2 content of 78.05 wt.% shown in Figs 2 and 3b. Only a minor hydration for these areas is observed, confirmed by Raman spectroscopy (see below).
The MTS1-midst and MTS1-rim correspond to translucent yellow and opaque black rim in sample MTS1 (Fig. 3), respectively. These zones show a higher level of CaO, coupled with a reduced content of ThO2 and a lower total, down to 57.89 wt.%. The black opaque rim (MTS1-rim) is also enriched by MnO, Fe2O3 and P2O5. Notably, MTS1-rim areas exhibit more significant alteration and hydration than MTS1-midst areas (Fig. 4).
The general characteristic of the heterogeneous MTS2 sample is the increased uranium and iron content compared to MTS1 and MTS3 (Table 3), which manifests as brown and black colours in visible light (Fig. 3c). These regions correspond to variations in composition, with the black areas (MTS2-high-U) being rich in uranium, as illustrated in Fig. 4. The brown areas (MTS2-high-Fe) are high in iron.
Sample MTS3 (Fig. 3e,f) is homogeneous in composition. The plots for MTS3 areas shown in Fig. 4 are chemically similar to the altered areas in MTS1 (-midst and -rim). However, the uranium content in MTS3 is higher than in MTS1 (Table 3).
Chemistry of heat-treated (recrystallised) RTS samples
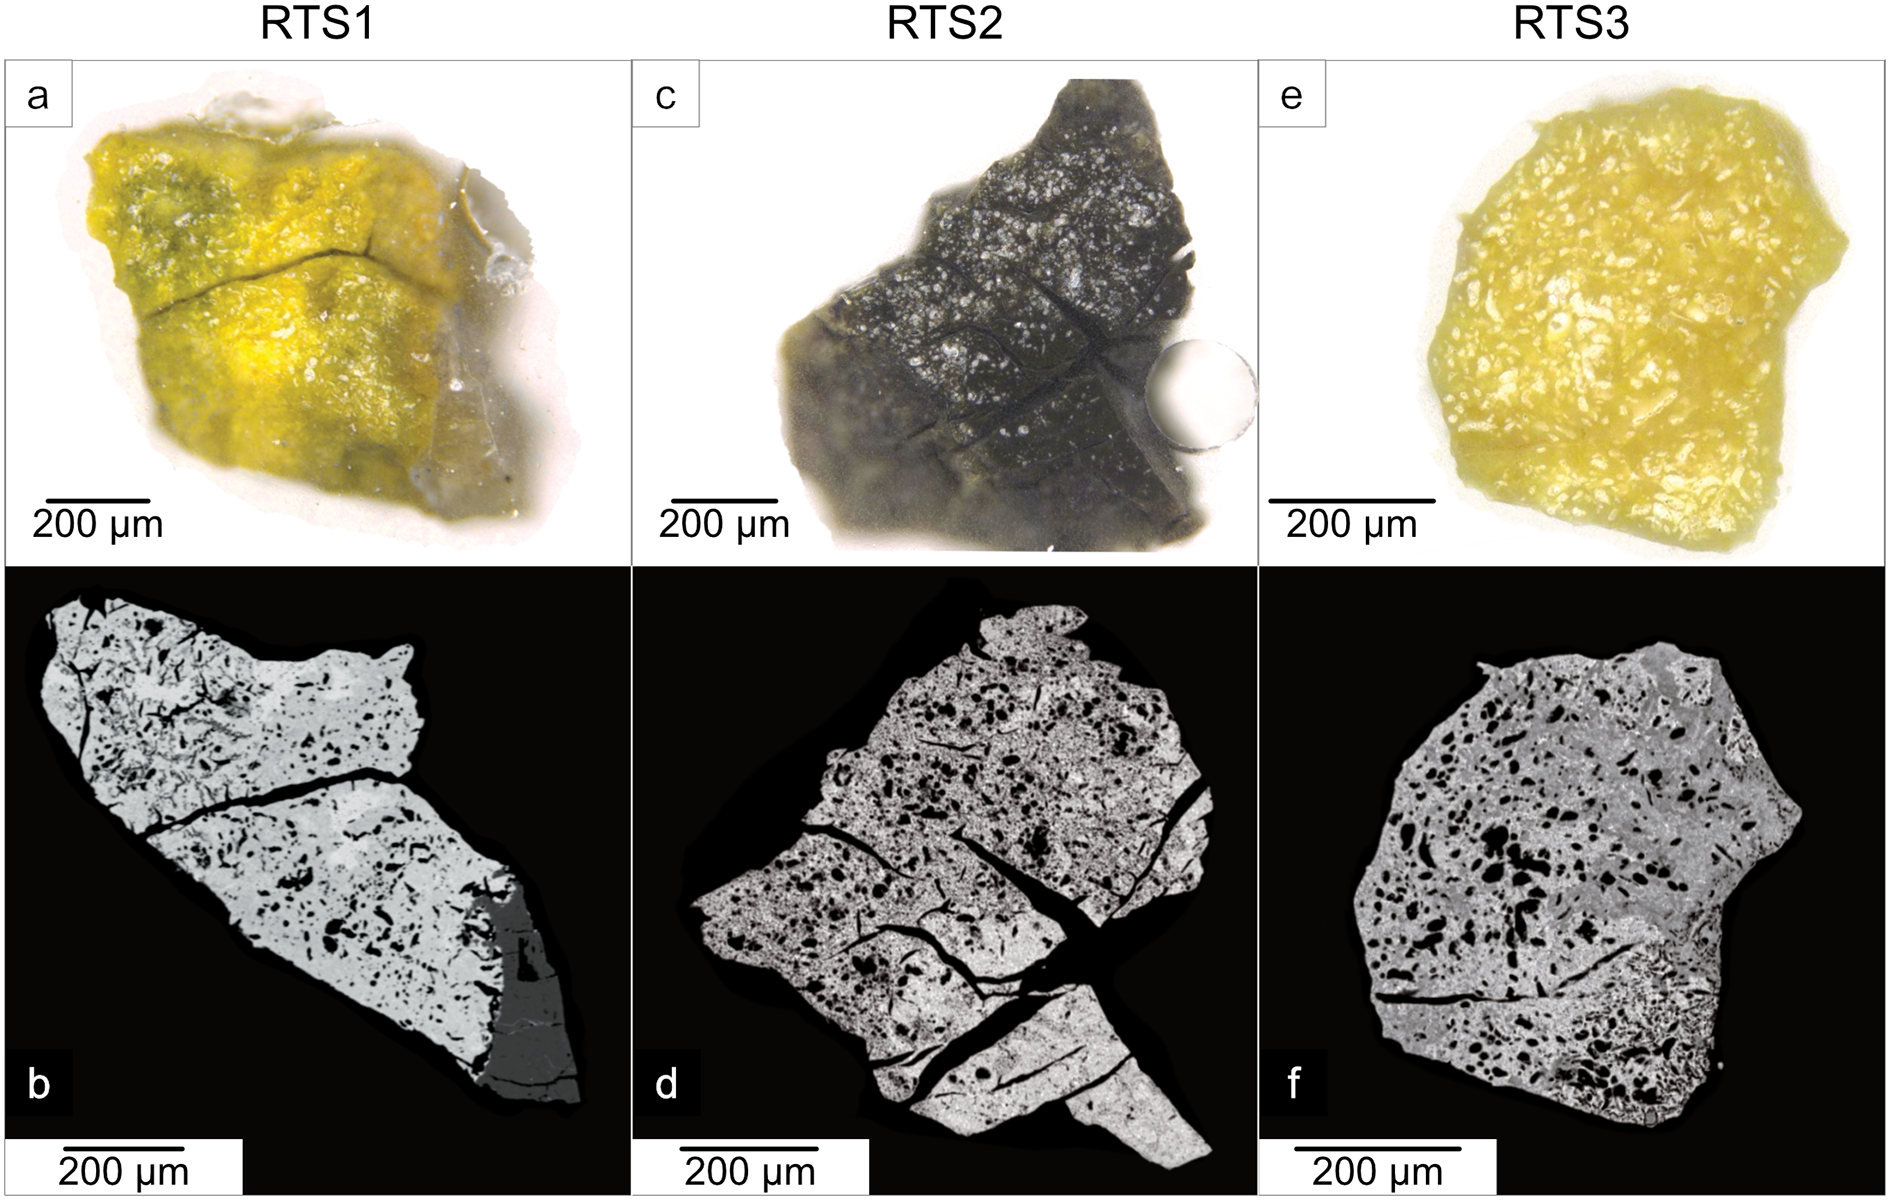
Heat-treated grains RTS1, RTS2 and RTS3 are shown in Fig. 6. After the heat treatment, all areas including the initially black areas in MTS1 (Fig. 3a) turned yellow (Fig. 6a). The Fe-rich MTS2 (Fig. 3c) sample turned black (Fig. 6c). The MTS3 grain acquired a uniform yellow colour after the heating.
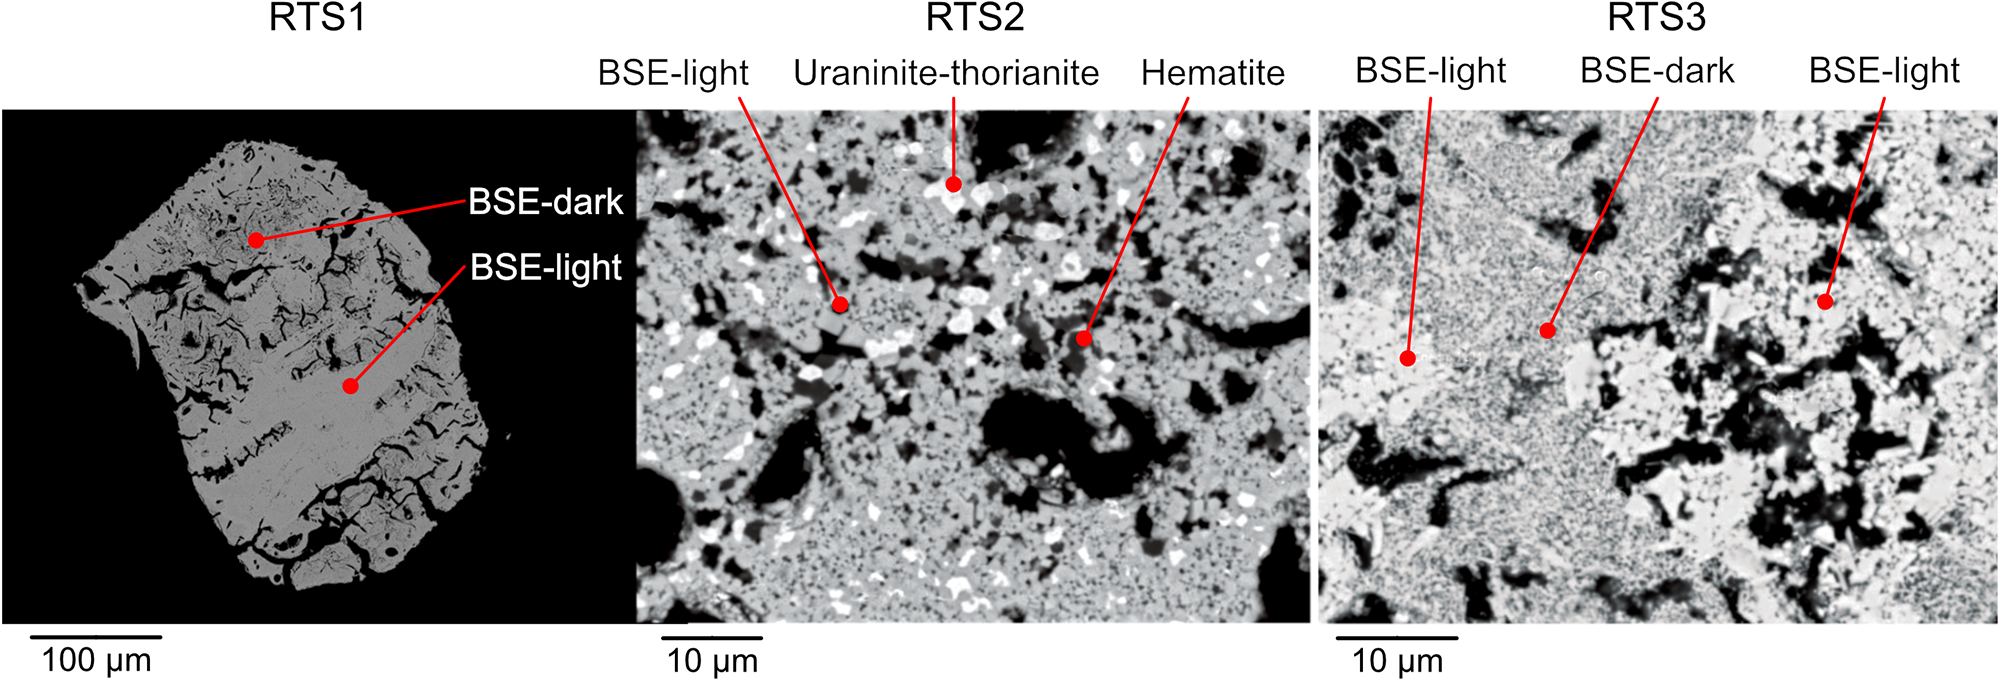
Photographs (a,c,e) and BSE images (b,d,f) depicting heat-treated RTS1, RTS2 and RTS3 grains.

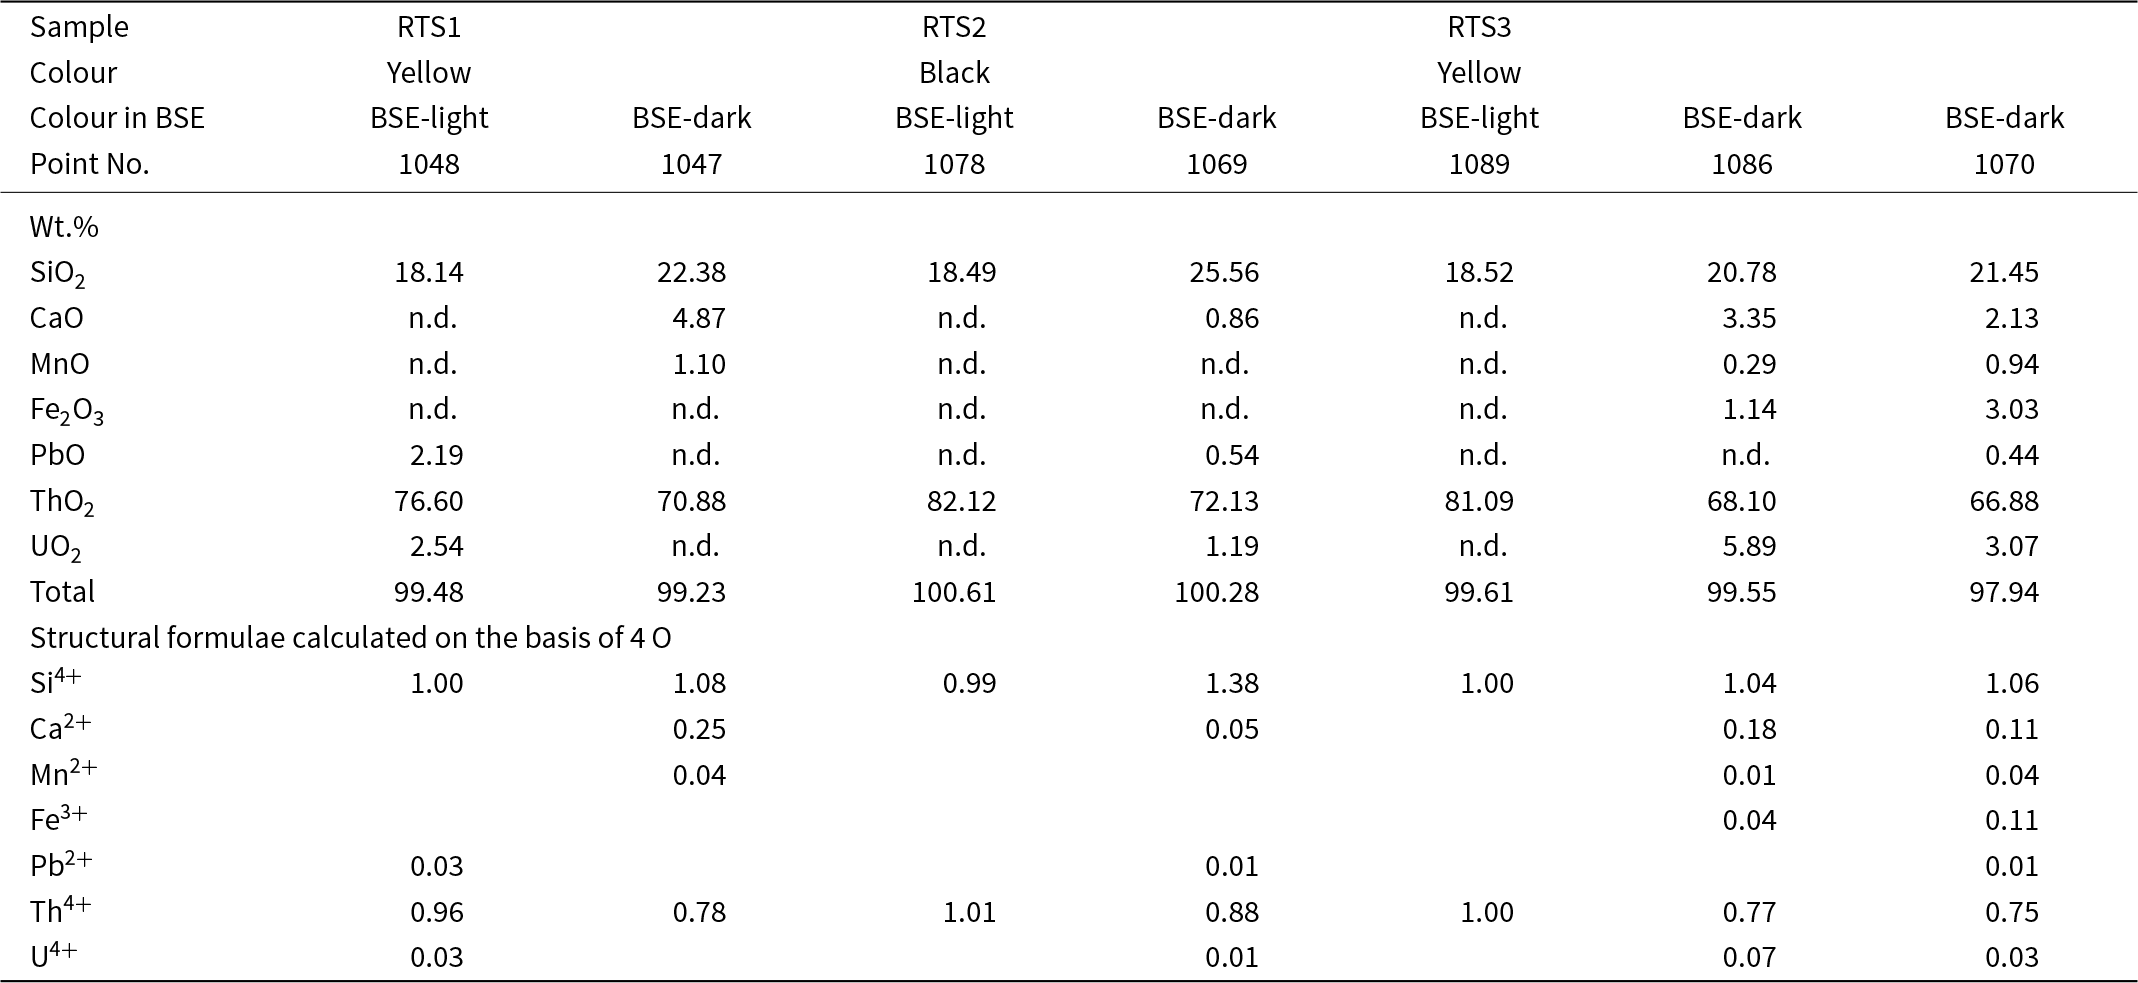
All the grains developed a porous and fissured texture (Fig. 6b,d,f) as a result of the dehydration and volume change. Thorium silicates recrystallised in all samples, as confirmed by the chemical analyses in Table 4. Nevertheless, two distinct types of recrystallised thorium silicates can be discerned in the BSE images: the first type is uniform and manifests as light-grey plain patches (further BSE-light), whereas the second type is characterised by a darker variegated fine-grained matrix (further BSE-dark), as depicted in Fig. 6.
Chemical composition (wt. %) and atoms per formula unit of the recrystallized RTS samples

Notes: n.d. – not detected.
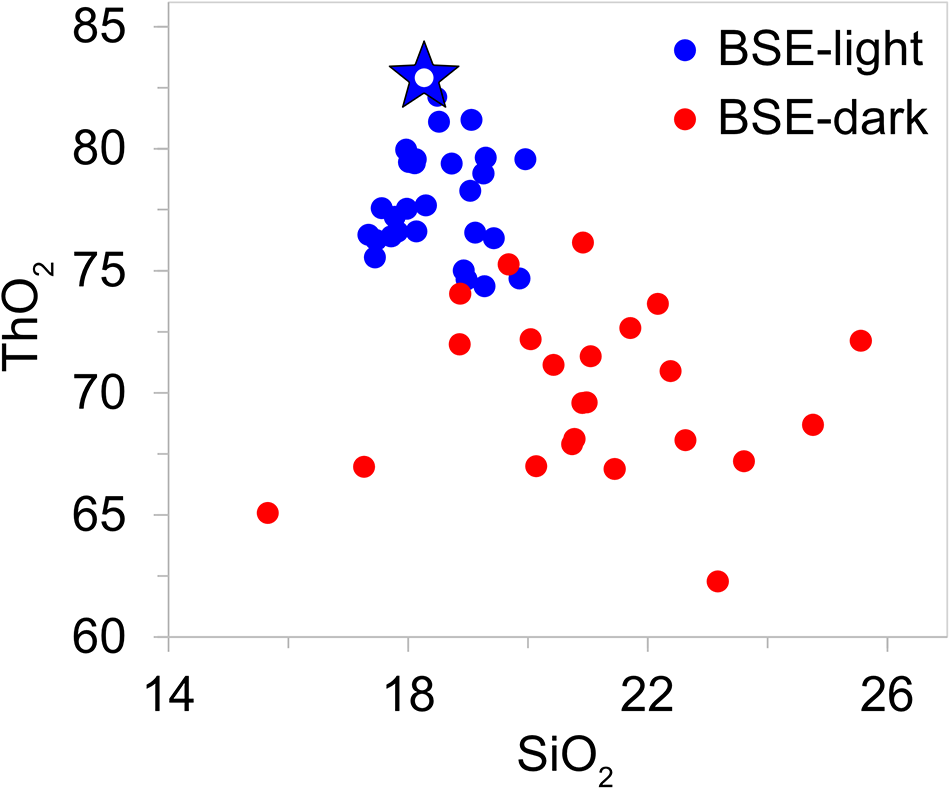
The compositional variations of SiO2 vs. ThO2 are plotted in Fig. 7, demonstrating that BSE-light areas are close to the ideal ThSiO4. In Fig. 7, a star-shaped symbol represents the ideal ThSiO4, with ∼82 wt.% ThO2 and 18 wt.% SiO2 (Table 4, point 1089). The results from the BSE-light compositions cluster closely to the ideal ThSiO4, whereas those analyses from BSE-dark are dispersed and exhibit lower ThO2 content.
Thorium silicates in three samples have recrystallised with a similar texture. Two types of recrystallised thorium silicates can be observed in all samples – BSE-light and BSE-dark. The abundant uranium and iron are crystallised in phases such as uraninite and hematite.

MTS2 exhibits elevated levels of uranium and iron, which are not fully incorporated into the thorium silicate phases subsequent to heat treatment. Alongside the crystallised thorium silicates (thorite and huttonite), the abundant uranium oxides with fluorite-type structure (see PXRD section below) appear as bright spots in the BSE image (Fig. 8) and represent uraninite–thorianite solid-solution phases. Meanwhile, the iron oxides (Fig. 8), have crystallised separately in the form of hematite.
Compositional variations of thorium silicates in wt.% in RTS samples in the areas appearing light-grey and dark-grey in BSE images. The star-shaped symbol represents the ideal ThSiO4 composition.

Raman spectroscopy
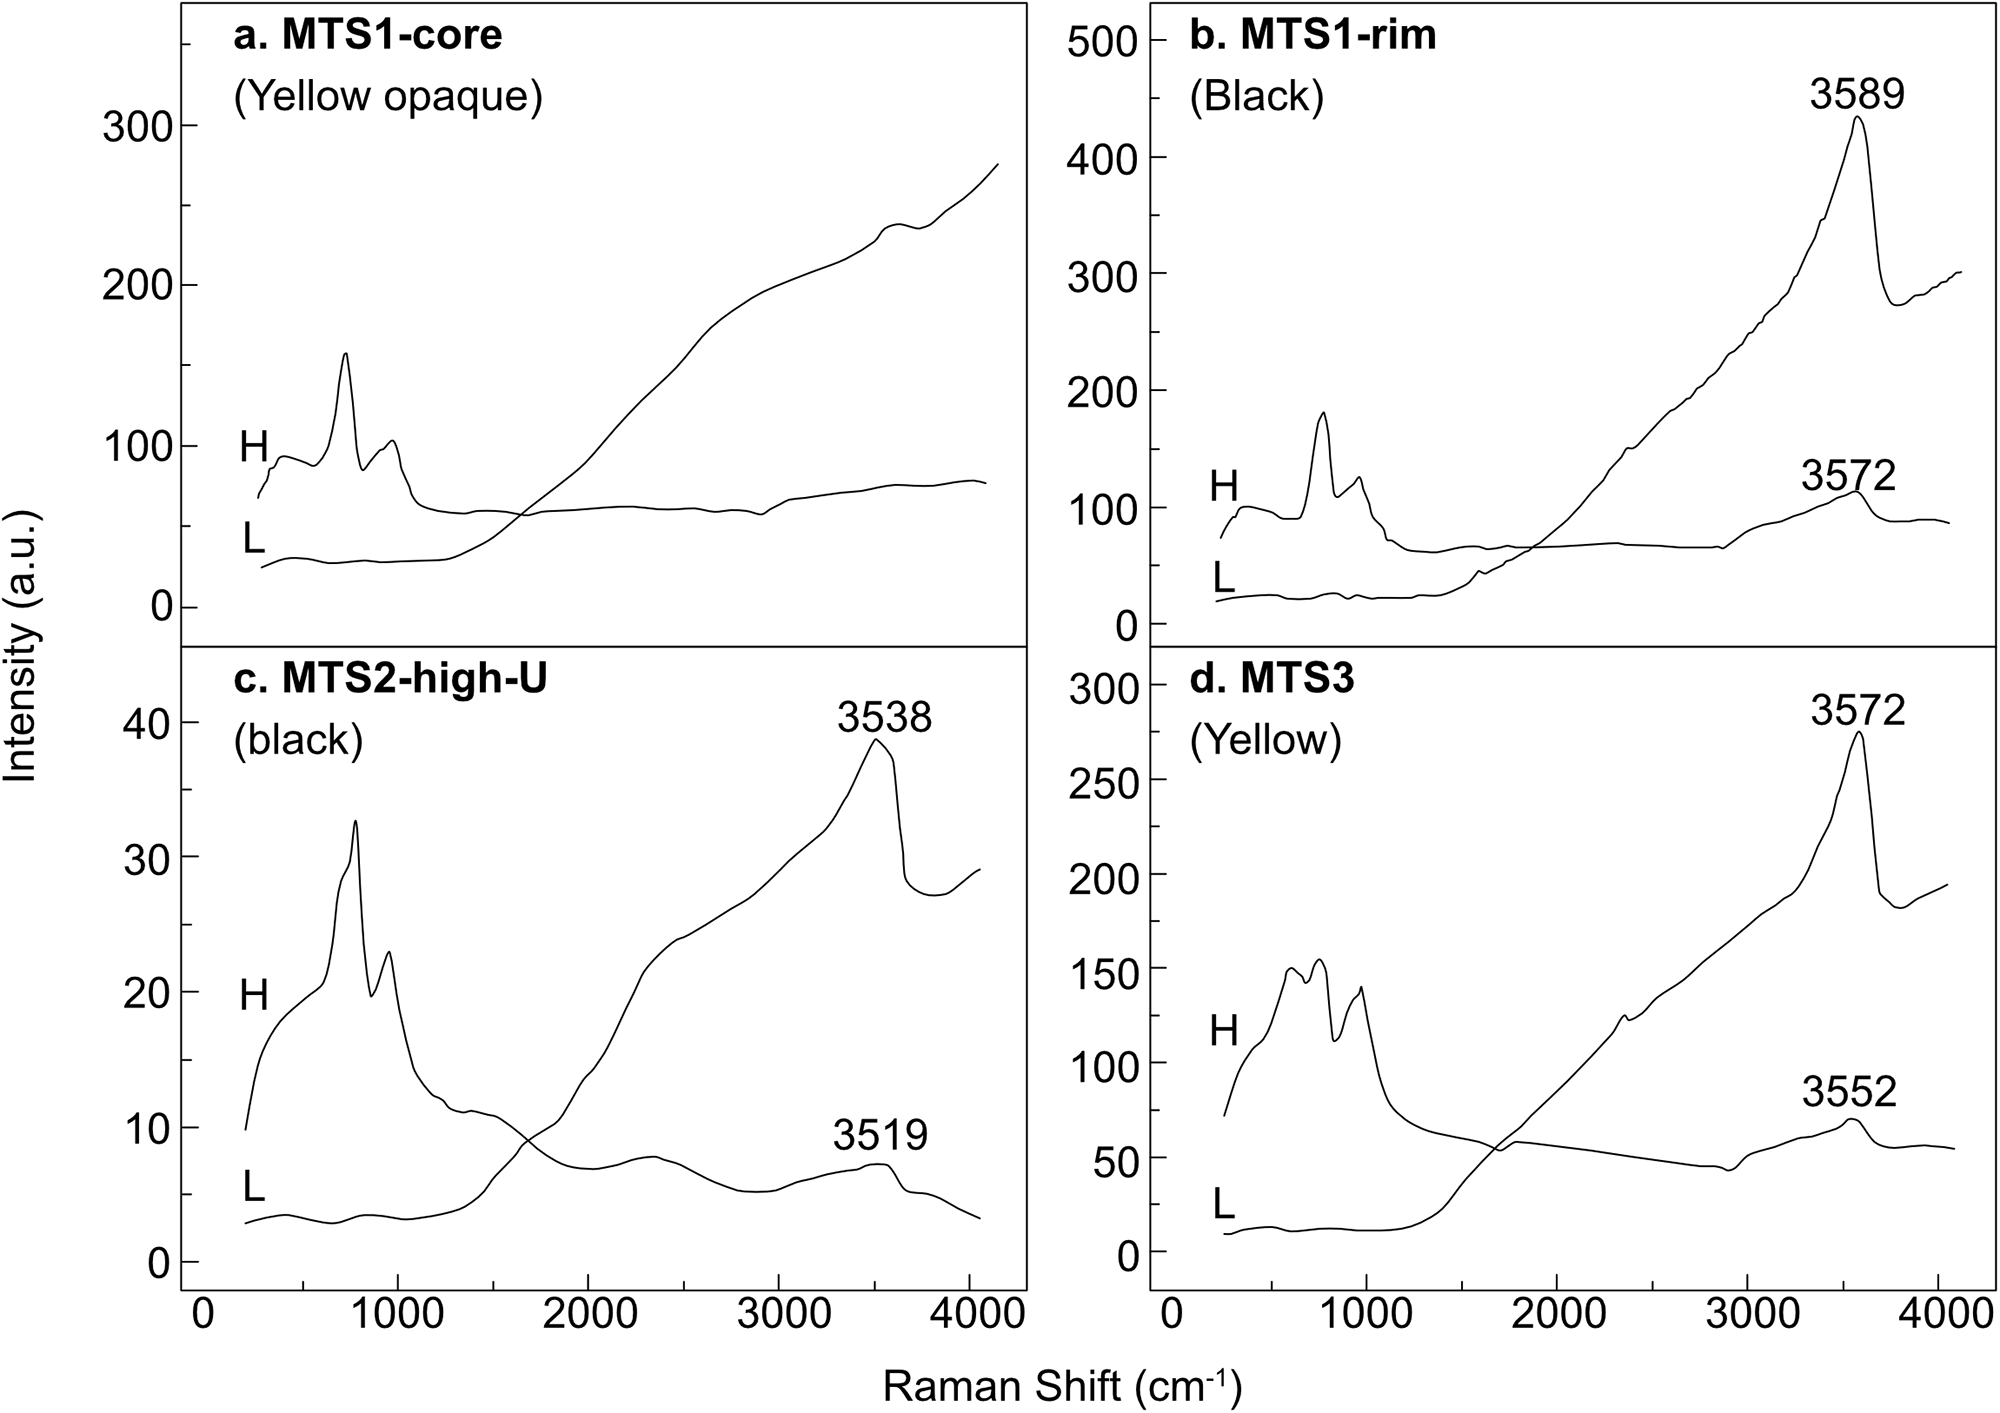
Raman spectra for MTS and RTS grains are shown in Figs 9 and 10, respectively. The spectra of the metamict samples lack well-defined peaks, showing only broad bands. Bands at ∼ 3500 cm–1 (Fig. 9) are assigned to stretching vibrations of OH groups and H2O molecules, confirming hydroxylation and hydration. The bending modes of water molecules are usually located at ∼1600 cm–1 (Kolesov, Reference Kolesov2006; Strzelecki et al., Reference Strzelecki, Barral, Estevenon, Mesbah, Goncharov, Baker, Bai, Clavier, Szenknect, Migdisov, Xu, Ewing, Dacheux and Guo2021), they are not observed in the experimental spectra, probably due to the polarisation direction. Reference spectra for uranium- and thorium-containing compounds in Fig. 10 are from: huttonite (Jin and Soderholm, Reference Jin and Soderholm2015, laser 532 nm, synthetic sample); thorite (Clavier et al., Reference Clavier, Szenknect, Costin, Mesbah, Poinssot and Dacheux2014, laser 532 nm, synthetic sample; hematite from heated goethite (de Faria and Lopes, Reference de Faria and Lopes2007, laser 632 nm); uranium-containing thorianite from Belafeno, Malagasy Republic (Jégou et al., Reference Jégou, Caraballo, Peuget, Roudil, Desgranges and Magnin2010, laser 532 nm); R-CaUO4 (Liegeois-Duyckaerts, Reference Liegeois-Duyckaerts1977, laser 633 nm, synthetic rhombohedral calcium uranate); uranophane from Grafton County, New Hampshire, USA (Stark and Noller, Reference Stark and Noller2022, laser 514 nm, natural mineral sample).
Raman spectra of metamict samples obtained using 325 nm laser. Spectra designated ‘H’ were obtained after the application of the diffraction grating at 1800 gr/mm. ‘L’ spectra were obtained at 600 gr/mm.

Raman spectra of metamict thorium silicate samples: almost anhydrous ThSiO4 from MTS1-core (325 nm laser); ThSi(O,OH)4·nH2O from MTS1-core (325 nm laser); hydrated ThSi(O,OH)4·nH2O with high U-content from MTS2-high-U (325 nm laser); Fe-rich ThSi(O,OH)4·nH2O from MTS2-high-Fe (325 nm laser); ThSi(O,OH)4·nH2O from MTS3 (325 nm laser). Above, the Raman spectra for the heated samples are shown: RTS1 (532 nm laser); RTS2 (532 nm laser); and RTS3 (532 nm laser). The reference spectra are detailed in the experimental section: Ht = huttonite, Thr = thorite, Hem = hematite, Tho = thorianite, Urn = uraninite, CaUO4-R = rhombohedral calcium uranate, Urp-α = uranophane-α.

All bands in metamict samples overlap thus complicating assignments. The main peaks are observed at ∼680, 800 and 960 cm–1 (Fig. 10). The bands between 680 and 800 cm–1 are primarily attributed to symmetric stretching vibrations of (UO2)2+, commonly observed in uranophane at ∼800 cm–1 (Frost et al., Reference Frost, Čejka, Weier and Martens2006). This band may shift to a lower frequency due to elongation of the U–O bonds, similar to the symmetric stretching of the uranyl ion in rhombohedral calcium uranate at ∼696 cm–1, as noted by Liegeois-Duyckaerts (Reference Liegeois-Duyckaerts1977). The bands near 960 cm–1 are assigned to (SiO44–) vibrations, typical in uranophane (symmetric stretching ν1 at 970 cm–1), huttonite (asymmetric stretching ν3 at 900 cm–1), and thorite (asymmetric stretching ν3 at 920 cm–1), as reported by (Frost et al., Reference Frost, Čejka, Weier and Martens2006; Clavier et al., Reference Clavier, Szenknect, Costin, Mesbah, Poinssot and Dacheux2014; Jin and Soderholm, Reference Jin and Soderholm2015).
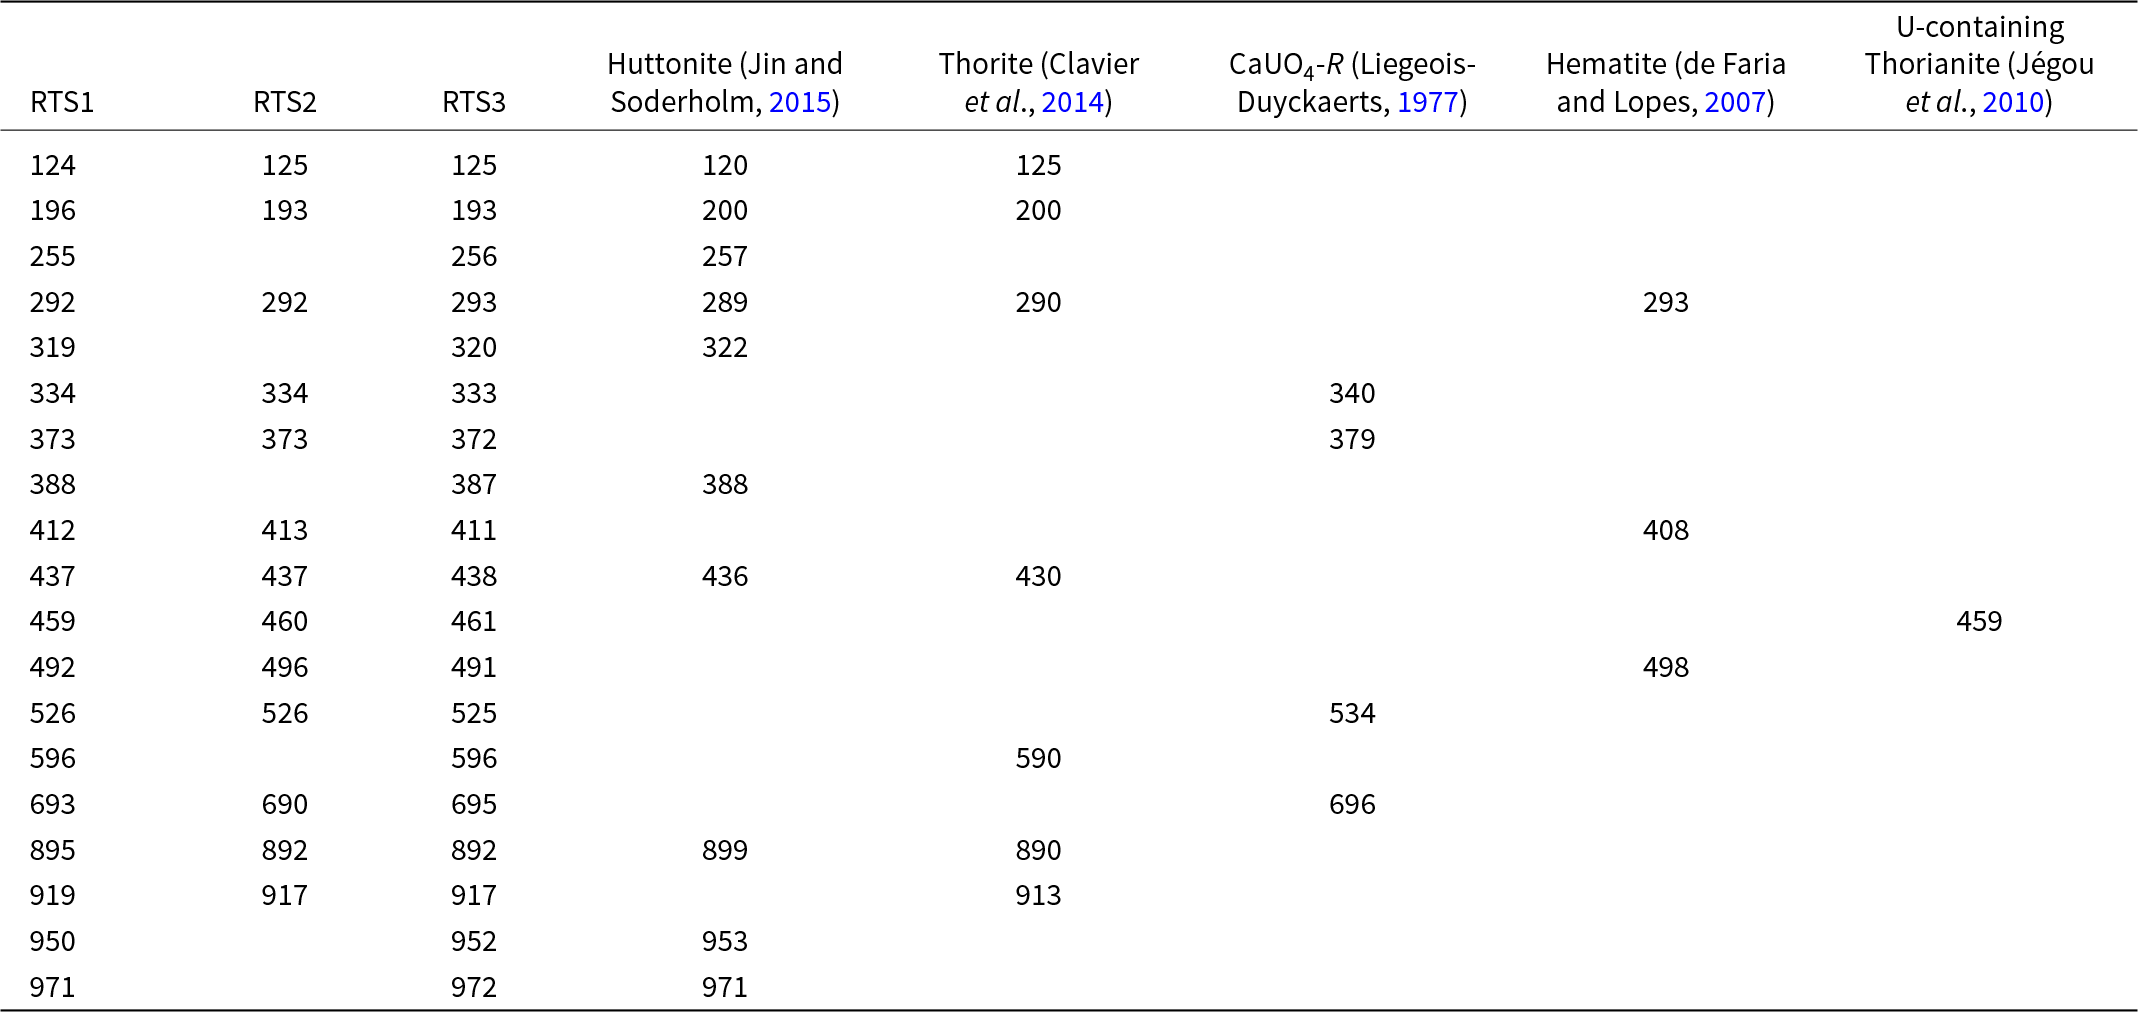
Raman spectra of heat-treated samples RTS1, RTS2 and RTS3 reveal the presence of several phases: huttonite, thorite and rhombohedral CaUO4 (Fig. 10). Minor phases such as hematite and thorianite are also identified. Table 5 lists the experimental peak positions in comparison with reference data. Thorite is distinguished by Raman bands at 290, 430, 890 and 913 cm–1, while the huttonite phase exhibits characteristic bands at 436, 899, 953 and 971 cm–1. Rhombohedral calcium uranate is recognised by intensive peaks at 534 and 690 cm–1. Additionally, the peaks at 293 and 408 cm–1 are observed, which is characteristic for hematite. A peak at 459 cm–1 can be tentatively assigned to Th/U–O vibrations in a fluorite-type structure (Zaitsev et al., Reference Zaitsev, Chakhmouradian, Siidra, Spratt, Williams, Stanley, Petrov, Britvin and Polyakova2011).
Observed bands (cm–1) in Raman spectra of RTS1, RTS2 and RTS3 in the range 100–1000 cm–1 and the reference spectra for crystalline huttonite, thorite and rhombohedral CaUO4

High-temperature powder X-ray diffraction
High temperature X-ray diffraction was performed on four powder samples: MTS1-midst, MTS1-rim, MTS2 and MTS3. Powdered sample MTS2 represents a mixture of MTS2-high-U and MTS2-high-Fe.
The crystallisation temperatures of the main phases observed during heating are listed in Table 6. The crystallisation of thorite starts in the range 420–480°C, whereas the emergence of huttonite peaks occurs at 870–930°C (Fig. 11).
Evolution of the metamict MTS thorium silicates [MTS1-midst – (a), MTS1-rim – (b), MTS2 – (c), MTS3 – (d)] into recrystallised RTS thorium silicates and various by-product phases upon heating. Reference data utilised: huttonite (Taylor and Ewing, Reference Taylor and Ewing1978), thorite (Taylor and Ewing, Reference Taylor and Ewing1978), Pt (Davey, Reference Davey1925), rhombohedral CaUO4 (Loopstra and Rietveld, Reference Loopstra and Rietveld1969), fluorite (Flr.)-5.7 (Clausen et al., Reference Clausen, Hayes, MacDonald, Schnabel, Hutchings and Kjems1983), fluorite (Flr.)-5.6 (Brauer and Gradinger, Reference Brauer and Gradinger1950), fluorite (Flr.)-5.4 (Shelly et al., Reference Shelly, Schweke, Danon, Rosen and Hayun2023).

Crystallisation temperatures of the main phases observed upon heating of the MTS samples using HTXRD. The observed fluorite-type phases are labelled with the value of the a unit-cell parameter

* The temperature ranges where ‘fluorite-5.7’ exists are given.
Several by-product cubic phases with a fluorite-type structure form upon heating. This correlates with chemical analysis results showing the formation of some uranium oxides after the heat treatment, particularly uraninite–thorianite solid solutions. For clarity, we differentiate these phases by labelling each with the value of the a parameter. The fluorite-type phases differ in unit-cell volume due to the substitution of Th and U by Ce, Pb, Ca, Fe, Mn and rare earth elements.
Whereas ‘fluorite-5.7’ appears at ∼810–870°C in RTS1-midst, MTS2 and MTS3, a smaller phase ‘fluorite-5.6’ starts to crystallise at 870°C in MTS1-rim (Fig. 11). These two phases are close to ideal thorianite (a = 5.69 Å, Clausen et al., Reference Clausen, Hayes, MacDonald, Schnabel, Hutchings and Kjems1983) and (Th0.8La0.2)O1.90 (a = 5.62 Å, Brauer and Gradinger, Reference Brauer and Gradinger1950) in terms of the a unit-cell parameter. In MTS2, ‘fluorite-5.4’ emerges at ∼1000°C and persists throughout the heating process.
Upon further temperature rise to 1200°C, ‘fluorite-5.7’ decomposes in all samples studied, whereas ‘fluorite-5.6’ in MTS1-rim and ‘fluorite-5.4’ in MTS2 remains after cooling. It can be seen that these three cubic phases do not play the same role or behave the same way in the reaction. ‘Fluorite-5.7’ is first formed which further reacts with SiO2 to form a silicate as the temperature rises. ‘Fluorite-5.6’ and ‘fluorite-5.4’, on the other hand, accommodate certain abundant elements and become a by-product of the reaction. ‘Fluorite-5.6’ may incorporate ions smaller than Th, such as U and Ca, which could lead to a reduction in the a unit-cell parameter value. The chemical composition of ‘fluorite-5.4’ remains uncertain, but it is likely to contain significant amounts of Ca and Pb. The Rietveld analysis results of the cooled polycrystalline sample are given in Table 7.
Phase composition of RTS samples after cooling. The amount of each phase is given in wt.%. E.s.d is ∼3%

Rietveld analysis also reveals that a phase with the structure of rhombohedral CaUO4 (Loopstra and Rietveld, Reference Loopstra and Rietveld1969) forms in all samples, except for MTS1-rim. The uranate phase was not observed by the electron microprobe, probably because its crystal size was too small to detect a distinct phase in the EPMA. Additionally, the element-distribution map (Fig. 13d, see below) shows calcium-rich phases filling the voids within Th-silicate matrix, thus causing the EPMA of the thorium silicate to show the calcium content.
After subsequent cooling, the primary phases are huttonite and thorite. The total amount of the crystallised ThSiO4 (huttonite and thorite) is generally in agreement with the initial concentration of thorium oxide in the MTS samples (Table 3). The MTS1-midst has the highest content of thorium oxide, leading to the maximum amount of the crystallised ThSiO4 phases (huttonite and thorite) upon the crystallisation in RTS1-midst. In contrast, the MTS2 exhibits the lowest thorium content and exhibits the smallest quantity of the crystallised ThSiO4 phases, as listed in Table 7. MTS1-rim possesses the lowest amount of UO2, resulting in the absence of rhombohedral CaUO4 formation upon the crystallisation process. MTS2 has the highest iron content, leading to the crystallisation of hematite in the heated sample. The Rietveld analysis results, provided in Table 7, confirms this, with hematite appearing as dark spots in the BSE image (Fig. 8).
Electron back-scatter diffraction
Grains from metamict samples did not generate any diffraction, whereas all heat-treated RTS grains produced EBSD patterns. The patterns show a good match for huttonite and thorite structures (Fig. 12c,e). Obtained patterns show a reasonable mean angle deviation (MAD) of 0.52° and 0.38°, respectively, with the highest possible number of matching bands, whereas the values <1° are considered a good match. In Fig. 12d,f, the pole figures shows the distribution density map projections of crystallographic direction of mineral orientation relative to the sample surface.
(a) The photograph and BSE image of the RTS1-midst grain. (b) Phase map of the selected area is shown to the right. Huttonite is blue and thorite is red. (c) EBSD patterns for thorite and (e) huttonite, and (d,f) overall pole figures for respective phases.

Both RTS1-midst and RTS1-rim samples are fine-grained aggregates with the crystallite size not exceeding 2 µm. The presence of both huttonite and thorite is evident in all samples (Figs 12 and 13). EBSD phase analysis indicates a high prevalence of huttonite after heating within the RTS1-midst grain (Fig. 12). In contrast, the RTS1-rim represents an intergrowth mixture of huttonite and thorite, with almost 50:50 ratio of both minerals crystallised (Fig. 13). Additionally, element-distribution mapping revealed the distribution of Ca (Fig. 13c,d), approving the presence of Ca-rich uraninite and rhombohedral CaUO4 in accordance with the results of PXRD and Raman spectroscopy.
(a) The photograph and BSE image of the RTS1-rim grain. The areas highlighted with white rectangles indicate areas for EBSD and elemental map. (b,c) Phase maps of two selected areas. Huttonite is blue, and thorite is red. (d) The CaKα element-distribution map of the selected area ‘c’.

Thermal analysis
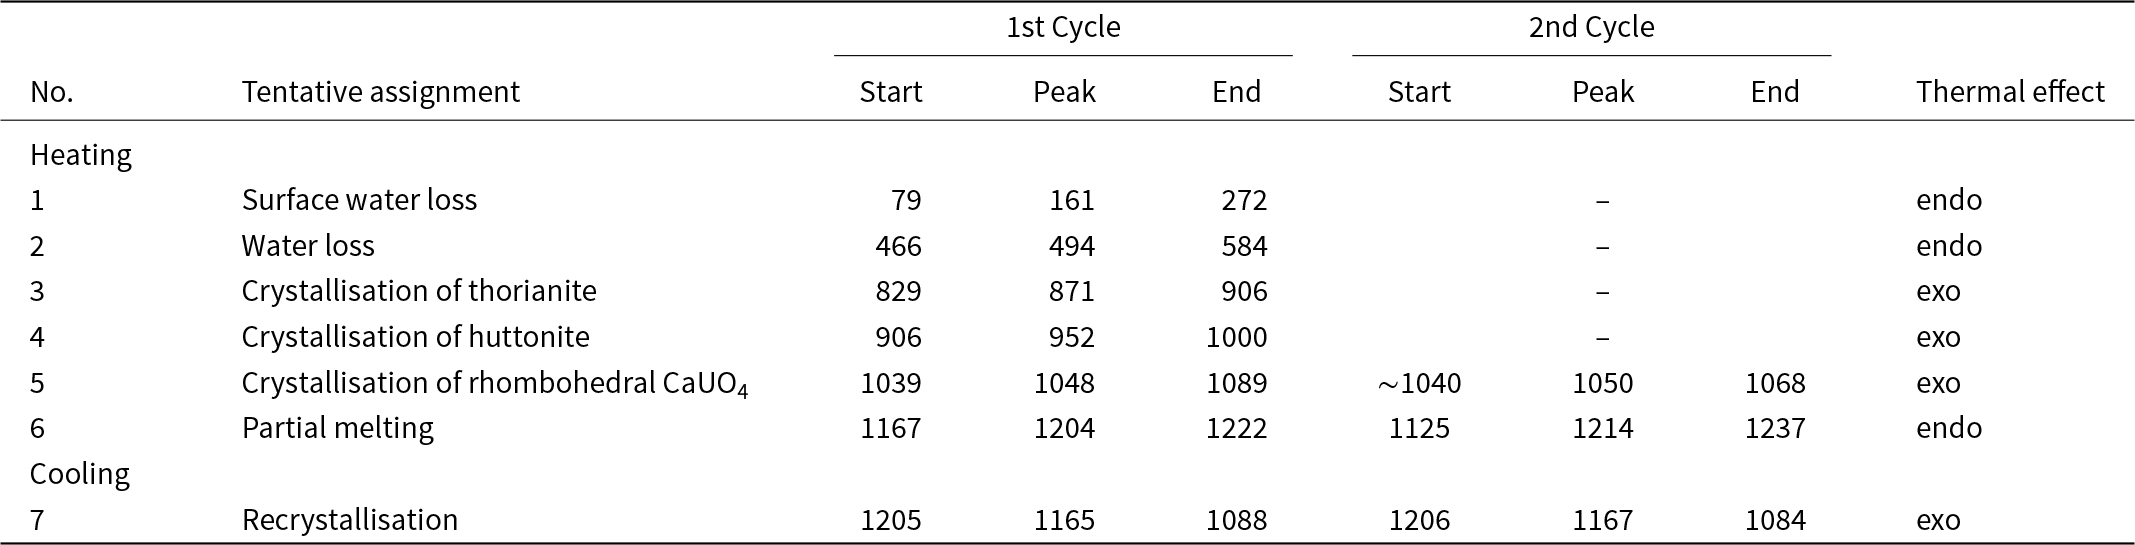
Thermal analysis was performed only for the most homogeneous sample MTS3. Differential scanning calorimetry (DSC) curves were first obtained for the metamict sample (1st cycle). After the crystallisation, the thermal analysis was repeated (2nd cycle) using the same pellet (RTS3) (Fig. 14). Observed effects are summarised in Table 8.
Differential scanning calorimetry (DSC) curves obtained for MTS3 sample (red solid line) and RTS3 sample (red dashed line) upon heating and corresponding curves obtained upon cooling (blue solid and dashed line, respectively. Colour changes of pellets are shown in photographs above.

Thermal effects (in °C) observed in MTS3 and subsequently in RTS3 samples

Two endothermal peaks are observed in the temperature range below 600°C, which can be attributed to dehydration and dehydroxylation. Subsequently, two exothermal peaks emerge at 871°C and 952°C and correspond to the crystallisation of thorianite and huttonite. The thermal effect observed at 1048°C is due to the crystallisation of rhombohedral CaUO4. No peaks corresponding to the crystallisation of thorite are observed. This phenomenon may be caused by several factors: (1) the exothermal annealing of thorite may be compensated by the endothermal dehydroxylation process; and (2) the structural restoration process of the thorite phase begins after dehydration, but it proceeds very slowly. This results in a lack of a prominent peak in the DSC curve.
The DSC curve for the RTS3 sample does not exhibit any significant thermal effects.
Thermal expansion of huttonite and thorite
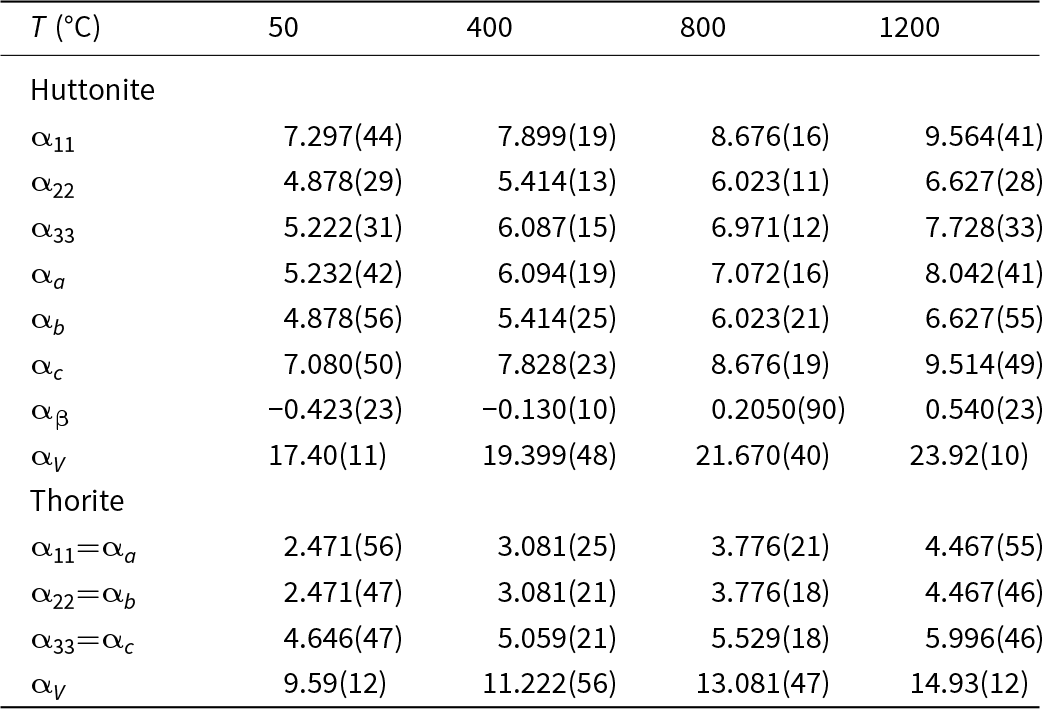
High-temperature X-ray diffraction on crystalline samples RTS1-midst and RTS3 was performed. The coefficients of thermal expansion (CTE) obtained are listed in Table 9.
Coefficients of thermal expansion (CTE) values for thorite and huttonite for sample RTS1-midst. Values are in °C–1 and are multiplied by 10–6

Upon the temperature rise, the volume CTE increases from 9.47(13) to 14.93(12)×10–6 deg–1 for thorite, and from 16.25(11) to 24.75(23)×10–6 deg–1 for huttonite in the range of 25–1200°C. Projections of the figures of CTE for huttonite and thorite are given in Fig. 15.
Projections of the CTE for huttonite and thorite in the temperature range 25–1200°C.

Discussion and concluding remarks
Metamict samples pose a challenge for a comprehensive investigation to uncover all occluded processes pertaining to temperature rise and crystallisation. In our study, we have investigated three metamict thorium silicate samples, employing Raman, EPMA, PXRD, EBSD, DSC and HTXRD.
It is worth noting that MTS1 and MTS2 metamict samples are heterogeneous, whereas MTS3 does not reveal significant variations in composition. The chemical analyses show insufficient totals, implying that all the samples studied are heavily hydrated and hydroxylated. Among all grains of the metamict samples, MTS1-core shows the lowest degree of hydration and alteration. The composition variation indicates that the degree of alteration increases from the core to the rim. MTS3 appears as a hydrated and hydroxylated thorium silicate, with a chemical composition similar to the altered regions of MTS1. MTS2 is differentiated from the other two samples by its elevated content of iron and uranium.
The EPMA study reveals element redistributions after heating in all the samples studied. MTS2 exhibits the highest U content. Upon heating, the solid solution of (Th,U)SiO4 exhibits a tendency to transform into uranium-depleted ThSiO4, with the majority of the U concentration occurring in the fluorite-type phase. Powder X-ray diffraction patterns indicate the emergence of cubic fluorite-type phases at ∼850°C, followed by a diminution in their content and the emergence of the rhombohedral CaUO4-type phase, which persists until 1200°C and subsequent cooling. The proposed mechanism for the formation is that during heating, amorphous material undergoes recrystallisation, which encompasses both the seeding stage and the crystal growth stage. This process results in the formation of chaotically oriented and fine-grained polycrystalline aggregates with elevated concentrations of Ca impurities on the grain boundaries. Trigonal calcium uranate, observed as a transformation product upon heating of the metamict sample, is a common accessory mineral of pyrometamorphic rocks (Upper Chegem Caldera, Russia; rocks of the Hatrurim Complex). As a result of the radioactive decay of uranium, trigonal calcium uranate is transformed into the disordered phase (CaU)O4 with the structure of the fluorite (uraninite)-type known as the mineral vorlanite (Galuskin et al., Reference Galuskin, Armbruster, Galuskina, Lazic, Winiarski, Gazeev, Dzierzanowski, Zadov, Pertsev, Wrzalik, Gurbanov and Janeczek2011).
The phase map of heat-treated grains shows a quenching texture. The main phases, thorite and huttonite, are proven to crystallise in fine sizes. Abundant elements crystallise in other phases, such as rhombohedral calcium uranate and uraninite–thorianite solid solution, filling the gaps between huttonite and thorite. Therefore, the crystallised thorium silicate does not show composition variation between RTS1, RTS2 and RTS3. The elemental redistribution resulting from recrystallisation indicates that the metamictisation of these samples cannot be reversed by annealing.
During in situ X-ray investigations, we observed the commencement of the crystallisation process of thorite from the metamict sample at temperatures as low as ∼400°C. It is noteworthy that there is no thorite crystallisation peak observed in the DSC curve. This process is blurred over a wide temperature range, according to HTXRD patterns. Thorite crystallisation temperatures were previously reported in the range 715–950°C for mineral samples (Pabst, Reference Pabst1952; Eyal et al., Reference Eyal, Lumpkin and Ewing1986). The phase transition of thorite into huttonite was reported previously in the range 715–1400°C (Pabst, Reference Pabst1952; Finch et al., Reference Finch, Harris and Clark1964; Mazeina et al., Reference Mazeina, Ushakov, Navrotsky and Boatner2005). The crystallisation temperature of huttonite revealed by in situ HTXRD in this work is ∼900°C. The observed thorite–huttonite phase transition is sluggish, and a wide temperature range is observed where both polymorphs can coexist. Impurities in the mineral samples may stabilise the thorite phase (Lumpkin and Chakoumakos, Reference Lumpkin and Chakoumakos1988; Meldrum et al., Reference Meldrum, Boatner, Zinkle, Wang, Wang and Ewing1999a, Reference Meldrum, Zinkle, Boatner and Ewing1999b). Hence, it may contribute potentially to lowering the phase transition temperature.
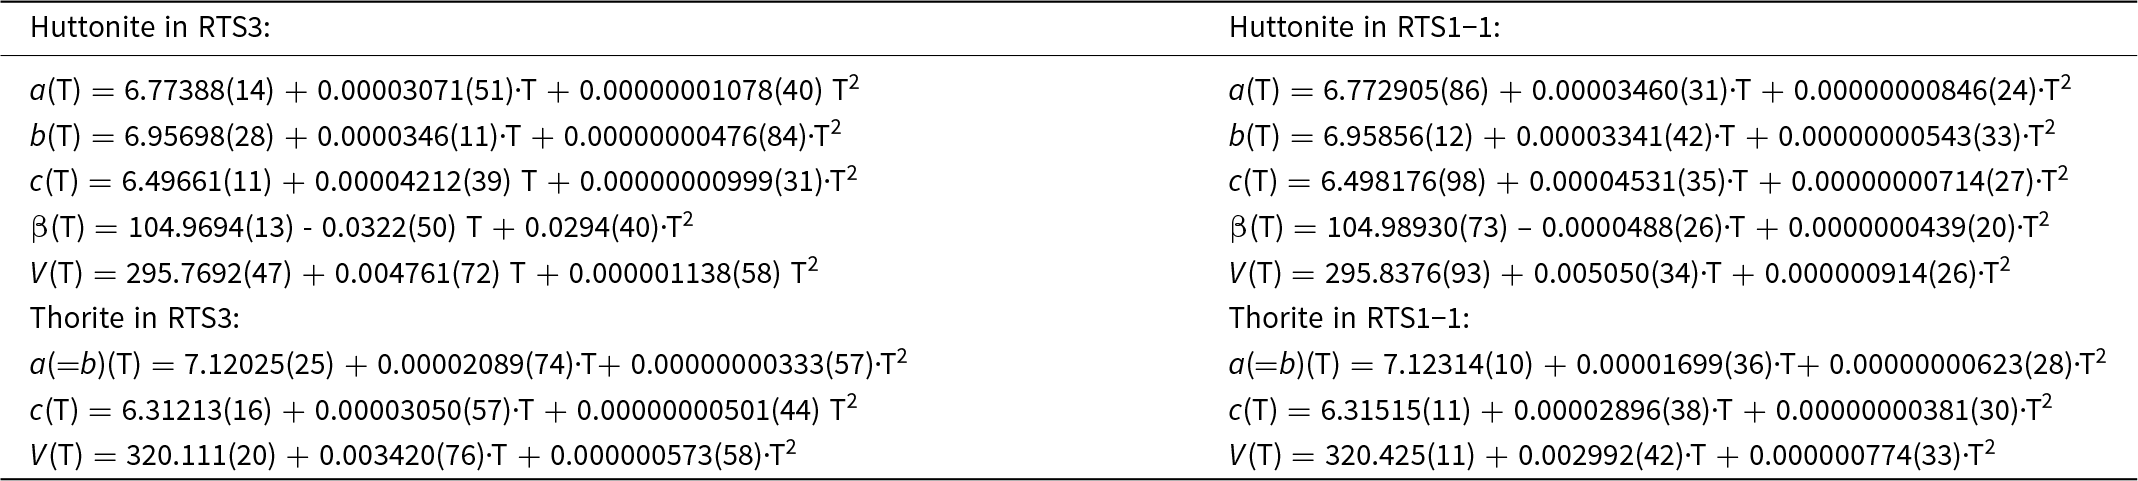
The thermal expansion of huttonite crystallised from the natural metamict thorium silicate sample is comparable to that observed previously for the synthetic ones (Knyazev et al., Reference Knyazev, Komshina and Savushkin2017). In this study, we conducted HTXRD by employing a smaller temperature step of 30°C. The increasing trend of the unit-cell parameters of huttonite (Fig. 16) can be described by the second-order polynomials (see Appendix, Table A1). The average αV ,huttonite = 20.66 × 10⁻⁶ deg–1 for the temperature range 25–1200°C. This value is significantly smaller than that observed for isostructural monazite (αV =27.4 × 10⁻⁶ deg–1, 25–700°C) (Asuvathraman and Kutty, Reference Asuvathraman and Kutty2014).
Temperature dependences of the unit-cell parameters and volume for thorite and huttonite from RTS1-midst and RTS3 samples.

Recent calculations of the thermal expansion of synthetic thorite by Knyazev et al. (Reference Knyazev, Komshina and Savushkin2017) and Strzelecki et al. (Reference Strzelecki, Barral, Estevenon, Mesbah, Goncharov, Baker, Bai, Clavier, Szenknect, Migdisov, Xu, Ewing, Dacheux and Guo2021) exhibit some discrepancies with each other, possibly attributable to methodological variations. The unit-cell parameters of thorite (Fig. 16) exhibit a linear trend upon heating. The thermal expansion of thorite shows the average αV ,thorite = 12.54 × 10⁻⁶ deg–1 in the temperature range 25–1200°C. It is similar to that one for the synthetic thorite (αV = 12.1 × 10⁻⁶ deg–1, 25–900°C) obtained earlier (Knyazev et al., Reference Knyazev, Komshina and Savushkin2017). Note, that the synthetic uranothorite has a significantly higher value of αV = 17.21× 10⁻⁶ deg–1 in the temperature range 400–800°C (Strzelecki et al., Reference Strzelecki, Barral, Estevenon, Mesbah, Goncharov, Baker, Bai, Clavier, Szenknect, Migdisov, Xu, Ewing, Dacheux and Guo2021). The significant amount of uranium in thorite structure increases the thermal expansion. In general, the thermal expansion of thorite is lesser than that of huttonite. However, both thorite and huttonite are more stable than perovskite (αV = 38.31 × 10⁻⁶ deg–1, 25–1000°C) and zirconolite (αV = 30.15 × 10⁻⁶ deg–1, 25–1000°C) (Ball et al., Reference Ball, Thorogood and Vance1992) used for HLW immobilisation.
Supplementary material
The supplementary material for this article can be found at https://doi.org/10.1180/mgm.2024.88.
Acknowledgements
We thank two anonymous reviewers and Associate Editor Irina Galuskina for many useful remarks that significantly improved initial version of the manuscript. Technical support by the X-ray diffraction and Geomodel SPbSU Resource Centers is gratefully acknowledged. This work was financially supported by the Russian Science Foundation through the grant 24-63-00006.
Competing interests
The authors declare none.
Appendix
The following second-order polynomials were employed to fit the temperature dependences of the crystalline huttonite and thorite in the range 25–1200°C