

The Norwegian government operates an online database that contains detailed information about all citizens’ income, wealth and tax contributions – which any Norwegian citizen can access (Norwegian Tax Administration, 2015). While social scientists’ first reaction to such radical transparency and opportunity for social comparison may be fear of the tearing of the social fabric, Norwegians seem to have survived the openness – and, notably, even have high tax morale (Lago-Peñas & Lago-Peñas, Reference Lago-Peñas and Lago-Peñas2010). While anecdotal, this example suggests that revealing incomes can be associated with increased support for contributing to the public good. Such preferences for spending on public goods such as social programmes or health care are based, at least in part, on beliefs about income and wealth inequality (Alesina & Angeletos, Reference Alesina and Angeletos2005; Oishi et al., Reference Oishi, Kesebir and Diener2011; Brown-Iannuzzi et al., Reference Brown-Iannuzzi2015; Kuziemko et al., Reference Kuziemko2015). Survey evidence suggests, however, that many people may not be aware of the true extent of inequality in their country (Norton & Ariely, Reference Norton and Ariely2011; Kiatpongsan & Norton, Reference Kiatpongsan and Norton2014; Davidai & Gilovich, Reference Davidai and Gilovich2015; Hauser & Norton, Reference Hauser and Norton2017). A lack of transparency of incomes could lead individuals to hold different preferences than they would have if income information were available to them, and this misinformation might, in turn, have downstream consequences.
We examine how invisible, or hidden, income inequality affects group-level outcomes and individual people's behaviours towards the richest and the poorest group members relative to when inequality is revealed. We hypothesised that revealing information about inequality might exert a substantial effect on behaviour: if people do not realise how little the poor have and how much the rich have, they may be less sympathetic to low contributions from those who cannot afford to give more and less likely to punish the rich for not contributing their ‘fair share’.
Previous research on cooperation has explored the determinants and consequences of such sanctioning behaviour (Fehr & Gächter, Reference Fehr and Gächter2002; Rand et al., Reference Rand2009; Crockett et al., Reference Crockett2014; Hauser, Nowak et al., Reference Hauser, Traulsen and Nowak2014; Hauser et al., Reference Hauser2016; Jordan et al., Reference Jordan2016; Krasnow et al., Reference Krasnow2016). Results typically reveal that low contributors are punished, while high contributors are rewarded. In these studies, all players typically receive identical endowments in each round, and this equality is common knowledge to all players; thus, the majority of these experiments, while highly informative regarding the maintenance of cooperation, shed little light on perceptions of and reactions to inequality. Indeed, only recently have scholars begun investigating inequality in the provisioning of public goods and social dynamics more generally (Anderson et al., Reference Anderson, Mellor and Milyo2008; Hauser, Traulsen et al., Reference Hauser, Nowak and Rand2014; Nishi et al., Reference Nishi2015; Gächter et al., Reference Gächter2017; for a full literature review, see Supplementary Material, Section 1.2, available online).
Building on this previous research, we introduce three novel features in order to explore the impact of people's recently demonstrated lack of knowledge (Kiatpongsan & Norton, Reference Kiatpongsan and Norton2014; Hauser & Norton, Reference Hauser and Norton2017) on public goods provisioning: (i) we experimentally vary whether the income distribution is hidden or revealed in order to explore the causal effect of knowledge of inequality on behaviour towards the rich and poor; (ii) we use income distributions that are extremely unequal (e.g., the actual US distribution) to explore behaviour towards the rich and poor under conditions reflective of real-world inequality; and (iii) we allow participants to either punish, reward or both punish and reward the poor and the rich in order to explore how these sanctions are utilised to address perceived inequity.
In Experiment 1, we randomly assign participants to one of two conditions in which they are either aware of donors’ incomes (the revealed condition) or unaware (the hidden condition). Based on income and donation distributions representative of the real world, we study participants’ reward behaviour towards a real donor. In Experiment 2, we randomly assign participants to different incomes – reflective of the income distribution of the USA – and then further randomly assign them to either the revealed or hidden condition; we examine sanctioning behaviour – both punishment and reward – towards other players in a repeated public goods game. In Experiment 3, we examine whether merit might play a moderating role: whereas in Experiment 2 incomes are assigned randomly, in the third experiment incomes are assigned based on task performance. We again assign participants to either the revealed or hidden condition and examine their decisions to punish and reward other players. Finally, in Experiment 4, we explore potential policy consequences, examining preferences for taxation policies: we use actual data on charitable contributions to public schools in New York in order to examine which school districts – wealthy or poor – people believe should be taxed more highly as a function of whether the incomes of those districts are hidden or revealed.
Across all four experiments, our results can be summarised as follows: when incomes were hidden, participants rewarded the richest group members for their seemingly high contributions while punishing the poorest for contributing apparently little. When incomes were revealed, however, participants reversed this behavioural pattern, such that they rewarded the poorest (for contributing a high relative amount of their small endowment) and punished the richest (for contributing a low relative amount of their large endowment).
Experiment 1
Methods
Participants (n = 315) were recruited on Amazon Mechanical Turk from the USA. Participants were told that they had to decide to which out of five donors – all of them previous participants in another study on Amazon Mechanical Turk – they would assign a $1.00 bonus payment. The donors were chosen so that their donation behaviour represented the actual distribution of US donors across five income ranges (Maryland CPA, Reference Maryland2016): on average, households donated $1874 (income under $25,000), $2594 ($25,000–$50,000), $2970 ($50,000–$75,000), $3356 ($75,000–$100,000) and $4130 ($100,000–$200,000) in 2014, the year with the latest available data. Participants were asked which one of the five donors should receive a $1.00 bonus payment. The decision was incentive-compatible: one participant was drawn at random and their decision implemented to pay the donor.
Participants were randomly assigned to one of two conditions. In the revealed condition, participants were told the donors’ average donations as well as their income ranges. Conversely, in the hidden condition, they saw the donation amounts only but not the income ranges. We expected participants in the hidden condition to reward the (unbeknownst to them richest) donor who donated the largest absolute amount of money in the past year, while we predicted a reversal of reward behaviour in the revealed condition, such that participants would reward the poorest donor who gave the highest percentage of their income to charity. See Supplementary Material, Section 2.2.1 for detailed methods.
Results
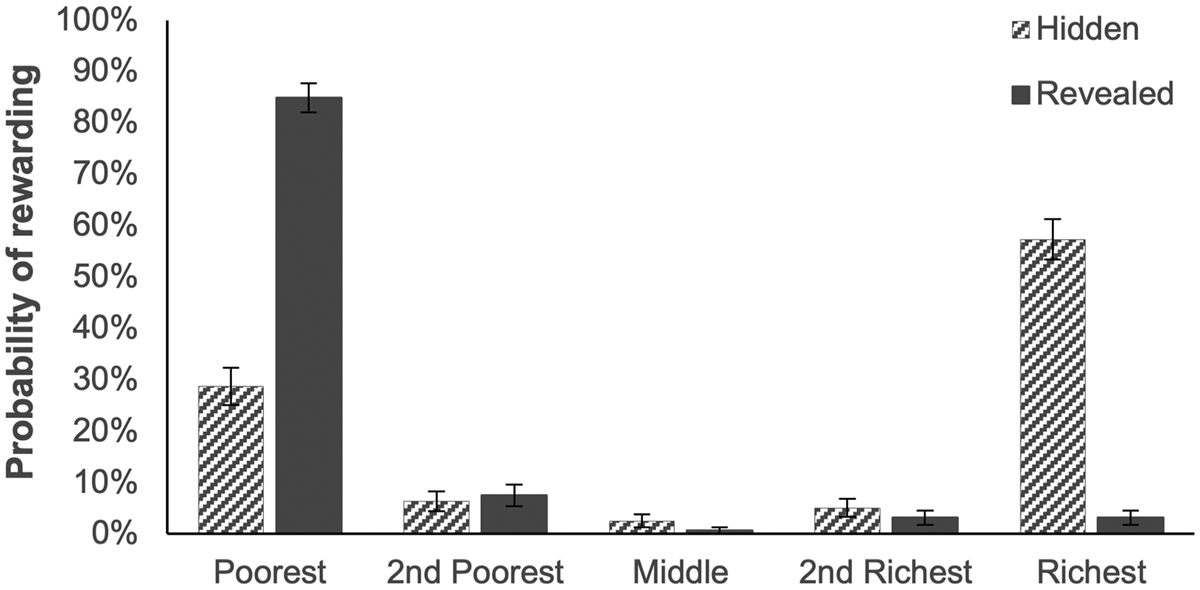
As predicted, we find that the distributions of donors rewarded is significantly different between the two conditions (Figure 1; using linear regression: coeff. = –2.250, p < 0.001, Table S1; qualitatively similar results are obtained with rank-sum test: Z = –10.935, p < 0.001). This shift in reward behaviour occurs only for the top and bottom income classes: when income ranges are revealed, participants are more likely to reward the poorest donor (coeff. = 2.681, p < 0.001, Table S2) and less likely to reward the richest donor (coeff. = –3.72, p < 0.001, Table S2). There is no difference in likelihood to reward donors in the middle of the distribution (all p-values > 0.1).
Reward behaviour shifts from rewarding the richest donor who donates the highest absolute amount in the hidden condition to the poorest donor who donates the largest relative amount in the revealed condition.

Experiment 2
Methods
Participants (n = 855) were recruited on Amazon Mechanical Turk, read the instructions and answered comprehension questions, and were then assigned to groups of five to play a two-stage economic game over 10 rounds.
We used a standard paradigm in experimental economics; an incentive-compatible, repeated public goods game in groups of five players. In each of the 10 rounds, every player was assigned an ‘income’ and chose how much of that income to contribute to a common pool; all contributions were doubled and divided equally among the five players (see Supplementary Material, Section 2.2.1 for more details about the experimental design). We then showed each player the contributions of all other players and gave each player the opportunity for costly sanctioning of all other players. In the punishment condition, participants could pay 1 unit to decrease any other participant's payoff by 3 units; in the reward condition, participants could pay 1 unit to increase any other participant's payoff by 3 units. Participants could spend up to 2 units on each of the other participants.
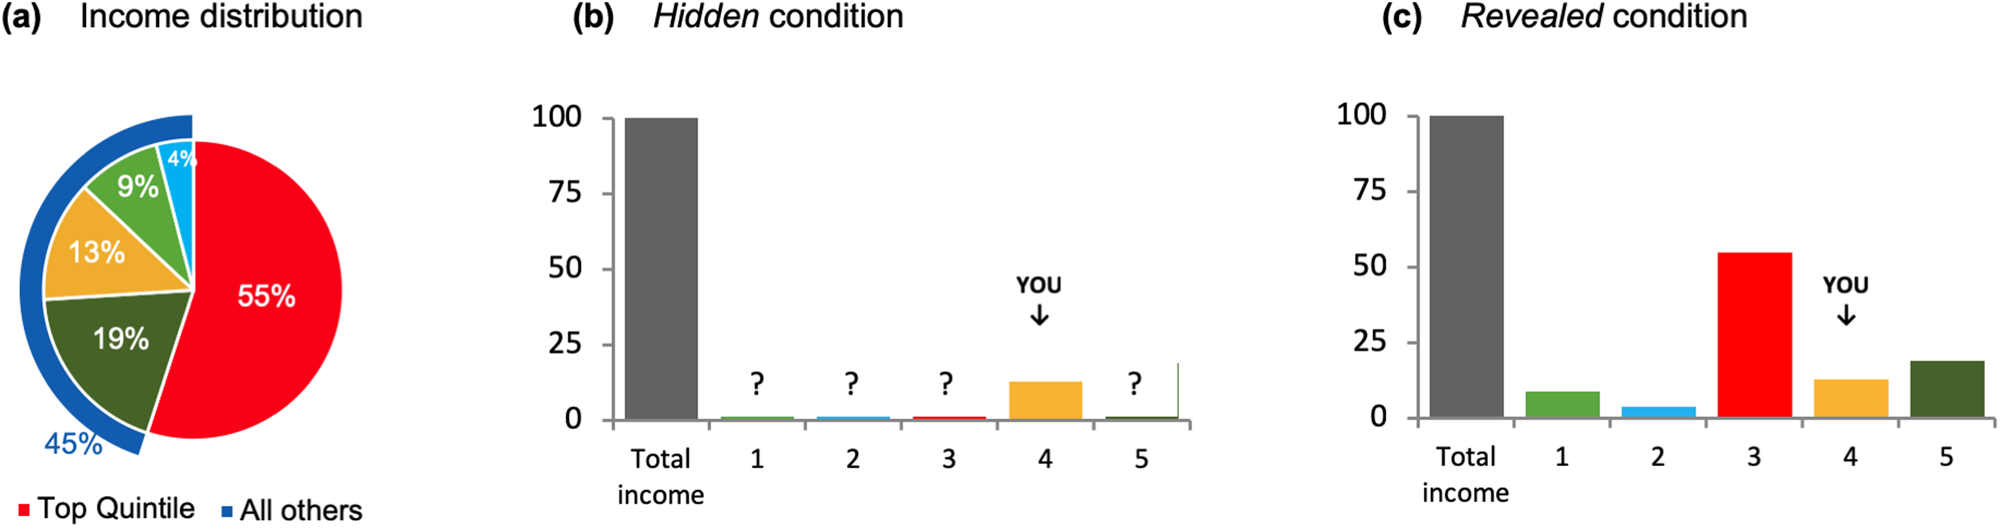
Before the start of the game, participants were randomly assigned to receive an income and were told they would receive this same income in each round of the game. We used the US pre-tax incomes by quintile to create incomes for the five players (Congressional Budget Office, 2007): the top-quintile participant received 55 units out of 100 units in the group (or 55% of all income), the next 19 units, the next 13 units, the next 9 units and the bottom-quintile participant received 4 units (Figure 2(a)). Once assigned to an income level, participants received the same income each round for 10 rounds.
The income distribution in our game and the main experimental manipulation between the hidden and revealed conditions. (a) Each player in a group of five was randomly assigned to a position in an income distribution. In the first experiment, we used the 2007 US pre-tax income distribution (Congressional Budget Office, 2007): in each of 10 rounds, the top-quintile participant received 55 units, while the bottom-quintile player received 4 units. (b) When making decisions to punish and reward, participants in the hidden condition saw their own income and the sum of all incomes. (c) In the revealed condition, participants viewed all players’ incomes.

Across all conditions, participants played two stages in each round. In Stage 1, participants could contribute any amount of their income to a common project. Any units contributed were doubled and split equally among all five group members. In Stage 2, participants could see everyone's contributions and could either punish or reward their group members (depending on the condition). Participants could not spend more in Stage 2 than they had earned in Stage 1. At the end of each round, participants saw their group members’ decisions to reward or punish them in Stage 2 and a summary of their payoff in this round. To ensure that participants could not identify one another across multiple rounds and to avoid retaliation (Nikiforakis et al., Reference Nikiforakis, Noussair and Wilkening2012), each player was only known by a series of random letters that changed at the beginning of every round.
The experimental design was a 2 (punishment versus reward) × 2 (hidden versus revealed) between-participants design (n = 600; for details about the experimental design, see Supplementary Material, Section 2.2.2). In the hidden condition, players had no information about the incomes of the others in their group (Figure 2(b)): they made contributions, viewed others’ contributions and decided to punish or reward based only on the total amounts contributed by other players. In the revealed condition, in contrast, participants were shown the income of each player as they made their decisions to punish or reward – allowing them to base their decisions not only on the total amount contributed, but also the percentage of available income that each player chose to contribute (Figure 2(c)). For example, a player who contributed just 3 units in the hidden condition may look stingy; learning that this player had only 4 total units in the revealed condition may dramatically alter perceptions of their contribution.
We expected that in the hidden condition participants would generally view the (low-total) contributions of bottom-quintile players unfavourably, inducing punishment, and the (high-total) contributions of the top-quintile players favourably, inducing reward. In contrast, we expected that in the revealed condition participants would generally view the (high-percentage) contributions of bottom-quintile players favourably, inducing reward, and the (low-percentage) contributions of the top-quintile players unfavourably, inducing punishment.
Results
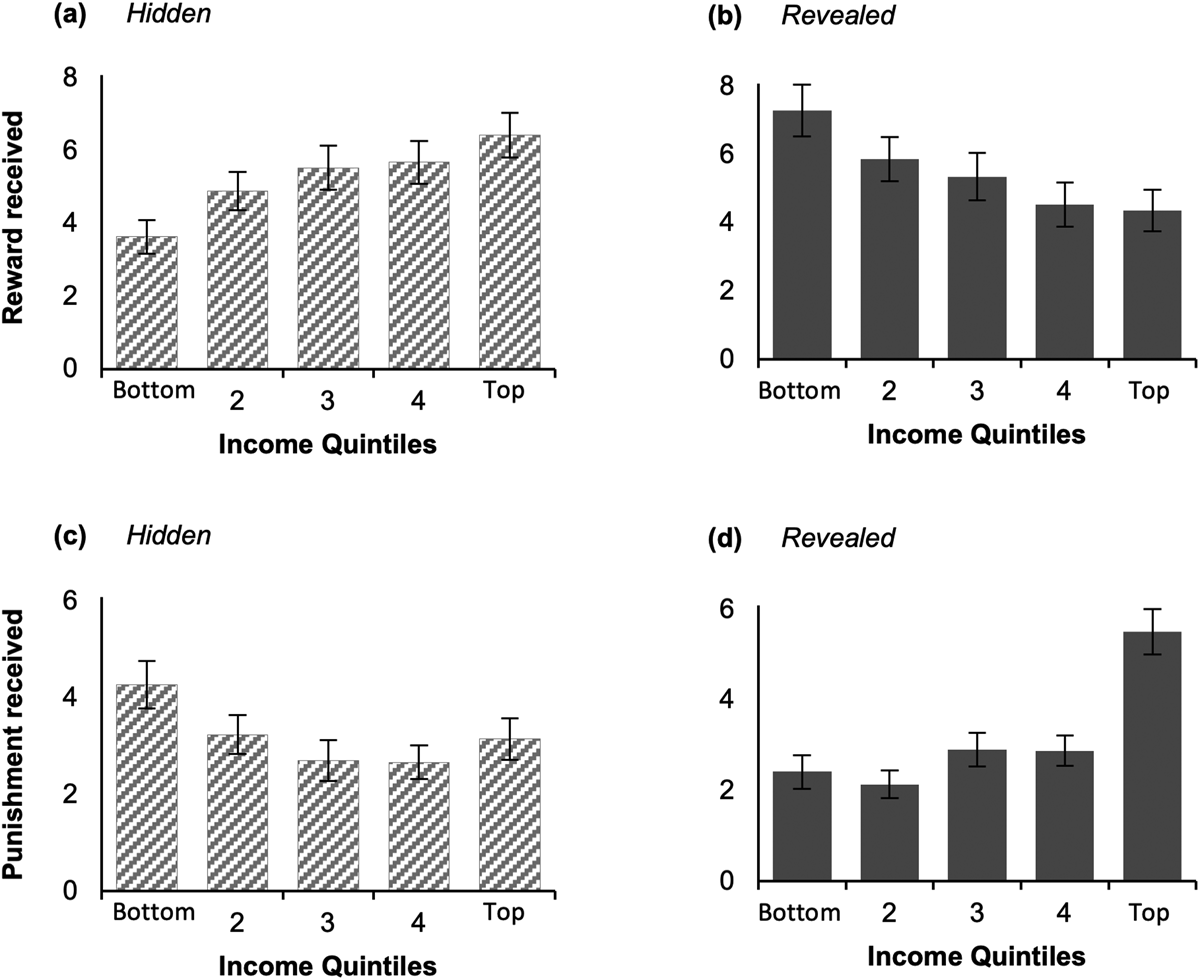
We find that, indeed, participants in the hidden condition rewarded richer participants more (coeff. = 0.636, p < 0.001), whereas those in the revealed condition rewarded poorer participants more (coeff. = –0.720, p < 0.001; interaction between income and revealed dummy, coeff. = –1.356, p < 0.001; Figure 3 and Table S3). We observe a mirror image of these results for decisions to punish: participants in the hidden condition punished poorer participants more (coeff. = –0.282, p = 0.042), whereas those in the revealed condition punished richer subjects more (coeff. = 0.692, p < 0.001; interaction between income and revealed dummy, coeff. = 0.974, p < 0.001; Figure 3 and Table S5). Thus, knowledge about economic inequality had a profound effect on sanctioning.
Amount of received reward (top panels) and punishment (bottom panels) depends on income quintile and whether income was hidden (left panels) or revealed (right panels). (a) Participants rewarded higher-income participants more in the hidden condition, but (b) less in the revealed condition. (c) Punishment behaviour is a mirror image of reward: participants punished poorer participants more in the hidden condition, while (d) punishing richer participants more in the revealed condition.

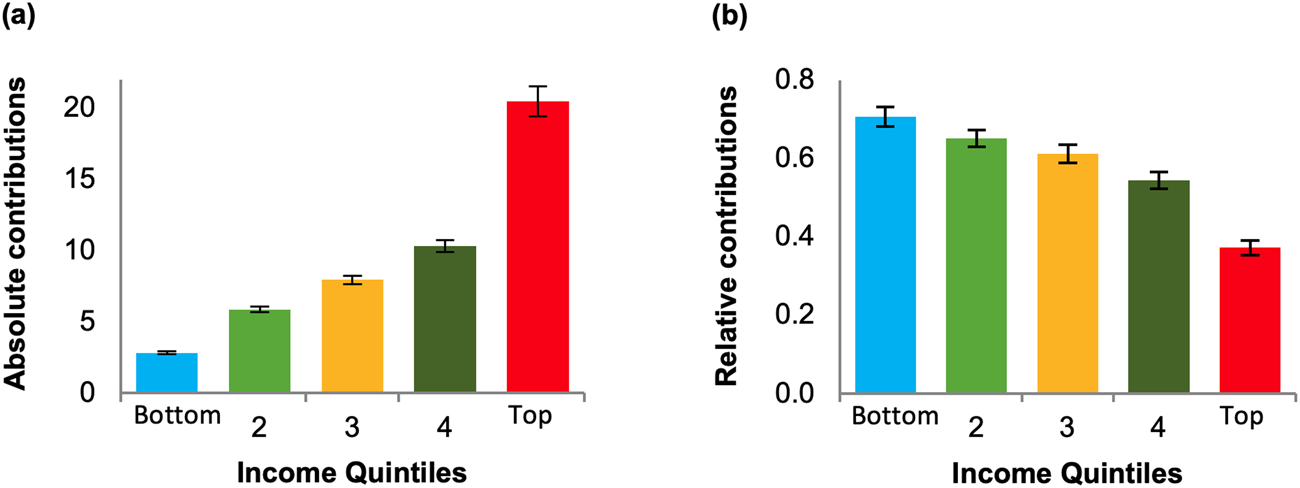
Why did players sanction so differently in the hidden and revealed conditions? Across both conditions, richer players contributed larger total amounts (hidden: coeff. = 3.172, p < 0.001; revealed: coeff. = 4.734, p < 0.001; Table S7), but lower percentages of their income (hidden: coeff. = –0.098, p < 0.001; revealed: coeff. = –0.058, p < 0.001; Table S8) (Figure 4). Collapsing across conditions, top-quintile participants contributed 20.49 out of 55 units (or 37% of their income), whereas bottom-quintile participants contributed 2.83 out of 4 units (or 71% of their income). The pattern of sanctioning we observe therefore follows naturally if sanctions were assigned based on percentage of income contributed in the revealed condition but total amount contributed in the hidden condition.
Who contributes more? (a) In the hidden condition, only absolute contributions could be assessed, such that richer participants appeared to contribute more. (b) In the revealed condition, where participants could view contributions relative to income, it became apparent that lower-income participants contributed a larger fraction of their income.

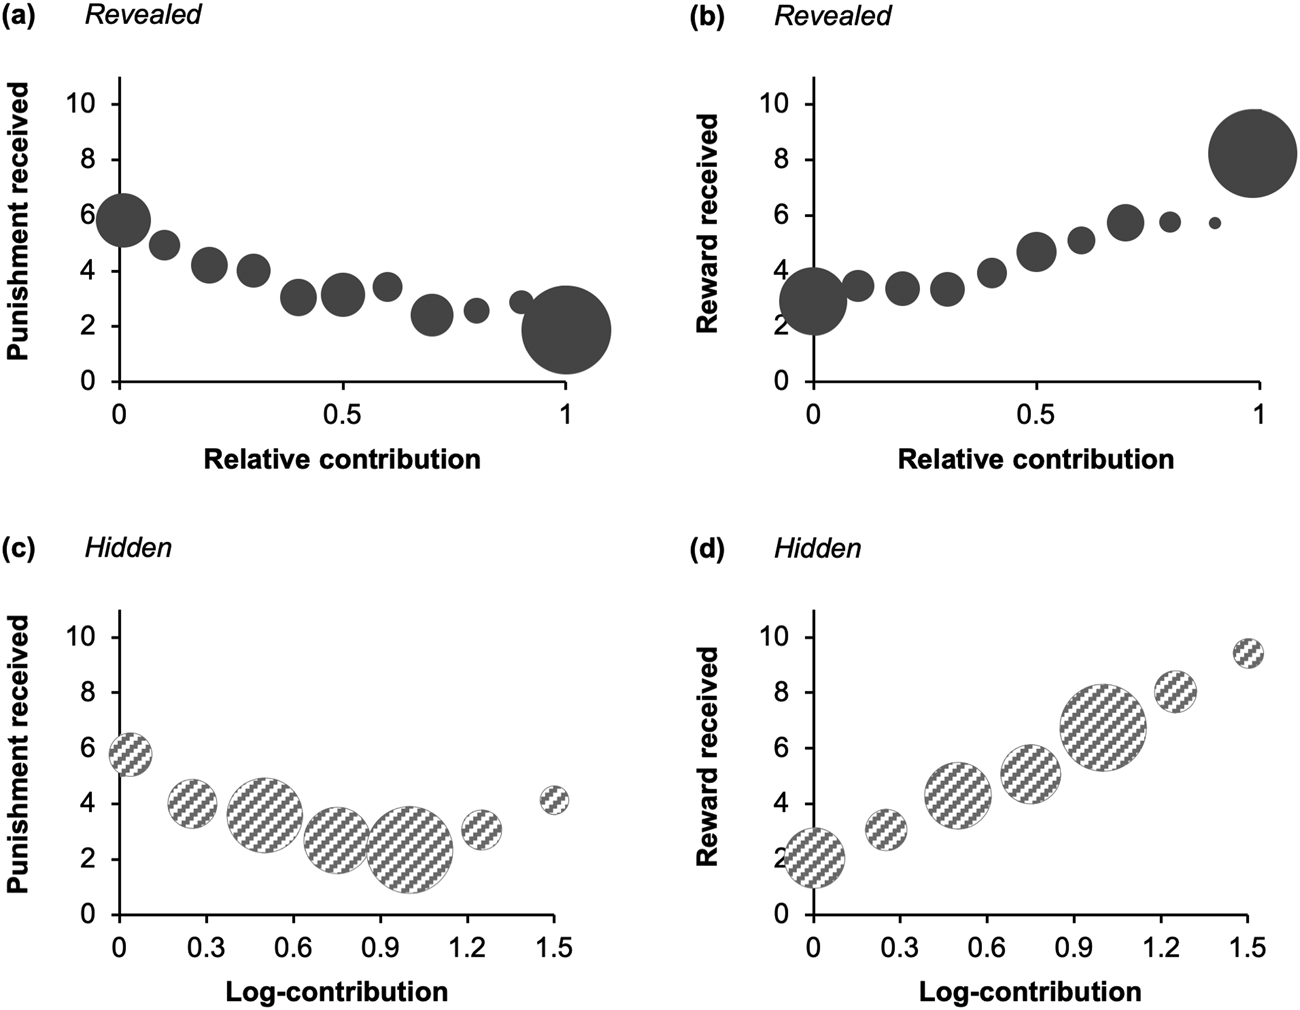
Supporting this logic, in the revealed condition, participants conditioned their sanctioning decisions on the percentage of the target's income that was contributed (using percentage contributed as the independent variable; predicting punishment: coeff. = –4.664, p < 0.001, Figure 5(a); predicting reward: coeff. = 6.320, p < 0.001, Figure 5(b)) (Table S12), more so than on the absolute amount contributed. In the hidden condition, conversely, where only total contribution amounts were known, sanctioning was based on total amount contributed (predicting punishment: coeff. = –1.863, p = 0.019, Figure 5(c); predicting reward: coeff. = 4.700, p < 0.001, Figure 5(d)) (Table S11), but not on percentage of income contributed (predicting punishment: coeff. = 0.030, p = 0.954; predicting reward: coeff. = –0.216, p = 0.677) (Table S11).
Received punishment and reward depends on percentage of income contributed in the revealed condition (top panels) and on absolute income contributed in the hidden condition (bottom panels). (a & b) When incomes were revealed, participants who contributed a higher percentage of their income were (a) punished less and (b) rewarded more. (c & d) Conversely, when incomes were hidden, participants who contributed a higher absolute amount were (c) punished less and (d) rewarded more. Bubble size is proportional to the fraction of corresponding participants.

We next consider the consequences of income transparency on total contributions and final payoff inequality. Overall, significantly more units were contributed in the revealed condition compared to the hidden condition (coeff. = 1.745, p = 0.002; Table S17). However, these overall greater contributions in the revealed condition were not distributed equally: the richest participant earned significantly less per round (predicting round payoff of top quintile only: coeff. = –5.430, p < 0.001), the fourth quintile was unchanged (coeff. = –0.474, p = 0.715), but all other participants earned significantly more (first quintile: coeff. = 6.261, p < 0.001; second quintile: coeff. = 3.950, p = 0.003; third quintile: coeff. = 3.399, p = 0.010).
In addition, revealing income not only affected contributions and payoffs; it also resulted in less inequality by the end of the game. The Gini coefficient – a common summary measure of inequality – after the final round of the game was significantly higher in the hidden condition (average 0.238) compared to the revealed condition (average 0.169; rank-sum, p < 0.001). Notably, participants in the bottom (poorest) through fourth (second-richest) quintiles maintained (or even increased) their contribution levels over the 10 rounds in both the hidden and revealed conditions; in contrast, although participants in the top (richest) quintile in the revealed condition also continued to contribute steadily over time (coeff. = –0.382, p = 1.000 Bonferroni-corrected), top-quintile players in the hidden condition decreased their contributions over the 10 rounds (coeff. = –1.077, p < 0.001 Bonferroni-corrected) (Tables S19 and S20). In other words, in the hidden condition, sanctions were less effective at maintaining contributions among those with the greatest ability to contribute to the public good.
Experiment 3
Participants in our second experiment were assigned their income randomly. However, incomes in the real world are not just the product of chance, but also of effort. Earned incomes could justify inequalities and thus reduce a desire for redistribution through punishment or reward (Cappelen et al., Reference Cappelen2013). In Experiment 3, we thus assigned income based on participants’ performance in an individual effort task before playing the public goods game. While the general setup of the game was similar to Experiment 2, we also made several additional changes to the design, which are described in detail in Supplementary Material, Section 2.2.3; below is a shortened summary.
Methods
Participants (n = 440) who were recruited on Amazon Mechanical Turk played a two-phase experiment. In Phase 1, participants completed an individual effort task that affected their income level in the second phase. In Phase 2, participants played the same repeated two-stage economic game with sanctions (unlike before, both reward and punishment options were available simultaneously). As before, participants were assigned to one of two conditions: participants in the revealed conditions saw their own income, the incomes of the other participants and the sum of all incomes, while participants in the hidden condition only saw their own income and the sum of all incomes in the group.
Unlike in the previous experiment, participants were not randomly assigned their income at the start of the economic game, but earned their position in the income distribution beforehand through an effort task (Abeler et al., Reference Abeler2011), and this was common knowledge to all players. The best-performing participant in a group earned the highest income, the second-best performing participant earned the second-highest income and so on.
Furthermore, in this experiment, we increased external validity by ensuring that participants in both conditions were aware of some degree of inequality, as they are in the real world (Kiatpongsan & Norton, Reference Kiatpongsan and Norton2014): we informed participants (who had been recruited exclusively from the USA) in both the hidden and revealed conditions in the second experiment that the income distribution used in the game was derived from the US income distribution by quintile (US Census Bureau, Reference Census Bureau2013). However, based on previous research (Norton & Ariely, Reference Norton and Ariely2011; Hauser & Norton, Reference Hauser and Norton2017), we anticipated that participants would misjudge the actual extent of US inequality (and thus inequality in the game) and would therefore not adjust their sanctioning behaviour sufficiently, thereby showing a similar sanctioning pattern to the previous experiment.
Results
In our third experiment, we found qualitatively similar results to before: participants continued to reward the rich and punish the poor in the hidden condition (predicting number of units received, where positive values imply receiving on average reward and negative values imply punishment: coeff. = 0.053, p = 0.042), while this trend reversed completely in the revealed condition (coeff. = –0.171, p < 0.001; interaction between income and revealed dummy: coeff. = –0.225, p < 0.001; Table S22). Across conditions, richer participants contributed more in absolute terms (coeff. = 3.979, p < 0.001; Table S22), but less as a percentage of their income (coeff. = –0.078, p < 0.001; Table S25), than poorer participants. As before, this sanctioning pattern was linked to reward and punishment decisions: higher absolute contributions received more reward in the hidden condition (coeff. = 0.571, p < 0.001; Table S28), but higher percentage of income contributed was more rewarded in the revealed condition (coeff. = 1.775, p < 0.001; Table S28).
Groups in the revealed condition (average Gini index = 0.124) again ended up with more equal payoffs than those in the hidden condition (Gini index = 0.255). Furthermore, overall contributions to the public good were higher in the revealed condition than in the hidden condition (coeff. = 3.134, p < 0.001; Table S30), but they did not benefit everyone equally: the richest participant earned significantly less per round (coeff. = –4.923, p = 0.011), the fourth-quintile participant's payoff did not change (coeff. = 2.864, p = 0.105), but all other participants earned significantly more (first quintile: coeff. = 11.990, p < 0.001; second quintile: coeff. = 8.269, p < 0.001; third quintile: coeff. = 6.218, p = 0.001).
In our third experiment, even when incomes were earned and when participants were informed that the income distribution was reflective of their own country's distribution, participants continued to punish the poor and reward the rich when the income distribution was hidden, but reward the poor and punish the rich when incomes were revealed.
Experiment 4
In our final experiment, we turn to the question of how revealing inequality might influence relevant policy outcomes. In particular, we examine taxation preferences with regards to school funding. We used actual data from donations to Parent–Teacher Associations (PTAs) in five New York school districts, which vary on both average income and average donation amounts. In particular, districts with higher incomes tend to contribute more to PTAs, resulting in inequality in educational funding. We showed participants either the contributions to the PTA from each district (hidden condition) or both the contributions and the average income (revealed condition) and asked which district they believed should be responsible for an additional tax that helps all schools across districts. We expected that, in the hidden condition, poor school districts would be ‘punished’ with the additional tax, whereas in the revealed condition, punishment would switch towards wealthier districts.
Methods
Participants (n = 313) were recruited on Amazon Mechanical Turk and randomly assigned to two conditions (hidden versus revealed). Participants in all conditions read about the annual fundraisers that the PTA organises across American schools, which helps schools afford non-state-funded initiatives such as a science lab, teachers’ aides and additional equipment; as in the public goods games in Experiments 2 and 3, these funds were pooled across the districts and then distributed back to each district. Participants were then informed that the city government wants to raise $2000 additional funding for each school by raising taxes and were asked: “Which parents do you think should pay the additional tax to cover the $2000 per school in all five schools?” The choice of the school parents that bear the additional tax is our measure of ‘punishment’ in this study.
In the revealed condition, participants saw a list of five schools (identified by a string of two random letters), the average PTA donation from parents at this school and the average household income in that area. Conversely, in the hidden condition, participants saw the same five schools but only the average PTA donation, with no income information. In both conditions, the five schools are modelled after a real dataset. We obtained data from average PTA donations (Sullivan & Felton, Reference Sullivan and Felton2014) and median household incomes (Weissman Center for International Business, 2016) from five New York City school districts (Bronx, Brooklyn, Manhattan, Queens and Staten Island). Participants saw the following five schools, which appeared in random order: $353 average PTA donation (median income: $35,176), $1227 ($51,141), $4249 ($60,422), $9759 ($71,622) and $1486 ($75,575). See Supplementary Material, Section 2.2.4 for more details on the experimental design.
Note that the absolute donation averages do not perfectly track with household incomes: parents in Manhattan – the district with the highest median household income – give less to PTA fundraisers ($1486) than parents in Queens ($4249) and Staten Island ($9759). Our predictions remain qualitatively unchanged, however: we predict that participants’ punishment preferences will shift away from raising taxes on the poorest school parents in the hidden condition to raising them on the richest parents when incomes are revealed.
Results
As predicted, we found that participants’ preferences shifted from punishing poor school parents in the hidden condition to punishing richer school parents in the revealed condition (using linear regression predicting 1 = poorer to 5 = richer school areas by revealed dummy: coeff. = 1.826, p < 0.001, Table S34; qualitatively similar results are obtained with rank-sum test: Z = –11.883, p < 0.001). Most changes in preferences occurred in a shift to the richest school parents. Specifically, participants were significantly less likely to raise taxes from poorer parents (M = 41.5%) in the revealed condition relative to the hidden condition (M = 7.1%; using logit regression predicting likelihood of choosing the poorest school parents to pay taxes by revealed dummy: coeff. = –2.222, p < 0.001, Table S35). Conversely, participants were more likely to raise taxes on the richest parents when incomes were revealed (M = 77.3%) compared to when incomes were hidden (M = 4.4%; predicting choosing the richest school parents: coeff. = 4.302, p < 0.001, Table S35).
Participants were also less likely to want taxes raised from the second-richest school districts in the revealed condition than in the hidden condition (predicting choosing second-richest school: coeff. = –1.985, p < 0.001, Table S35); there were no significant differences in punishment behaviour in the remaining two districts (both p-values > 0.1).
In sum, Experiment 4 offers an example of a real-world public goods dilemma with similar dynamics to our laboratory paradigms: people have an opportunity to contribute to a valued public good (in this case, education for their children) via voluntary contributions (in the form of charitable gifts), which are then pooled across groups of people with different incomes (in this case, school districts with higher and lower annual incomes). The decision for participants is to choose which school district should be the target of ‘punishment’ – in the form of an additional tax levied by the government. Consistent with the results from the previous studies, awareness of inequality shifted people's preferences away from punishing the poor (in the form of additional taxation) and towards rewarding them.
General discussion
In sum, revealing inequality had substantial effects on people's decisions to reward or punish others and on total contributions to the public good. Participants were more likely to punish poorer participants and reward richer participants when inequality was hidden; when income was revealed, participants became more sensitive to people's ability to contribute – leading them to punish the rich and reward the poor. These general patterns held true across charitable donations (Experiment 1), contributions to public goods in interactive group-based studies (Experiments 2 and 3) and with regards to taxation to support public education (Experiment 4).
To some, these results may not come as a surprise – indeed, one might argue that revealing the income distribution to participants would necessarily change their behaviour. However, we believe that this is only obvious in hindsight. First, people in the real world are aware of inequality in their communities and lives, but at the same time they underestimate the extent to which incomes (and wealth) are so drastically different between people (Norton & Ariely, Reference Norton and Ariely2011; Hauser & Norton, Reference Hauser and Norton2017) – and consequently they do not take these differences into account sufficiently when they evaluate contributions to a public good. Thus, we contribute to the literature by demonstrating that implicit knowledge of inequality in a country (such as the hidden conditions in Experiments 3 and 4) is not sufficient to make people realise that they could account for large differences in contribution amounts. People do not seem to spontaneously consider the background wealth of others when evaluating public contributions. Conversely, once incomes were revealed, the extent to which participants reserve their sanctioning patterns is also quite remarkable: we find that people are very responsive to this type of information, such that they punish the rich and reward the poor consistently in all of our experiments.
Participants’ motivation to punish the rich and reward the poor in the revealed condition could arise from seeking equity in contributions or simply aiming to reduce inequality in the group, or both (Rawls, Reference Rawls1971; Frohlich et al., Reference Frohlich, Oppenheimer and Eavey1987; Van Dijk & Wilke, Reference Van Dijk and Wilke1994). Though equity concerns were present in our sample, we additionally show in the Supplementary Material that participants in the revealed condition punished the top quintile more than any other player, even when the rich had contributed the same percentage of their income. In other words, when inequality was revealed, participants in our experiments desired not just equity, but also that the wealthy were slightly less well off, suggesting that spite may play a role in sanctioning under transparency. The observation that our participants were unaccepting of inequality adds to a growing literature on social preferences, egalitarianism and libertarianism (Konow, Reference Konow2000; Cappelen et al., Reference Cappelen2007). Conversely, what levels of inequality are acceptable remains an open question, but some recent work has started to shed light on this (Kiatpongsan & Norton, Reference Kiatpongsan and Norton2014; Norton, Reference Norton2014). Certainly, more research is need to explore what shapes belief formation of perceived and ideal inequality (Sheehy-Skeffington et al., Reference Sheehy-Skeffington, Kteily and Hauser2016); one fruitful area to investigate is the role of normative second-order beliefs (Jachimowicz, Hauser et al., Reference Jachimowicz and Hauser2018; Kraft-Todd et al., Reference Kraft-Todd, Bollinger, Gillingham, Lamp and Rand2018) – one's beliefs of what others believe – which might, in turn, shape one's own attitudes towards an issue, including inequality acceptance.
Our participants’ unwillingness to tolerate inequality of income persisted even when incomes were assigned by performance. The literature on pay dispersion in organisations has shown that being able to attribute unequal rewards to differences in production and performance can help reduce feelings of unfairness (Bloom & Michel, Reference Bloom and Michel2002; Shaw, Reference Shaw2014; Breza et al., Reference Breza, Kaur and Shamdasani2017). Furthermore, plausible justifications typically make people more accepting of inequalities (Cappelen et al., Reference Cappelen2013). However, in Experiment 3, we did not find evidence that earning incomes moderated the effects in either the hidden or revealed conditions. One explanation might be that most previous research has focused on moderate, not extremely high, levels of inequality, which are likely to map more closely onto people's (inaccurate) beliefs about the distribution of wealth and income; varying the extent to which distributions reflect reality versus perception offers an important area for future research. Another explanation might be that the act of earning incomes was less salient in our experiments than the incomes themselves. Future research is needed to investigate other potential moderators for the observed sanctioning behaviour, including individual traits such as subjective status (Akinola & Mendes, Reference Akinola and Mendes2013; Kraus & Mendes, Reference Kraus and Mendes2014; Brown-Iannuzzi et al., Reference Brown-Iannuzzi2015), sense of control (Kraus et al., Reference Kraus, Piff and Keltner2009) or risk preferences (Payne et al., Reference Payne, Brown-Iannuzzi and Hannay2017). Furthermore, group size and the extent to which (lack of) sense of control is affected by inequality (Chou et al., Reference Chou, Parmar and Galinsky2016; Jachimowicz, To et al., Reference Jachimowicz, To and Hauser2018) could help explain why and how participants are using reward and punishment in our experiments.
Visibility of income will, of course, not always have positive effects. For example, without the opportunity to sanction others, revealed inequality can lead to more segregation of the rich and poor, and even further inequality (Nishi et al., Reference Nishi2015). Furthermore, making incomes between co-workers public can reduce the satisfaction and productivity of low earners (Pfeffer & Langton, Reference Pfeffer and Langton1993; Card et al., Reference Card2012). Most studies have usually focused on individuals who conduct similar work and might thus feel unfairly treated if their salaries were vastly different. Much less research has looked at the consequences of CEO salary visibility, and it remains an open question as to how mandatory reporting policies (such as the US Dodd–Frank Act) that will require CEO salaries to be disclosed publicly will affect productivity, retention and satisfaction of workers.
While our income distributions were drawn from the real world, our paradigms necessarily offer stylised examinations of the impact of inequality on the public good and some limitations must be acknowledged. First, our experiments were conducted on Amazon Mechanical Turk, an online labour market that is often used for research purposes (Buhrmester et al., Reference Buhrmester, Kwang and Gosling2011; Rand, Reference Rand2012); however, this labour market is not nationally representative and thus results should be interpreted with caution. Of particular relevance to our own investigation is the demographic skew towards younger, more educated and more technologically savvy people in a typical Amazon Mechanical Turk sample compared to the general US population. For example, in exploratory analysis in our fourth experiment, we found that, while the overall shift to levying a tax on the richest household (versus the poorest) was statistically significant and economically meaningful across all age groups in the revealed condition, there was more variation across age groups in the hidden condition, such that older individuals in our sample were more likely than younger participants to assign the tax to the poorest households. This suggests that older participants were (probably unbeknownst to them) more willing to punish the poor and not consider their unobservable circumstances when incomes were hidden. Whether this suggestive evidence is more generalisable remains to be determined in follow-up work; however, these results do point to the importance of conducting research with a wide range of participants from different and representative backgrounds. Future research should thus consider demographic variation in lab and online experiments or ideally, wherever possible, conduct research on inequality using field experiments. The latter recommendation is particularly policy-relevant: for example, policy-makers and scholars interested in behavioural science and choice architecture (or ‘nudges’; Thaler & Sunstein, Reference Thaler and Sunstein2008) might want to run an audit or procedural field experiment (Harrison & List, Reference Harrison and List2004; List, Reference List2006; Ludwig et al., Reference Ludwig, Kling and Mullainathan2011; Kraft-Todd et al., Reference Kraft-Todd, Yoeli, Bhanot and Rand2015; Hauser et al., Reference Hauser, Linos and Rogers2017) in order to study and potentially shift incorrect beliefs about inequality (‘budging’ versus ‘nudging’; see Hauser et al., Reference Hauser, Gino and Norton2019) and its effects on redistribution; recent examples of large-scale, policy-relevant field experiments in the context of inequality include Jachimowicz et al. (Reference Jachimowicz2017) and Sands (Reference Sands2017).
Second, we had to make some design choices in our experiments that may differ from circumstances in the real world. For example, in Experiments 2 and 3, we restricted the amount that all participants could pay to punish or reward other players to the same fixed number of units per player (as in Rockenbach & Milinski, Reference Rockenbach and Milinski2006; Rand et al., Reference Rand2009). We observe a weak, marginally significant relationship between income and sanctioning behaviour across both the revealed and hidden conditions in Experiment 2 (linear regression predicting units spent on reward or punishment by income quintile: coeff. = 0.070, p = 0.053), though not in Experiment 3 (p > 0.1), suggesting that placing restrictions on sanctioning may have some effect. Future research is needed to delineate the effects of varying limitations on sanctioning. Of course, the real world may not always provide an upper bound: given their greater resources, the rich have much greater ability to inflict harm or bestow benefits on others. Still, there are some real-world situations in which all decisions count equally: for instance, casting a vote in democratic elections carries equal weight despite differences in income.
Conversely, our experiment also did not vary the degree to which punishment and reward affected individuals across the income spectrum differently. Future research should model and study potentially interesting policies that have varying effects on the rich and poor. For example, rich and poor participants in Experiments 2 and 3 could face the same maximum, absolute number of punishment (or reward) points, but being punished with the maximum would likely have different effects on the person depending on their income. A punishment of 4 units is less than 10% of the rich participants’ income, but it equals the total income each round for the poorest participants. It would thus be interesting to ask whether behaviour would be affected differently if punishment were the same fraction of one's income in both cases. There exists some precedent for a proportional fine structure: in the UK, for example, speeding fines can be as high as 150% of the offender's weekly income – however, the caveat is that the maximum fine cannot exceed £2500 (BBC, 2017). While the proportionality with income has comparable effects on individuals across the income spectrum, the choice of a ceiling likely limits the punishment the richest could be exposed to in extreme circumstances. Future research should experimentally vary the degree to which policy institutions assign punishment proportional to income or impose an upper bound.
In conclusion, a range of experiments and methodologies – from incentive-compatible economic games to psychological vignettes – demonstrate that preferences for who to sanction changed when incomes were made transparent and that revealing incomes decreased inequality and increased total contributions. To highlight, some of our results speak to the concerns of policy-makers: our final experiment shows that revealing information about inequality and wealth is an important factor in people's perceptions of where resources ought to be allocated to sustain a public good. We return to our introductory example to speculate on what revealing inequality might look like in the real world: while revealing all citizens’ incomes may seem challenging to implement or even hard to imagine in some countries, it is common practice in others – as in the Norway example cited earlier. In a world of income transparency, the ‘haves’ may become less rewarded and the ‘have-nots’ less punished, with implications for the common good.
Acknowledgements
We are grateful to constructive feedback from our colleagues at Harvard Business School, the Program for Evolutionary Dynamics at Harvard University and the Human Cooperation Lab at Yale University and MIT. We appreciate funding from the Harvard Foundations of Human Behavior Initiative and the Harvard Business School.
Supplementary material
To view supplementary material for this article, please visit https://doi.org/10.1017/bpp.2019.4