


Introduction
The global prevalence of psychiatric disorders has shown a consistent upward trajectory, with estimates indicating an increase of over 3 million diagnosed cases within the past decade (GBD 2019 Mental Disorders Collaborators 2022). Population-based data from the United States have highlighted depressive disorders, anxiety disorders and substance use disorders as primary contributors to the national burden of disease (Mokdad et al., Reference Mokdad, Ballestros, Echko, Glenn, Olsen, Mullany, Lee, Khan, Ahmadi, Ferrari, Kasaeian, Werdecker, Carter, Zipkin, Sartorius, Serdar, Sykes, Troeger, Fitzmaurice, Rehm, Santomauro, Kim, Colombara, Schwebel, Tsoi, Kolte, Nsoesie, Nichols, Oren, Charlson, Patton, Roth, Hosgood, Whiteford, Kyu, Erskine, Huang, Martopullo, Singh, Nachega, Sanabria, Abbas, Ong, Tabb, Krohn, Cornaby, Degenhardt, Moses, Farvid, Griswold, Criqui, Bell, Nguyen, Wallin, Mirarefin, Qorbani, Younis, Fullman, Liu, Briant, Gona, Havmoller, Leung, Kimokoti, Bazargan-Hejazi, Hay, Yadgir, Biryukov, Vollset, Alam, Frank, Farid, Miller, Vos, Bärnighausen, Gebrehiwot, Yano, Al-Aly, Mehari, Handal, Kandel, Anderson, Biroscak, Mozaffarian, Dorsey, Ding, Park, Wagner, Hu, Chen, Sunshine, Khubchandani, Leasher, Leung, Salomon, Unutzer, Cahill, Cooper, Horino and Brauer2018). Mood disorders, particularly major depressive disorder (MDD), a common psychiatric condition, have been reported to account for up to 87% of completed suicides, underscoring its critical role as a major global health risk (Cai et al., Reference Cai, Xie, Zhang, Cui, Lin, Sim, Ungvari, Zhang and Xiang2021). A recent study has confirmed strong associations between sleep parameters and neurochemical biomarkers, which collectively influence neuroplasticity and play critical roles in the pathophysiology of neurological and psychiatric disorders (Embang et al., Reference Embang, Tan, Ng, Loyola, Wong, Guo and Dong2025).
Obesity is not only a well-established risk factor for various metabolic disorders but is also strongly associated with an increased risk of multiple psychiatric conditions, including depression, psychotic spectrum disorders, anxiety disorders, eating disorders and personality disorders (Leutner et al., Reference Leutner, Dervic, Bellach, Klimek, Thurner and Kautzky2023). Furthermore, recent genetic evidence suggests shared genetic architecture and biological pathways between obesity and several psychiatric disorders, including attention deficit hyperactivity disorder (ADHD), anorexia nervosa (AN), anxiety, bipolar disorder (BD), MDD, post-traumatic stress disorder (PTSD) and schizophrenia (Liu et al., Reference Liu, Dou, Ye, Chen, Kong, Zhu, Zheng, Xu, Xu, Li, Zhao, Lu, Chen, Yuan, Ning, Wang, Bi and Wang2026). A consensus statement on diagnostic criteria, published in The Lancet Diabetes & Endocrinology in January 2025, emphasized the classification of obesity as a chronic disease (Rubino et al., Reference Rubino, Cummings, Eckel, Cohen, Wilding, Brown, Stanford, Batterham, Farooqi and Farpour-Lambert2025). It defined clinical obesity as excessive adiposity accompanied by organ or system damage directly attributable to obesity or a reduction in daily functional capacity (Rubino et al., Reference Rubino, Cummings, Eckel, Cohen, Wilding, Brown, Stanford, Batterham, Farooqi and Farpour-Lambert2025). Preclinical obesity, characterized by excess adiposity in the absence of clinically diagnosed obesity-induced dysfunction, may have healthy risk outcomes that are under-recognized in clinical practice. To date, research examining the relationship between sleep-related metrics and psychiatric disorders in individuals with preclinical obesity remains limited.
Furthermore, the mediating mechanisms linking combined modifiable risk factors to future health outcomes remain poorly understood, limiting our ability to interpret the complexity of risk–disease associations in clinical practice. Advances in proteomic technologies have opened new avenues to explore the biological pathways through which risk factors influence disease processes (Emilsson et al., Reference Emilsson, Ilkov, Lamb, Finkel, Gudmundsson, Pitts, Hoover, Gudmundsdottir, Horman, Aspelund, Shu, Trifonov, Sigurdsson, Manolescu, Zhu, Olafsson, Jakobsdottir, Lesley, To, Zhang, Harris, Launer, Zhang, Eiriksdottir, Yang, Orth, Jennings and Gudnason2018). To date, most proteomic studies have focused on distinguishing individuals with psychiatric disorders from healthy controls or on predicting incident psychiatric disorders using plasma proteins (Comes et al., Reference Comes, Papiol, Mueller, Geyer, Mann and Schulze2018; Chen et al., Reference Chen, Chen, Li, Yue, Zhu, Li, Jiang, Shen, Wang and Hou2023). Evidence is lacking on how proteomic patterns relate to composite sleep metrics in individuals with preclinical obesity, and whether such proteins mediate associations between sleep-related factors and psychiatric disorder risk.
In this study, we first assessed the association between composite sleep score and the risk of several specific psychiatric disorders. We then identified the proteomic profiles associated with sleep score and further evaluated the potential mediating role of selected plasma proteins in these associations. This study aimed to investigate the relationship between sleep quality and psychiatric disorder incidence in newly defined preclinical obesity, providing evidence to support lifestyle-based intervention strategies for risk reduction and contributing to a deeper understanding of the underlying proteomic mechanisms.
Materials and methods
Study design and population
The UK Biobank is a large, population-based prospective cohort study that enrolled approximately 500,000 participants aged 37–73 years between 2006 and 2010 across England, Scotland and Wales. Detailed information about the study is publicly available (https://www.ukbiobank.ac.uk/), and data access is granted to qualified researchers upon institutional approval and completion of required training modules. From the full cohort (N = 502,129), individuals with missing data on key anthropometric measures, including body mass index (BMI), waist circumference (WC), hip circumference and whole-body fat (BF) mass, were excluded (N = 11,316). Obesity was classified according to BMI thresholds stratified by ethnicity: BMI ≥ 30.0 kg/m2 for non-Asian and ≥28.0 kg/m2 for Asian (Chen, Reference Chen2004; Barba et al., Reference Barba, Cavalli-Sforza, Cutter and Darnton-Hill2004), and one of the following conditions must be identified: (1) for males, WC (cm) ≥ 102 or for females, WC (cm) ≥ 88 (WHO, 2008); (2) males waist-to-hip ratio (WHR) ≥ 0.9 or females WHR ≥ 0.85 (WHO, 2008); (3) waist-to-height ratio (WHtR) ≥ 0.5 (Browning et al., Reference Browning, Hsieh and Ashwell2010) and (4) BF% ≥ 25 for males or ≥35 for females (Oreopoulos et al., Reference Oreopoulos, Ezekowitz, Mcalister, Kalantar-Zadeh, Fonarow, Norris, Johnson and Padwal2010). Obesity-induced dysfunctions, as defined according to the most recent consensus (Rubino et al., Reference Rubino, Cummings, Eckel, Cohen, Wilding, Brown, Stanford, Batterham, Farooqi and Farpour-Lambert2025), were identified using International Classification of Diseases 10th version (ICD-10) codes, as listed in the supplementary appendix (p. 3). Preclinical obesity was defined as obesity in the absence of any 18 dysfunctions due to obesity at baseline.
Ascertainment of outcomes
The primary outcome of this study was the incidence of psychiatric disorders, including specific diagnoses such as ADHD, AN, anxiety, BD, MDD, PTSD and schizophrenia. These outcomes were identified based on ICD-10 diagnostic codes, as detailed in the supplementary appendix (p. 4). Participants with any of these events at baseline were excluded from the analysis (N = 1,223). Death data were available up to December 2022 for all participants (Lam et al., Reference Lam, Koon, Loong, Chung and Cheung2023). The electronic health records were available for centres in England, Scotland and Wales, respectively. Survival time was calculated as the time from baseline to psychiatric disorder onset, death or end of follow-up, whichever occurred first.
Exposure and other covariates
At baseline, sleep-related information was collected via the UK Biobank’s electronic touchscreen questionnaire. Sleep duration was assessed by asking participants how many hours they typically slept in a 24-hour period and was categorized as inadequate (<7 hours/day), optimal (7–8 hours/day) or prolonged (≥9 hours/day). Snoring was determined by asking whether a partner, family member or friend had complained about the participant’s snoring (yes/no). Chronotype was assessed by asking participants whether they considered themselves to be more of a ‘morning’ or ‘evening’ person. Daytime sleepiness was evaluated on a four-point scale: ‘never/rarely’, ‘sometimes’, ‘often’ or ‘all of the time’, indicating the frequency of unintentional dozing during the day. Insomnia symptoms were assessed by asking whether participants had difficulty falling asleep or experienced nighttime awakenings, with responses categorized as ‘never/rarely’, ‘sometimes’ or ‘usually’. Participants with missing or incomplete sleep-related information at baseline were excluded from the analysis (N = 766). A total of 91,380 UK Biobank participants were ultimately included in the association analysis (Fig. 1).
Flowchart of the study participants’ selection process.
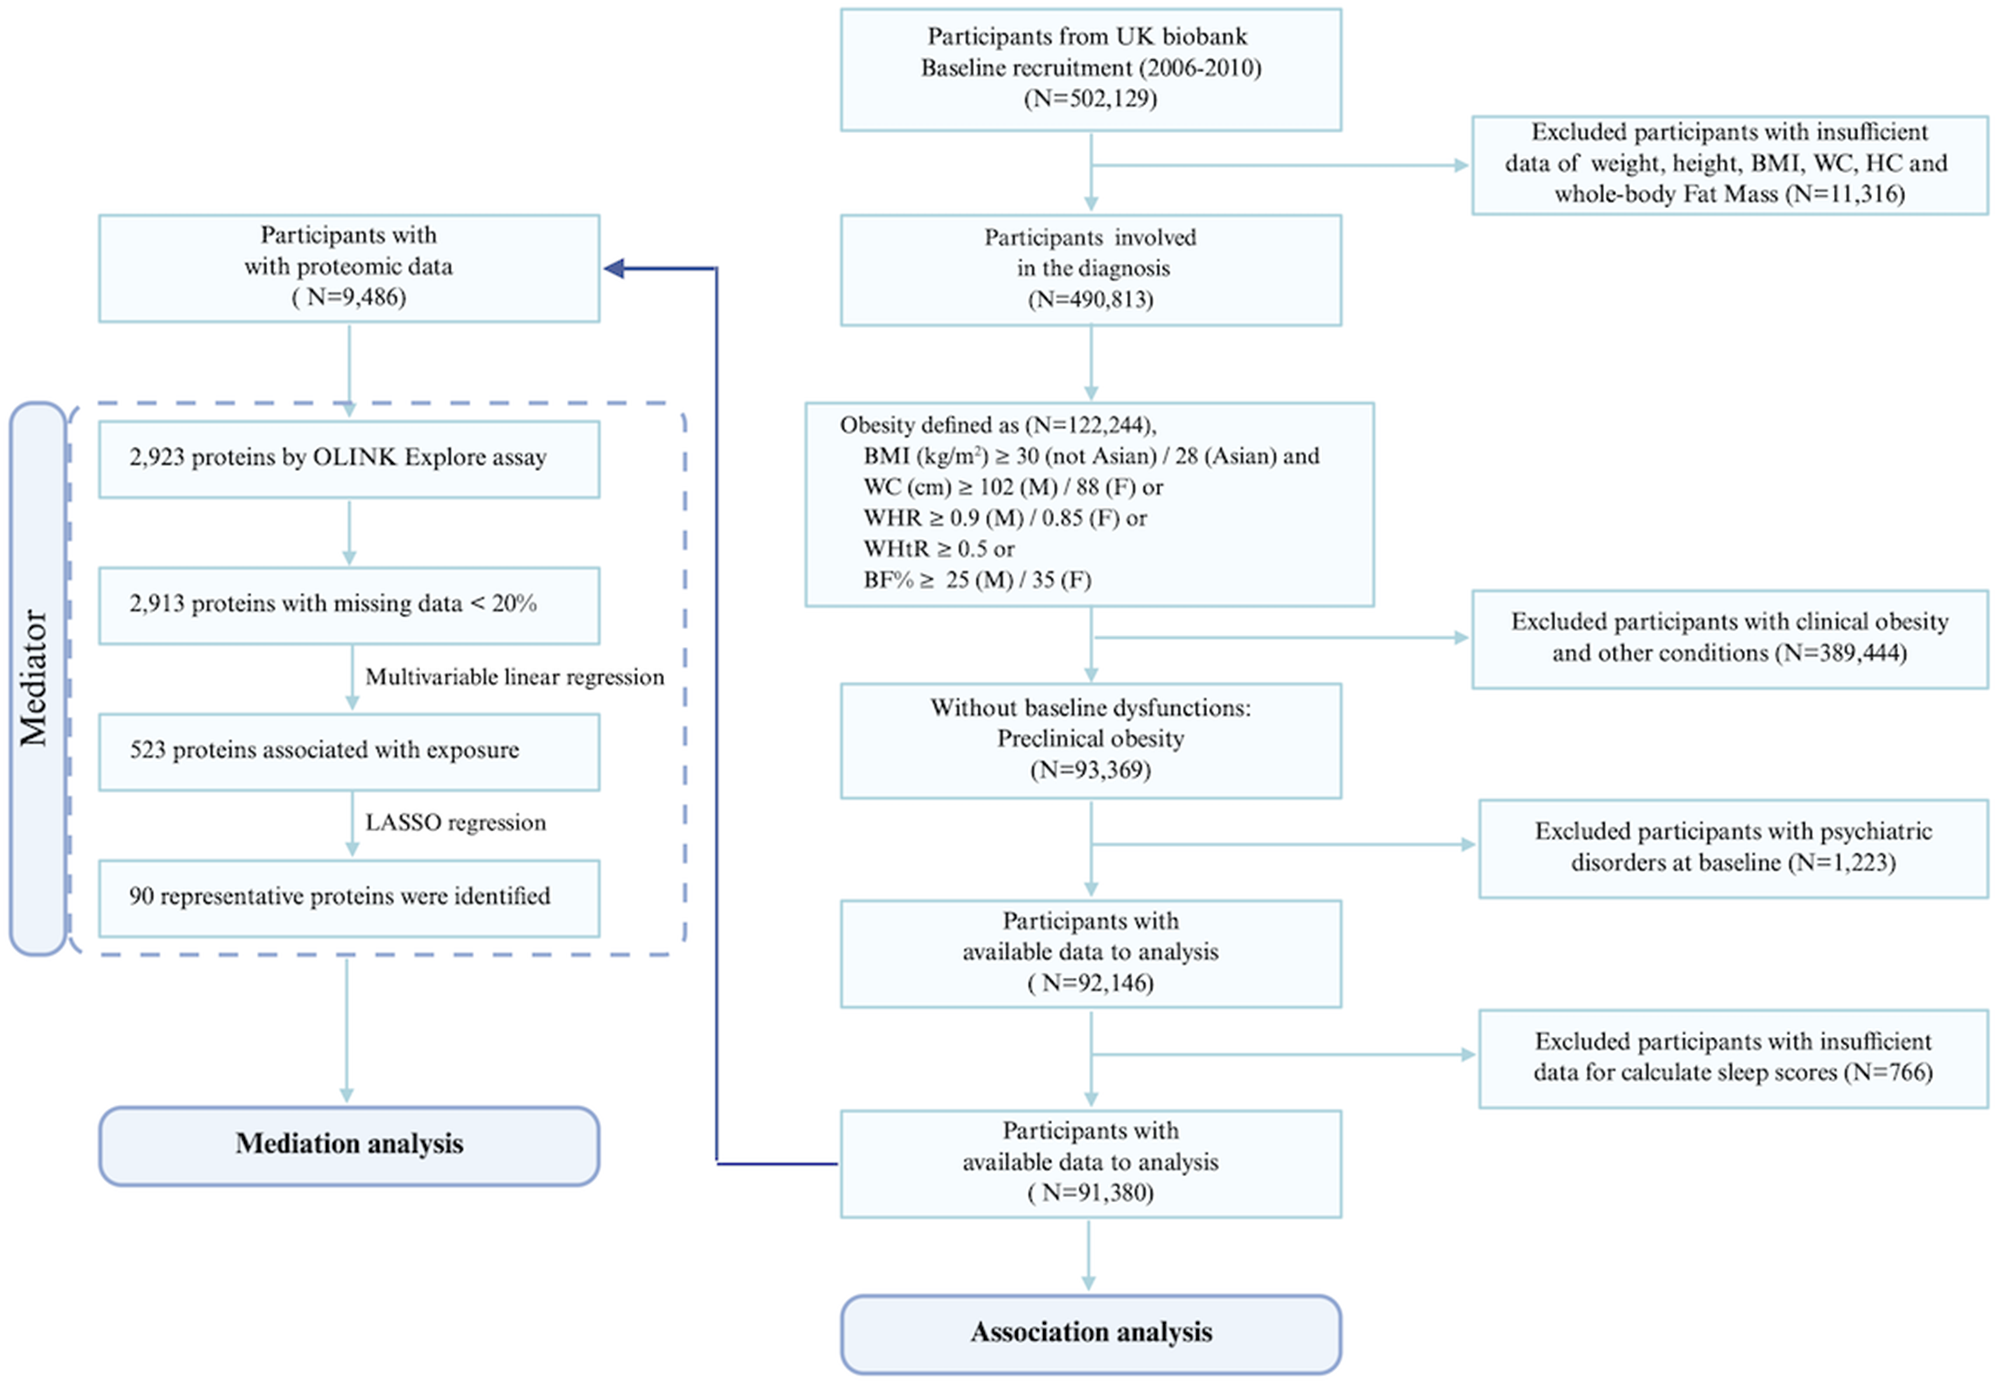
Figure 1 Long description
The flowchart outlines the mediation and association analysis process for UK Biobank participants. It begins with ′Part icipants from UK Biobank′ with baseline recruitment from 2006 to 2010, totaling 502,536 participants. Part icipants with insufficient data on weight, height, BMI, WC, HC and whole-body fat mass are excluded, leaving 411,360 participants. The next step involves participants in the obesity definition, totaling 84,484. Obesity is defined using BMI, WC and WHR criteria, with specific values for different ethnic groups. Part icipants with clinical obesity and other conditions are excluded, resulting in 39,484 participants. Those without baseline dyslipidemia are selected, totaling 36,309 participants. Part icipants with available data for analysis are 31,999, with exclusions for psychiatric disorders at baseline (N=3,309) and insufficient data for covariate scores (N=766). The association analysis is conducted on 31,233 participants. The mediation analysis involves participants with proteomic data (N=4,486), with 2,393 proteins by OLINK Explore assay. Proteins with missing data greater than 20 percent are excluded, leaving 525 proteins associated with exposure. Multivariable linear regression and LASSO regression identify 90 representative proteins for mediation analysis.
A composite sleep score was constructed based on a previously validated method (Sha et al., Reference Sha, Wang, Zhang, Zhang, Lu, Wei, Lei and Zeng2025), incorporating five sleep-related behaviours: sleep duration, snoring, chronotype, daytime sleepiness and insomnia symptoms. These five components were selected to reflect major dimensions of sleep health, including sleep quantity, sleep-disordered breathing, circadian preference, daytime functional impairment and sleep continuity (Buysse, Reference Buysse2014). Optimal sleep behaviours were defined as follows: sleeping 7–8 hours per day, no reported snoring, an early chronotype (i.e., morning preference), never/rarely or sometimes experiencing daytime sleepiness and never/rarely experiencing insomnia symptoms. For each behaviour, participants received 1 point if they met the optimal criterion and 0 otherwise. Based on the total sleep score ranging from 0 to 5, participants were categorized into six groups (Groups 1–6) at baseline.
Additional baseline data on lifestyle and behavioural factors were collected using a touchscreen questionnaire. Participants self-reported their smoking and alcohol intake status, categorized as never, past or (almost) daily, with a ‘prefer not to answer’ option available for both items. A healthy diet was defined as meeting at least five favourable dietary criteria, including higher intake of fruits, vegetables, whole grains, fish, dairy products and vegetable oils and lower intake of refined grains, processed and unprocessed meats and sugar-sweetened beverages (Han et al., Reference Han, Cao, Feng, Zheng, Dhana, Zhu, Shang, Yuan and Zong2022). Regular physical activity was defined as engaging in at least 150 minutes per week of moderate-intensity activity, 75 minutes per week of vigorous-intensity activity or an equivalent combination of both (Tucker et al., Reference Tucker, Welk and Beyler2011). Other baseline characteristics included age, sex, ethnicity, education qualification, employment status, systolic blood pressure (SBP) and diastolic blood pressure (DBP). Regular medication use was self-reported and included aspirin, nonsteroidal anti-inflammatory drugs (NSAIDs), lipid-lowering agents, antihypertensive drugs, insulin, metformin and other glucose-lowering medications. These variables were included as covariates in the present analysis.
As part of the baseline assessment, biochemical assays were used on whole blood to quantify serum and plasma biomarkers, including haemoglobin A1c (HbA1c), fasting blood glucose, low-density lipoprotein cholesterol (LDL), high-density lipoprotein cholesterol (HDL), total cholesterol (TC), triglycerides (TG) and C-reactive protein (CRP). Estimated glomerular filtration rate (eGFR) was derived from serum creatinine concentrations using a validated formula.
Proteomics data
The UK Biobank Pharma Proteomics Project (UKB-PPP) includes proteomic data from approximately 53,000 participants, drawn from a random sample broadly representative of the overall UK Biobank cohort. Detailed information on data processing and quality control is available via the UK Biobank online resource (https://biobank.ndph.ox.ac.uk/showcase/refer.cgi?id=4654). Briefly, plasma samples were stored at −80°C and transported on dry ice to Olink Analysis Service (Sweden) for proteomic profiling. Protein quantification was performed using the Olink platform, which integrates proximity extension assay with next-generation sequencing to measure relative concentrations of 2,923 unique proteins. Protein expression levels were reported as normalized protein expression values on a log2 scale. After excluding 10 proteins with more than 20% missing data, 2,913 proteins were retained for downstream mediation analysis (Fig. 1).
Statistical analysis
Continuous variables with normal distributions were presented as means with standard deviations, while those not normally distributed were summarized as medians with interquartile ranges. Categorical variables were reported as frequencies and percentages. Between-group comparisons were performed using one-way analysis of variance for normally distributed continuous variables, the Kruskal–Wallis test for skewed continuous variables and the chi-square test for categorical variables. For continuous variables with ≤5% missingness, missing values were imputed using the mean. When missingness exceeded 5%, multiple imputation was conducted using chained equations with predictive mean matching, implemented via the ‘mice’ package in R. For categorical variables, missing values were addressed by introducing a distinct ‘missing’ category.
Multiple Cox proportional hazards regression model was used to calculate the hazard ratios (HRs) and 95% CIs for the associations of sleep score (as a continuous score and groups) with primary outcomes in the main cohort (n = 91,380). The multiple regression model was performed to explore the dose–response relationship between sleep score and risk of primary outcomes. Three sequential models were constructed to account for potential confounders. Model 1 included adjustment for age, sex and race. Model 2 was additionally adjusted for education level, employment status, smoking status, alcohol consumption, healthy dietary habits, regular physical activity and sleep status. Model 3 further incorporated medication use, including aspirin, NSAIDs, antihypertensive agents, lipid-lowering agents, metformin, insulin and other glucose-lowering therapies. Stratified analyses were also conducted using Group 1 as the reference to evaluate associations across subgroups defined by lifestyle, socioeconomic, dietary and physical activity-related variables. Within each stratum, HRs were estimated with adjustment for all covariates except the stratifying variable. Stratified analyses were performed to examine the association of sleep score (as groups) with primary outcomes by excluding participants with survival time less than 3 years.
All analyses below that related to plasma proteomics were carried out in the proteomic subset (n = 9,486). To build proteomics profiles for sleep score, multiple linear regression model was used to assess the association between every one of 2,913 proteins and sleep score adjusting for the same multiple confounders as the Cox model. In order to further select representative proteins for mediation analyses and identify candidate proteins associated with sleep score, LASSO regression was applied using the ‘glmnet’ package in R. Tenfold cross-validation was used to determine the optimal regularization parameter (lambda.min). Specifically, the dataset was randomly partitioned into 10 equally sized subsets. In each iteration, nine subsets were used to train the model, and the remaining subset was used for validation; this process was repeated 10 times so that each subset served as the test set once. Model performance was estimated as the average of the 10 validation errors. Given the relatively small sample size of the proteomic dataset and the potential instability of cross-validation estimates, we repeated the LASSO procedure 1,000 times using randomly set seeds (1–1,000). Proteins were selected for downstream analysis only if they exhibited 100% selection frequency (i.e., non-zero coefficients in all 1,000 iterations), thereby minimizing overfitting and enhancing reproducibility. Further, we conducted the Kyoto Encyclopedia of Genes and Genomes (KEGG) and Gene Ontology (GO) enrichment analyses to elucidate the pathways and biological processes related to proteins that were derived from the previous step, using the R package ‘clusterProfiler’, ‘org.Hs.eg.db’, ‘enrichplot’ and ‘ggplot2’. The rankings of relevant pathways, Biological Process (BP), Cellular Component (CC) or Molecular Function (MF) terms were based on the p-value, which represents the statistical significance of the enrichment observed for a particular KEGG pathway or GO term.
To assess the mediating role of individual proteins in the association between sleep score and psychiatric disorder risk, we conducted a protein-wise causal mediation analysis using a nonparametric bootstrap approach. For each protein, we estimated the average causal mediation effect (ACME), average direct effect, total effect and proportion mediated (PM). In each bootstrap iteration (R = 500), the dataset was resampled with replacement, and a two-stage regression procedure was performed: first, a linear regression model estimated the effect of sleep score on the mediator; second, a Cox proportional hazards model estimated the effects of sleep score and the mediator on the time-to-event outcome. ACME was calculated as the product of the exposure–mediator and mediator–outcome coefficients. To ensure validity, we required each mediator to exhibit at least two non-missing unique values in the resampled data; otherwise, the iteration was excluded to avoid model failure. Covariates were dynamically retained in each iteration only if they had more than one level. Confidence intervals for PM were obtained using the percentile bootstrap method. All analyses were conducted in R using the ‘survival’ and ‘boot’ packages.
All analyses were performed using R software (version 4.2.2; R Foundation for Statistical Computing) unless otherwise specified. All p-values < 0.05 were considered statistically significant.
Results
Baseline characteristics
Table S1 (supplementary appendix, p. 5) illustrates the baseline characteristics of the study population, classified into six groups based on sleep scores. Compared to the other five groups, participants in Group 6 had the highest age, SBP, proportion of males and non-White ethnicity, higher education level and the highest proportions of regular physical activity, lipid-lowering, antihypertensive and glucose-lowering medication use. In contrast, Group 6 had the lowest proportions of currently employed and current drinkers, as well as the lowest levels of TC, LDL, HDL and eGFR. Participants in Group 5 showed the highest proportion of healthy diet and the lowest levels of BMI, WC, DBP, TG, CRP and the lowest proportion of current or past smokers. Additionally, Group 1 had the highest level of HbA1c.
Psychiatric disorder incidence risks across different groups
Table 1 demonstrates the HRs for psychiatric disorder incidence across sleep score groups using the Cox proportional hazards model. During a median follow-up of 12.9 ± 2.72 years, 8,992 participants developed at least one psychiatric disorder during follow-up. After stepwise adjustment for multiple confounders, the fully adjusted HRs in Model 3 across Groups 1–6 were 1.00, 0.85 (95% CI: 0.78–0.93), 0.72 (95% CI: 0.66–0.78), 0.60 (95% CI: 0.55–0.65), 0.51 (95% CI: 0.46–0.57) and 0.47 (95% CI: 0.33–0.67), respectively. E-values were calculated to assess the potential influence of unmeasured confounding. In the fully adjusted model, the E-values ranged from 1.63 to 3.68, with E-values for the confidence interval limits ranging from 1.36 to 2.90, suggesting relative robustness of the main findings to unmeasured confounding.
Hazard ratios for psychiatric disorder incidence among different groups
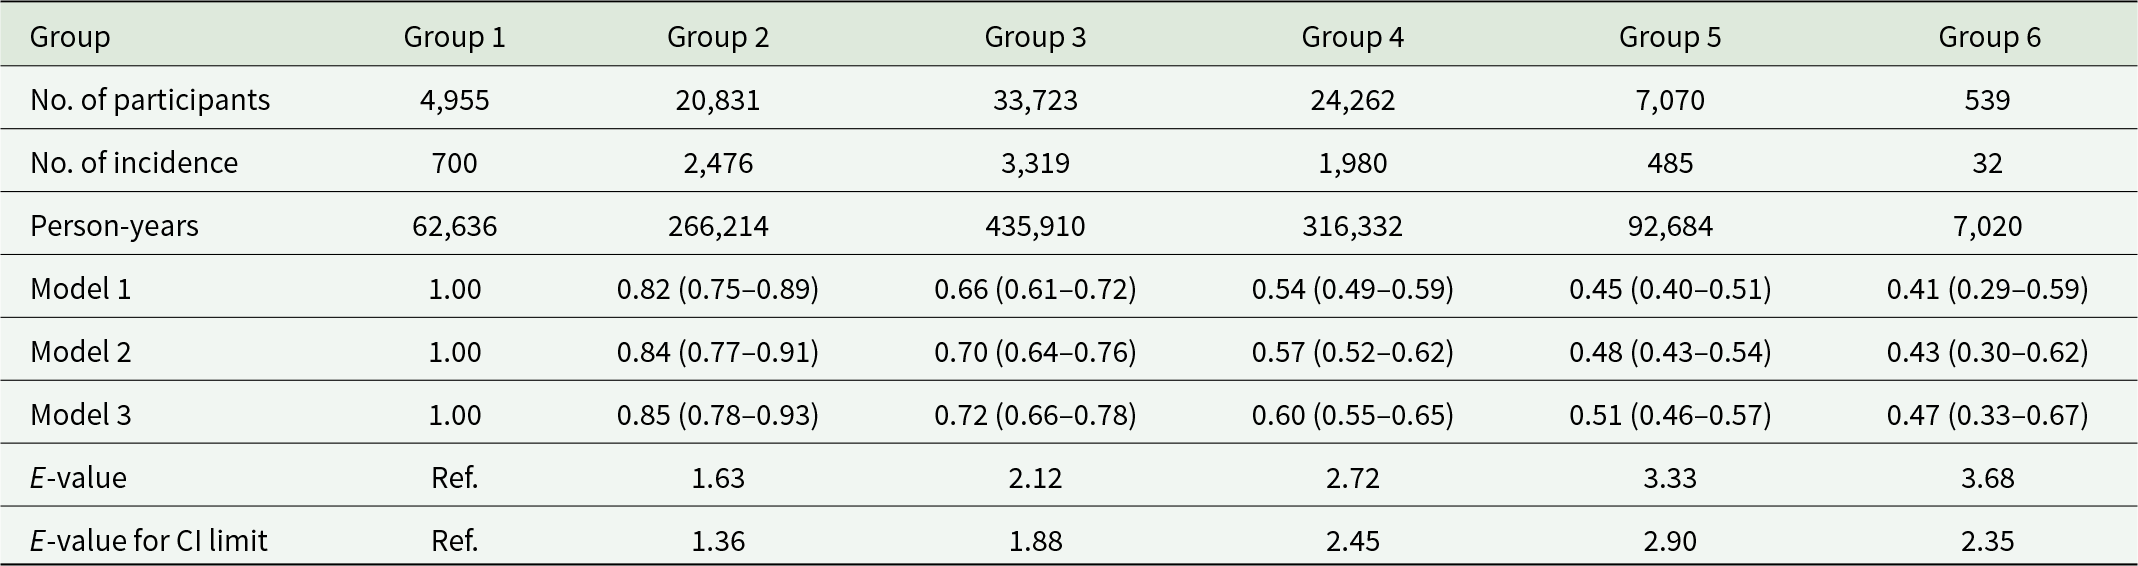
Table 1 Long description
Hazard ratios are reported for Groups 1 through 6, alongside counts of participants, incidence, person years, and E-values. Participant counts are 4,955 in Group 1, 20,831 in Group 2, 33,723 in Group 3, 24,262 in Group 4, 7,070 in Group 5, and 539 in Group 6. Incidence counts are 700, 2,476, 3,319, 1,980, 485, and 32, respectively, and person years are 62,636, 266,214, 435,910, 316,332, 92,684, and 7,020. Model 1 hazard ratios are 1.00 for Group 1, 0.82 with 0.75 to 0.89 for Group 2, 0.66 with 0.61 to 0.72 for Group 3, 0.54 with 0.49 to 0.59 for Group 4, 0.45 with 0.40 to 0.51 for Group 5, and 0.41 with 0.29 to 0.59 for Group 6. Model 2 hazard ratios are 1.00, 0.84 with 0.77 to 0.91, 0.70 with 0.64 to 0.76, 0.57 with 0.52 to 0.62, 0.48 with 0.43 to 0.54, and 0.43 with 0.30 to 0.62. Model 3 hazard ratios are 1.00, 0.85 with 0.78 to 0.93, 0.72 with 0.66 to 0.78, 0.60 with 0.55 to 0.65, 0.51 with 0.46 to 0.57, and 0.47 with 0.33 to 0.67. E-values are listed as Ref. for Group 1, then 1.63, 2.12, 2.72, 3.33, and 3.68, and E-value for CI limit is Ref., then 1.36, 1.88, 2.45, 2.90, and 2.35.
Model 1: Adjusted for age, sex and race.
Model 2: Further adjusted for education qualification, employment status, smoking status, alcohol drinking status, healthy diet, regular physical activity and sleep condition.
Model 3: Further adjusted for use of aspirin, NSAIDs, antihypertensive drugs, lipid-lowering drugs, metformin, insulin and other glucose-lowering drugs.
E-values were calculated based on the fully adjusted HRs from Model 3.
We further examined the HRs for the incidence of specific psychiatric disorders in relation to sleep score values (Table S2, supplementary appendix, p. 6). A higher sleep score was significantly associated with a lower overall risk of psychiatric disorders (fully adjusted HR = 0.86, 95% CI: 0.84–0.88). Similarly, inverse associations were observed for several specific disorders after full adjustment: ADHD (HR = 0.24, 95% CI: 0.08–0.72), anxiety (HR = 0.88, 95% CI: 0.86–0.91), BD (HR = 0.84, 95% CI: 0.75–0.95), MDD (HR = 0.83, 95% CI: 0.81–0.85) and PTSD (HR = 0.73, 95% CI: 0.60–0.89). However, disease-specific estimates, particularly for ADHD, should be interpreted cautiously because of the small number of incident cases and relatively wide confidence intervals. In contrast, no significant association was observed between sleep score and the incidence of schizophrenia (HR = 1.00, 95% CI: 0.84–1.17). Additionally, no cases of AN were identified in this population.
Subgroup analyses and sensitivity analyses
Stratified analyses of HRs for psychiatric disorder incidence across sleep score groups are presented in Table S3 (supplementary appendix, p. 7). In these exploratory stratified analyses, the association between Group 6 and a lower risk of psychiatric disorder incidence was observed among participants who were not current alcohol drinkers (HR = 0.28, 95% CI: 0.10–0.75) and among females (HR = 0.29, 95% CI: 0.17–0.50). In contrast, the protective association of Group 6 was not obvious among males, participants aged <45 or ≥65 years, non-White individuals and those with higher educational qualifications.
To ensure the robustness of these findings, sensitivity analyses were performed by excluding participants who developed psychiatric disorders (Table S4, supplementary appendix, p. 8). The results remained consistent, with Group 6 showing the lowest risk of psychiatric disorder incidence (fully adjusted HR = 0.47, 95% CI: 0.32–0.69). Moreover, the risk declined progressively across Groups 1–6, with Group 2 representing the second-lowest risk category (fully adjusted HR = 0.86, 95% CI: 0.79–0.95).
Identifying proteins associated with sleep score
Proteomic analyses were conducted among 9,486 participants with preclinical obesity who were randomly selected by the UKB-PPP for proteomic detection. The characteristics of participants with proteome data are presented in Table S5 (supplementary appendix, pp. 9–10), and no significant difference was found between populations included in the main cohort and those included in the proteomic subset.
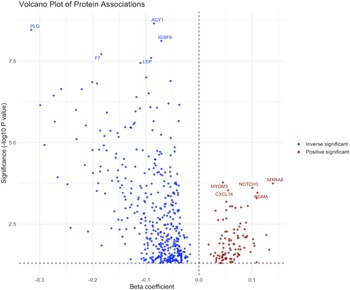
After multiple linear regression, 523 of 2,913 proteins were significantly associated with sleep score (false discovery rate (FDR)-adjusted P < 0.05, Fig. 2, and Supplementary Data 1). Out of these proteins, 425 proteins showed negative associations with sleep score, and the top 2 significant proteins were PLG (plasminogen) and SERPING1 (plasma protease C1 inhibitor); 98 proteins showed positive associations with sleep score, and the top 2 significant proteins were MXRA8 (matrix remodelling associated protein 8) and ITGAV (integrin alpha V).
Volcano plot of protein associations with sleep score.
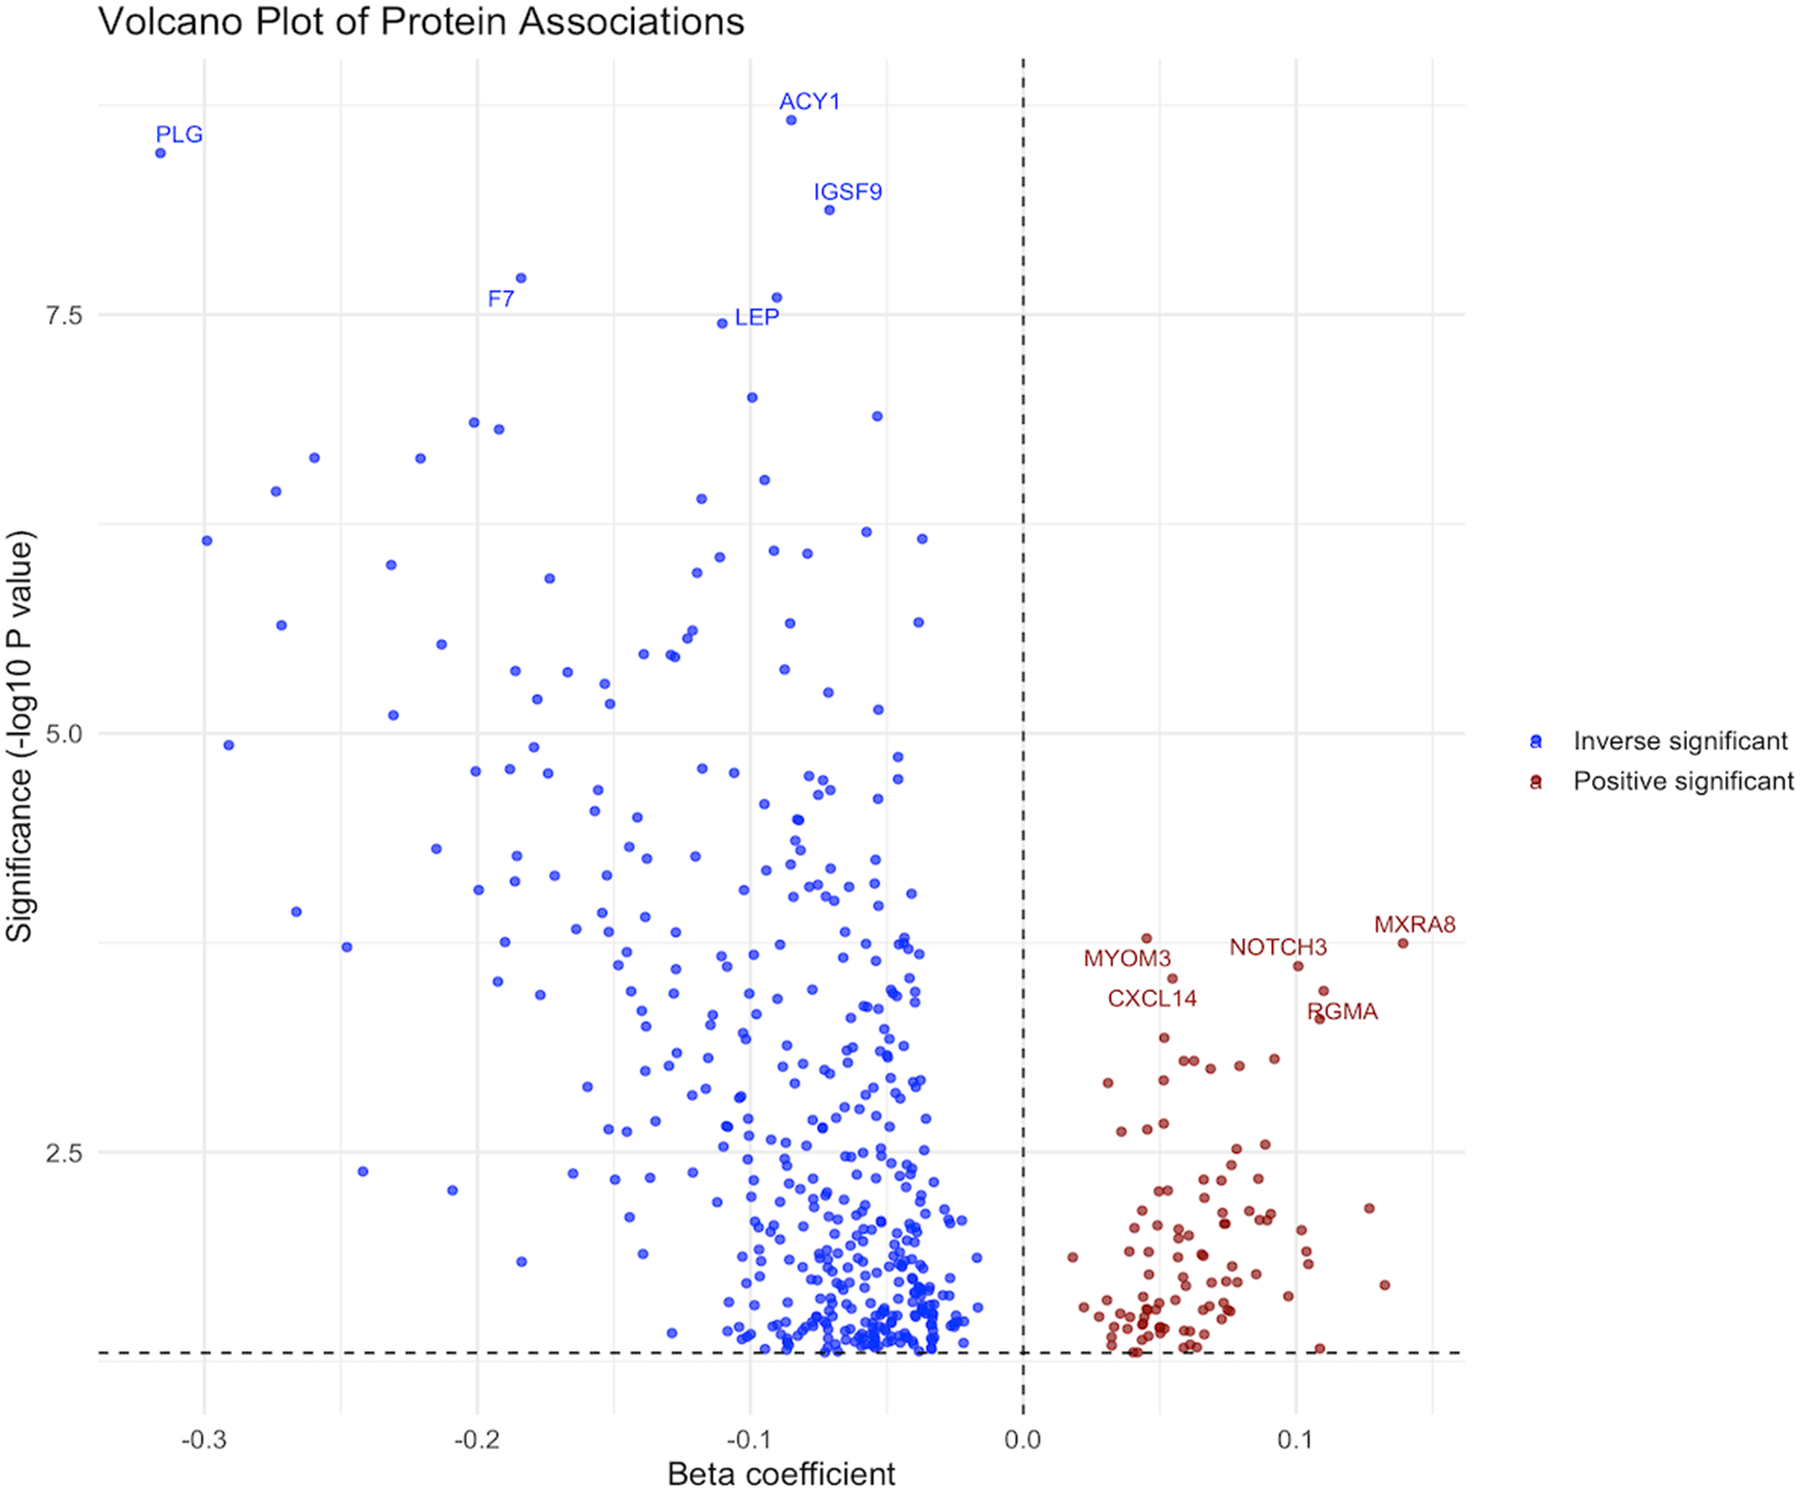
Figure 2 Long description
The horizontal axis label is, Beta coefficient. The horizontal axis shows tick labels at negative 0.3, negative 0.2, negative 0.1, 0.0 and 0.1. The vertical axis label is, Significance negative log 10 P value. The vertical axis shows tick labels at 2.5, 5.0 and 7.5. A vertical dashed line is drawn at 0.0 on the horizontal axis. A horizontal dashed line is drawn near the bottom of the plot. Plotted points form a dense band close to the horizontal dashed line, with many points concentrated near beta coefficient values close to 0.0. Points extend upward to higher Significance negative log 10 P value values on both sides of 0.0. The negative beta coefficient side contains a larger spread of points and includes several labeled points at higher Significance negative log 10 P value values, including PLG, ACY1, IGF9, F7 and LEP. The positive beta coefficient side contains a smaller cluster of points and includes labeled points MXRA8, MYOM3, CXCL14, NOTCH3 and SRM. A legend on the right lists two entries: Inverse significant and Positive significant. The plotted points are shown in two distinct marker styles corresponding to these two legend entries.
Mediation analysis
To achieve dimensionality reduction while preserving model performance, we applied LASSO regression to 523 proteins identified from an initial multivariable linear regression model of 2,913 proteins (Figure S1, supplementary appendix, p. 11). Tenfold cross-validation determined the optimal penalty parameter at log(λ) ≈ −3.64 (λ = 0.0261), which corresponded to the lowest mean squared error (Figure S1B). At this threshold, 90 proteins with non-zero coefficients were retained for downstream analysis (Figure S1A and Supplementary Data 1). The LASSO coefficient profiles showed progressive shrinkage of protein coefficients with increasing regularization. The overall protein selection workflow is summarized in Figure S1C.
Then, KEGG and GO enrichment analyses were performed to explore the biological relevance of the 90 proteins identified as candidate mediators (Figure S2, supplementary appendix, p. 12). The top enriched GO biological process was antimicrobial humoral response, followed by receptor-mediated endocytosis. KEGG pathway analysis revealed significant enrichment in cytokine–cytokine receptor interaction and the chemokine signalling pathway. These findings highlight the involvement of immune-related and inflammatory pathways in the link between sleep score and psychiatric disorder risk.
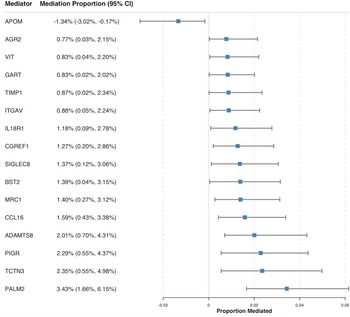
By evaluating mediation effects of 90 representative proteins on associations of sleep score with psychiatric disorder incidence, 16 significant mediators were detected (Fig. 3). Exploratory mediation analysis suggested that several plasma proteins may partially explain the association between sleep score and psychiatric disorder incidence. Among these, PALM2 (Paralemmin 2) showed the strongest mediation effect, accounting for 3.43% (95% CI: 1.66–6.15%) of the association. Other top mediators included TCTN3 (Tectonic 3) (2.35%, 95% CI: 0.55–4.98%), PIGR (Polymeric immunoglobulin receptor) (2.29%, 95% CI: 0.55–4.37%), ADAMTS8 (A disintegrin and metalloproteinase with thrombospondin motifs 8) (2.01%, 95% CI: 0.70–4.31%) and CCL16 (CC motif chemokine 16) (1.59%, 95% CI: 0.43–3.38%). Of note, APOM (Apolipoprotein M) showed a small but statistically significant negative mediation effect (−1.34%, 95% CI: −3.02 to −0.17%), suggesting a potential suppressive role in the sleep–psychiatric disorder axis.
Forest plot of mediation proportions of 16 proteins in the sleep score–psychiatric disorder relationship.
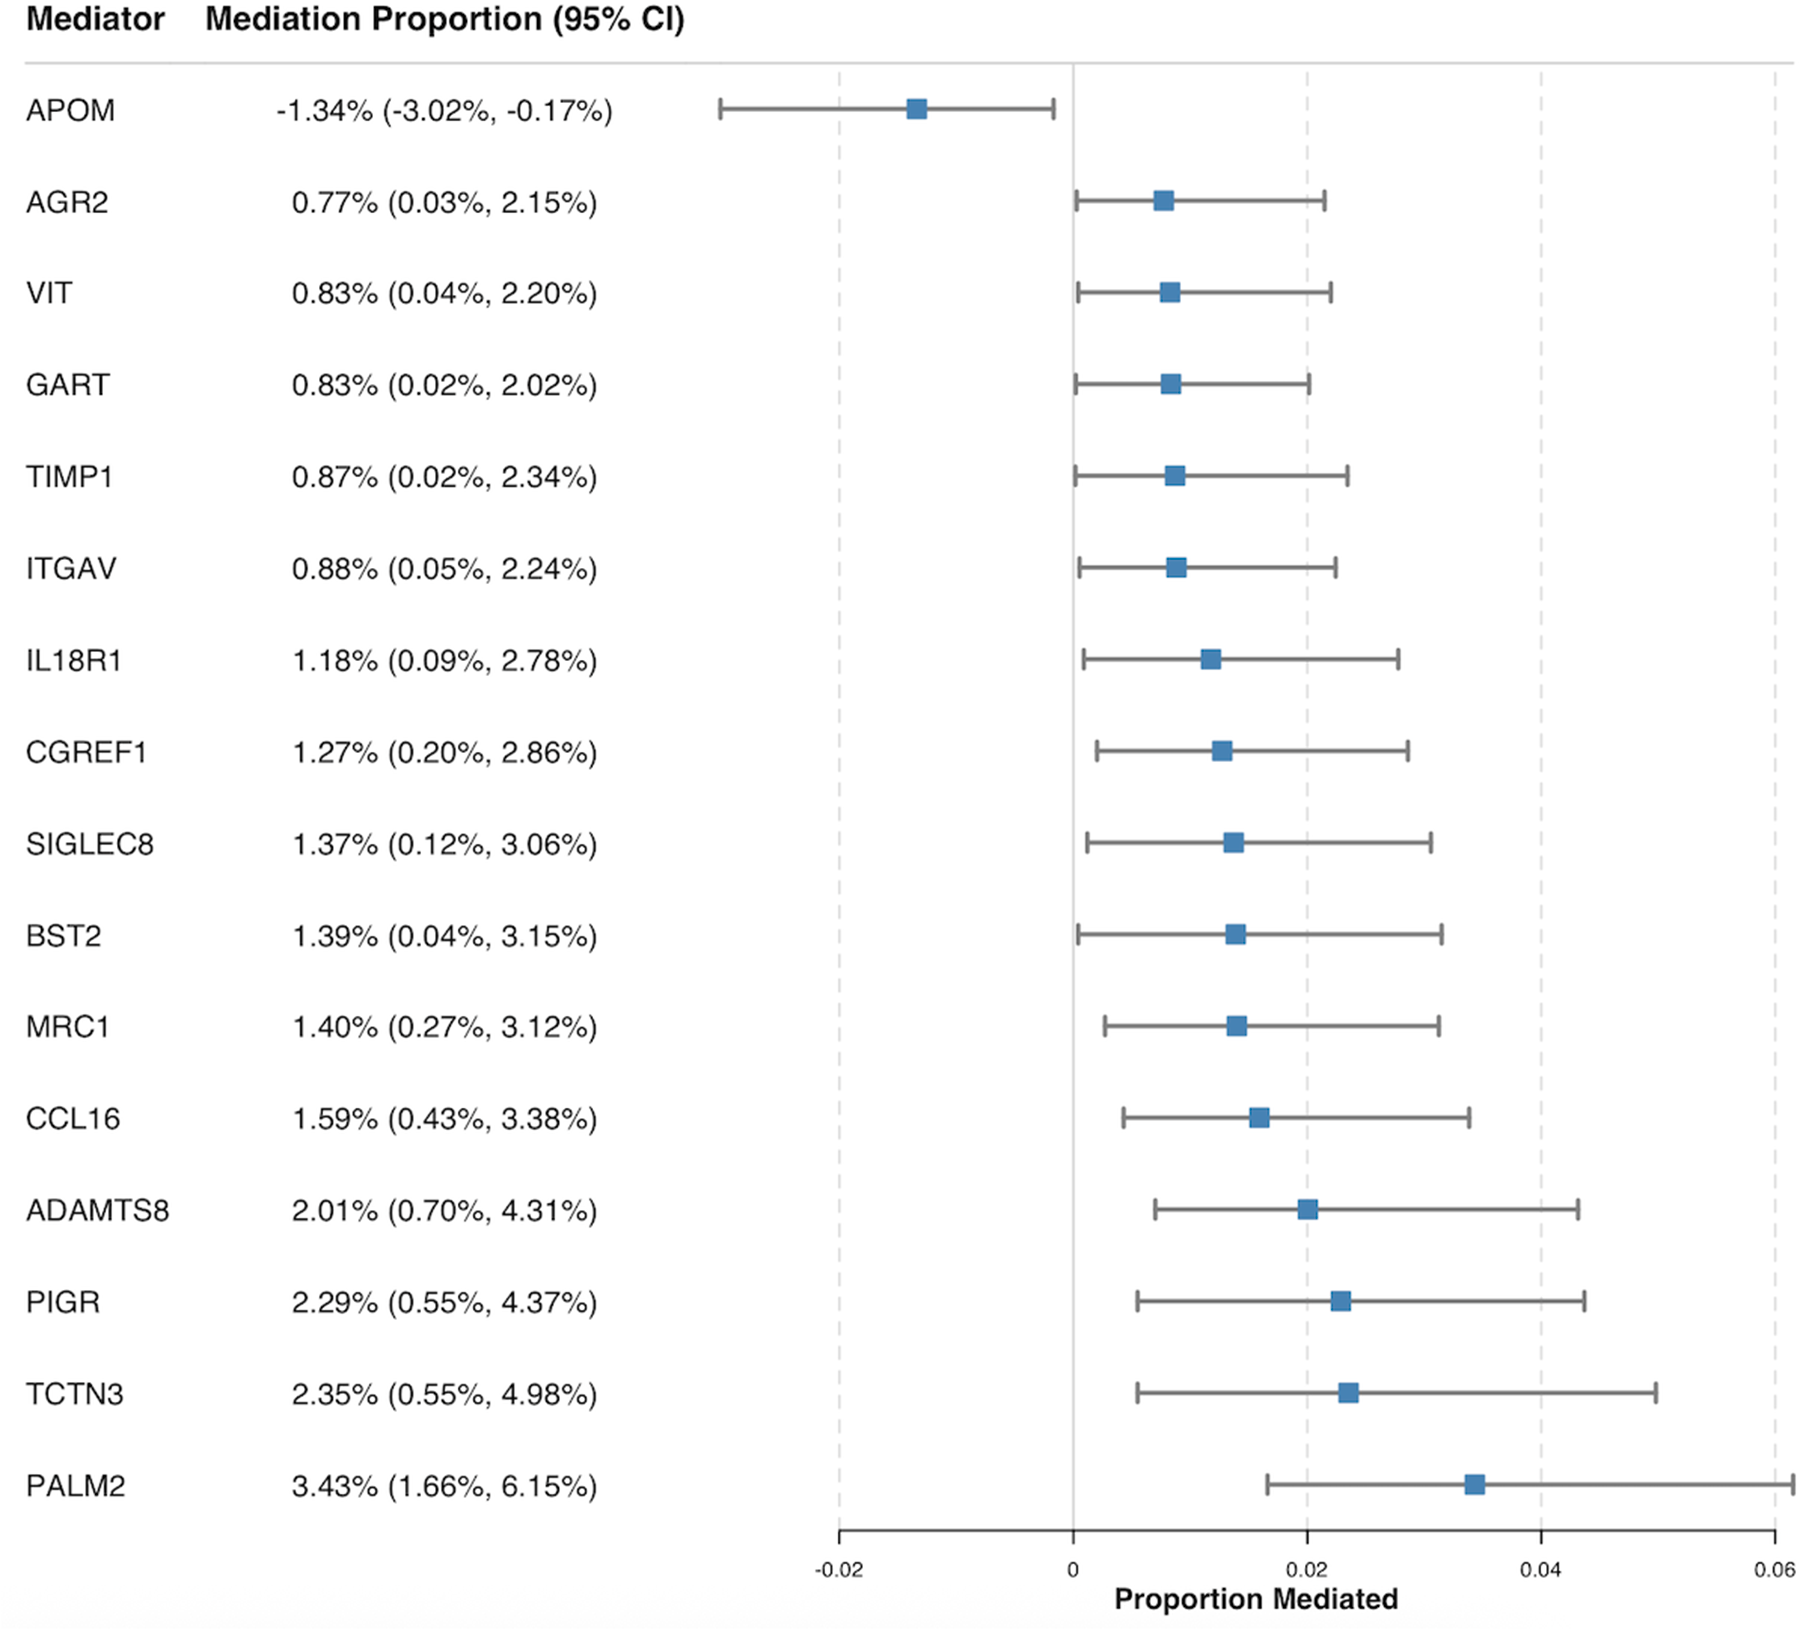
Figure 3 Long description
Mediator. Mediation Proportion, 95 percent confidence interval. The y-axis lists 16 mediators from top to bottom: APOM, AGR2, VIT, GART, TIMP1, ITGAV, IL18R1, CGREF1, SIGLEC8, BST2, MRC1, CCL16, ADAMTS8, PIGR, TCTN3, PALM2. The x-axis is labeled, Proportion Mediated. Tick labels shown are minus 0.02, 0, 0.02, 0.04, 0.06. Each mediator has a square marker with a horizontal confidence interval line. Values printed next to each mediator are: APOM, minus 1.34 percent, 3.02 percent to 0.17 percent. AGR2, 0.77 percent, 0.03 percent to 2.15 percent. VIT, 0.83 percent, 0.04 percent to 2.20 percent. GART, 0.83 percent, 0.02 percent to 2.02 percent. TIMP1, 0.87 percent, 0.02 percent to 2.34 percent. ITGAV, 0.88 percent, 0.05 percent to 2.24 percent. IL18R1, 1.18 percent, 0.09 percent to 2.78 percent. CGREF1, 1.27 percent, 0.20 percent to 2.88 percent. SIGLEC8, 1.37 percent, 0.12 percent to 3.06 percent. BST2, 1.39 percent, 0.04 percent to 3.15 percent. MRC1, 1.40 percent, 0.27 percent to 3.12 percent. CCL16, 1.59 percent, 0.43 percent to 3.38 percent. ADAMTS8, 2.01 percent, 0.70 percent to 4.31 percent. PIGR, 2.29 percent, 0.55 percent to 4.37 percent. TCTN3, 2.35 percent, 0.55 percent to 4.98 percent. PALM2, 3.43 percent, 1.66 percent to 6.15 percent.
Discussion
In this prospective cohort study, we found that higher sleep scores were significantly associated with a lower incidence of psychiatric disorders among individuals with newly defined preclinical obesity. In the proteomic association analysis with sleep score, 523 proteins were identified as significantly associated out of 2,913 measured proteins. Among these, MXRA8 and ITGAV showed the strongest positive associations with cardiovascular health scores, whereas PLG and SERPING1 showed the strongest negative associations. Using LASSO regression, we selected 90 representative proteins for subsequent mediation analysis and identified a range of proteins that significantly mediated the relationship between sleep and psychiatric disorders. For example, proteins such as PIGR, PALM2 and TCTN3 exhibited higher mediation proportions, suggesting that they may play key roles in the molecular mechanisms linking sleep to mental health outcomes.
Previous studies have consistently shown that individuals with obesity are at significantly higher risk of developing psychiatric disorders compared to healthy individuals (Simon et al., Reference Simon, Von Korff, Saunders, Miglioretti, Crane, Van Belle and Kessler2006; Steptoe and Frank, Reference Steptoe and Frank2023). In addition, recent research has reported strong positive associations between sleep disturbance and the risk of several psychiatric conditions, including ADHD, MDD, PTSD, schizophrenia and BD (Sun et al., Reference Sun, Liu, Liu, Wu, Wang, Qian, Ye and Mao2022). However, evidence remains limited regarding the relationship between sleep score and the risk of multiple classified psychiatric disorders in individuals with preclinical obesity. The present study addressed this gap. We observed that among individuals with preclinical obesity, an increase in sleep score was consistently associated with a decreased risk of psychiatric disorders, both when sleep score was treated as a continuous measure and when categorized. This inverse relationship was especially pronounced for ADHD, anxiety, BD, MDD and PTSD. Consistent with our findings, a previous study showed that improvements in sleep quality significantly reduced the risk of ADHD in obesity patients, and that poor sleep might exacerbate mind wandering, thereby increasing the severity of ADHD symptoms (Voinescu et al., Reference Voinescu, Szentagotai and David2012). Similarly, in extremely obese populations, poor sleep quality has demonstrated strong associations with mood disturbances, such as anxiety and depression (Araghi et al., Reference Araghi, Jagielski, Neira, Brown, Higgs, Thomas and Taheri2013). In contrast, in the disease-specific analysis, the association between sleep score and schizophrenia was not statistically significant. This finding is partly consistent with a two-sample bidirectional Mendelian randomization study reporting that genetically predicted insomnia and daytime sleepiness were not significantly associated with schizophrenia risk (Wang et al., Reference Wang, Chen, Wei, Zhuo, Xu, Li and Ma2022). However, it appears inconsistent with evidence showing that sleep disturbances are common in patients with schizophrenia and are associated with poorer clinical outcomes and greater symptom burden (Ferrarelli, Reference Ferrarelli2021). These inconsistencies may be explained by differences in study design, sleep measurement, participant populations and the limited number of schizophrenia cases in our disease-specific analysis. Collectively, our results emphasized sleep quality as a potentially important protective factor against multiple psychiatric disorders in individuals with preclinical obesity.
Although prior evidence has supported the beneficial effects of improving sleep quality on health outcomes, the underlying molecular mechanisms remain largely unexplored. In this study, we performed a detailed mediation analysis on 90 proteins previously identified as significantly associated with sleep score. These proteins are predominantly involved in pathways such as humoral immune response, receptor-mediated endocytosis, cytokine–cytokine receptor interaction and chemokine signalling. Among these, 16 exhibited statistically significant mediation effects in the relationship between sleep score and the risk of psychiatric disorders. Of particular note, PALM2 demonstrated the highest mediation proportion, suggesting its potential role as a key molecular intermediary linking sleep regulation to psychiatric risk. Members of the paralemmin protein family, including PALM2, are membrane-associated proteins previously implicated in neurodevelopment, particularly in promoting dendritic spine formation and synaptic maturation in hippocampal neurons (Kutzleb et al., Reference Kutzleb, Sanders, Yamamoto, Wang, Lichte, Petrasch-Parwez and Kilimann1998; Arstikaitis et al., Reference Arstikaitis, Gauthier-Campbell, Carolina Gutierrez Herrera, Huang, Levinson, Murphy, Kilimann, Sala, Colicos and El-Husseini2008). Recent findings have shown that PALM1 (Paralemmin 1), a paralog of PALM2, is a structural component of the membrane-associated periodic skeleton, a submembrane cytoskeletal network specialized for neuronal organization and known to regulate neuronal signalling and intercellular communication (Macarrón-Palacios et al., Reference Macarrón-Palacios, Hubrich, Do Rego Barros Fernandes Lima, Metzendorf, Kneilmann, Trapp, Acuna, Patrizi, d’Este and Kilimann2025). In addition, PIGR also showed a high mediation proportion. PIGR plays a critical role in maintaining mucosal immune barrier function and has been shown to facilitate bacterial infection across the blood–brain barrier, leading to meningitis (Al-Obaidi et al., Reference Al-Obaidi, Al Siyabi, Muthanna and Mohd Desa2024). Moreover, the chronic inflammatory microenvironment mediated by this protein (Li et al., Reference Li, Li, Qiao, Zhang, Tong, Xu and Zhang2024) may also contribute to the development of psychiatric disorders.
Importantly, TIMP1, IL18R1 and SIGLEC8 have well-established roles in immune regulation and humoral immune pathways (Gilli et al., Reference Gilli, Li and Pachner2016; Xu et al., Reference Xu, Yue, Shugart, Yuan, Wang, Wang, Lehrman, Zhang and Zhang2016; Korver et al., Reference Korver, Wong, Gebremeskel, Negri, Schanin, Chang, Leung, Benet, Luu and Brock2022). CCL16 and MRC1 are closely associated with leukocyte migration and chemotaxis pathways (Chi et al., Reference Chi, Lin, Wu, Chang, Wu, Yeh, Hsieh and Lin2024; Huang et al., Reference Huang, Chen, Tan, Huang, Gu, Liu, Zhang, Shi, Ding and Zheng2024). These findings suggested that the inverse association between sleep score and psychiatric disorders may be partially mediated by the activation of inflammatory responses. Previous reviews have indicated that nocturnal sleep deprivation activates inflammatory signalling pathways, including nuclear factor-κB, activator protein 1 and signal transducer and activator of transcription proteins, and increases the expression of proinflammatory cytokines such as TLR4, IL-6 and TNF (Irwin, Reference Irwin2019). These inflammatory signals are known to interfere with sleep architecture by altering neurotransmitter systems, which may in turn provoke physiological dysregulation and behavioural disturbances (Miller and Raison, Reference Miller and Raison2016). Such disturbances may contribute cumulatively to the onset of psychiatric disorders. The mediation analysis should be interpreted as exploratory because plasma proteins were measured at baseline, whereas psychiatric disorder incidence was assessed during follow-up. Nevertheless, the identified protein mediators may provide preliminary biological clues to the pathways linking sleep quality with psychiatric disorder risk. Although the mediation effects of these proteins were relatively modest, they reached statistical significance in this large-scale prospective cohort, suggesting potential biological relevance in the accumulation of long-term psychiatric risk. Integrating proteomic findings with other omics layers in future studies may help elucidate the multifactorial roles of these proteins in immune signalling, neuroplasticity and metabolic regulation.
The strengths of this study lie in the large sample size and extended follow-up period derived from the UK Biobank. The availability of ICD-10-coded diagnostic records, spanning nearly three decades and continuously updated after enrolment, facilitated precise identification of baseline obesity-induced dysfunctions and the diagnosis of specific psychiatric disorders. Furthermore, the application of high-throughput proteomic technology enabled characterization of the proteomic profile associated with combinations of modifiable risk factors and allowed evaluation of the potential role of plasma proteins in the association between modifiable level-related quality and the risk of psychiatric disorders. Several limitations must also be acknowledged. First, as this is an observational cohort study, causal inference between sleep scores and multiple psychiatric disorders cannot be established. Future interventional or randomized studies are needed to validate our findings. Moreover, reverse causation from subclinical or undiagnosed baseline psychiatric symptoms cannot be fully excluded. Therefore, the observed associations should be interpreted cautiously and not considered causal evidence. Furthermore, the mediation analysis was based on a subset with a limited sample size, which may differ from the main cohort. Although no significant differences were observed in major baseline characteristics, the possibility of systematic variation cannot be entirely excluded. In addition, comprehensive sleep-related information was self-reported, introducing the potential for measurement error and misclassification bias. Finally, due to the absence of longitudinal data, lifestyle and sleep-related factors were measured only once at baseline, despite the fact that these exposures are likely to vary over time. Therefore, future studies should investigate how changes in modifiable risk factors over time may affect the risk of psychiatric disorders.
In conclusion, optimal sleep quality was strongly and inversely associated with the risk of developing multiple psychiatric disorders among individuals with preclinical obesity. These findings highlight the potential clinical relevance of sleep-related parameters in psychiatric risk assessment and prevention among this population. Moreover, several plasma proteins were identified as significant mediators of this association. Further studies are needed to explore the biological mechanism involved.
Supplementary material
The supplementary material for this article can be found at https://doi.org/10.1017/S2045796026101024.
Availability of data and materials
The raw UK Biobank data are protected and are not available due to data privacy laws. Researchers can apply to use the UK Biobank resource for health-related research and public interest via the UK Biobank Access Management System (https://ams.ukbiobank.ac.uk/ams/).
Acknowledgements
We are grateful to all the participants of the UK Biobank and all the people involved in building the UK Biobank study.
Author contributions
Y.S. and S.L.: conceptualization, resources, project administration and supervision. M.X.: data curation, formal analysis, software, visualization and writing – original draft. Y.S.: funding acquisition and investigation. G.H., Y.S., S.L., W.C. and S.H.: methodology, validation and writing– review and editing. All authors read and approved the final manuscript. S. Lu can also be contacted for correspondence at lushengdi@shsmu.edu.cn.
Financial support
Y.S. was funded by the Collaboration in Action Program (CAP) 2024 supported by Our Lady of the Lake Health & Louisiana State University (LSU-OLOL-2024-06).
Competing interests
None.
Ethical standards
The UK Biobank received ethical approval from the North West Multi-Centre Research Ethical Committee. All participants provided written informed consent. This research was done under UK Biobank application number 177053, and the present study was approved by the UK Biobank Access Management Team. This observational cohort study was designed and conducted in accordance with the STROBE reporting guidelines. The authors assert that all procedures contributing to this work comply with the ethical standards of the relevant national and institutional committees on human experimentation and with the Helsinki Declaration of 1975, as revised in 2000.




 Open access

