Introduction
Disabling hearing loss is one of the world's most common disabilities affecting over 5 per cent of the world’s population.1,Reference Chadha, Cieza and Reyes2 The cost of unaddressed hearing loss is over 750 billion international dollars annually, affecting an estimated 330 million people. A considerable proportion of hearing loss cases are caused by chronic ear infections. The prevalence of hearing loss globally is expected to rise based on projections by the World Health Organization (WHO).3 South Asia has the highest prevalence of disabling hearing loss among adults over 65 years, with 48 per cent of adults and 2.4 per cent of children affected. It is also one of the regions with the lowest numbers of otolaryngologists and audiology specialists per capita.4 There is limited information regarding epidemiology of hearing loss and ear disease in low- and middle-income countries, but it is purported to be a significant burden in Nepal.4,Reference Maile, Tharu, Blanchford, Edmiston and Youngs5
Chronic suppurative otitis media (CSOM) is among the commonest causes of disabling hearing loss; however, many cases of CSOM can effectively be managed surgically.Reference Mann, Sharma, Gupta and Nagarkar6–Reference Tucci, Merson and Wilson9 A variant of CSOM, cholesteatoma, can lead to devastating consequences, including brain abscess, meningitis, labyrinthine erosion and facial palsy. Surgery is the principal modality in the management of CSOM and in addressing the associated hearing loss.Reference Wilson, Tucci, Merson and O'Donoghue8 The Britain Nepal Otology Service is a British charity and non-governmental organisation that assists Nepali doctors in the management of CSOM.10 The Britain Nepal Otology Service offers a community ear care programme, hearing aid service and surgical treatment by raising funds to enable qualified, self-funded professionals to take part in ear surgery operating camps using the facilities of the Britain Nepal Otology Service Ear Care Centre.10
Disabling hearing loss is prevalent; it is the world's most important disability in terms of years lost with disability, but measuring its effects in both individual and societal terms is difficult.Reference Wilson, Tucci, Merson and O'Donoghue8 For public health purposes, disability is as important as mortality.Reference Ustün, Kostanksek, Chatterji and Rehm11 Assessment of disability can predict factors that diagnosis alone fails to predict, and it is therefore useful in terms of identifying needs, matching treatments and interventions, measuring outcomes and effectiveness, setting priorities, and allocating resources.Reference Ustün, Kostanksek, Chatterji and Rehm11
Multiple tools have been produced to assess disability with associated advantages and disadvantages. The WHO Disability Assessment Schedule 2.0 (‘WHODAS 2.0’) was developed on the basis of an extensive cross-cultural study to directly link to the International Classification of Functioning, Disability and Health framework.
The WHO Disability Assessment Schedule 2.0 instrument has excellent psychometric properties and cross-cultural compatibility.Reference Ustün, Kostanksek, Chatterji and Rehm11 Specifically, the WHO Disability Assessment Schedule 2.0 has the advantage of being applicable to all diseases including physical, mental and substance use disorders and has proven useful in a wide range of clinical and service settings. In particular, it is useful for measuring the functioning impact of a health condition and has been validated for patients with hearing loss. Therefore, it is possible to compare different disabilities caused by other diseases.Reference Chisolm, Abrams, McArdle, Wilson and Doyle12 This has important and practical implications regarding resource allocation, public health priority setting and assessing treatment effectiveness.Reference Ustün, Kostanksek, Chatterji and Rehm11 The WHO Disability Assessment Schedule 2.0 domains assess different aspects as follows.Reference Ustün, Kostanksek, Chatterji and Rehm11 Domain 1, cognition: communication and thinking activities with specific areas for concentrating, remembering, problem solving, learning and communicating; domain 2, mobility: activities such as standing, moving around inside the home, getting out of the home and walking a long distance; domain 3, self-care: hygiene, dressing, eating and staying alone; domain 4, getting along: interactions with other people and difficulties that might be encountered with this life domain because of a health condition (in this context, ‘other people’ includes those known intimately or well, such as a spouse or partner, family members or close friends, and those not known well, such as strangers; domain 5, life activities: difficulty with day-to-day activities (i.e. those that people do on most days, including those associated with domestic responsibilities, leisure, work and school); domain 6, participation: social dimensions, such as community activities, barriers and hindrances around the respondent and issues such as maintaining personal dignity.
The questions do not necessarily and solely refer to the International Classification of Functioning, Disability and Health participation component as such, but also include various contextual (personal and environmental) factors affected by the health condition of the respondent.Reference Ustün, Kostanksek, Chatterji and Rehm11
Previous work has assessed quality of life in CSOM but not measured disability.Reference Maile, Tharu, Blanchford, Edmiston and Youngs5 Maile et al. used the Glasgow Benefit Index and Glasgow Health Inventory to assess quality of life following corrective surgery for CSOM in a similar population and demonstrated improvements as a result.Reference Maile, Tharu, Blanchford, Edmiston and Youngs5
CSOM and cholesteatoma are a leading cause of deafness and reduced quality of life, which has financial and health implications. Our study is the first to assess disability in patients with chronic ear disease and associated deafness in Nepal using the WHO Disability Assessment Schedule 2.0 instrument. Other objectives were to characterise the population and correlate the WHO Disability Assessment Schedule 2.0 score with variables including hearing level, age and total years of education, information included in the WHO Disability Assessment Schedule 2.0 questionnaire.
Materials and methods
Patients undergoing surgery for chronic ear disease during a Nepali ear camp undertaken by Britain Nepal Otology Service in March 2017 gave consent to inclusion in the study, and the WHO Disability Assessment Schedule 2.0 questionnaire was conducted in a private setting prior to ear surgery. Participation was voluntary and included all patients who had been screened by community ear assistants as suitable for ear surgery at the Britain Nepal Otology Service.
The WHO Disability Assessment Schedule 2.0 was translated into Nepali by a professional translation agency and delivered by one bilingual community ear assistant trained in administration of the questionnaire. Consent forms explained that participation would have no bearing on treatment. Identifiable patient data were anonymised and stored securely. Audiograms were conducted prior to ear surgery at the Britain Nepal Otology Service hospital as part of the routine service. Results are described with descriptive statistics, correlation coefficients, analysis of variance (ANOVA) and t-tests conducted using SPSS® statistical software (version 26).
Variables subject to statistical analysis included correlation coefficients for WHO Disability Assessment Schedule 2.0 overall scores and domain 6 scores with audiogram results; further correlations were performed for overall WHO Disability Assessment Schedule 2.0 scores with years of education and age. ANOVA was also performed for the following: audiogram results which were divided into mild (20–40 db HL), moderate (40–70 db HL), severe 70–90 db HL) and profound (more than 90 db HL). The Strengthening the Reporting of Observational Studies in Epidemiology statement checklist was used to aid the reporting of this study.Reference Von Elm, Altman, Egger, Pocock, Gøtzsche and Vandenbroucke13 Ethical review of the study was undertaken by trustees of the Britain Nepal Otology Service in the UK and trustees of the Britain Nepal Otology Service Ear Health Community Service in Nepal. This process was independent of those involved in the study.
Results
A total of 345 patients registered at the clinic; 120 patients underwent surgery, and 106 patients completed the WHO Disability Assessment Schedule 2.0 questionnaire prior to surgery. Table 1 displays demographic data and background information. Median age was 20 years (range, 12–50 years), and 45.3 per cent (48 of 106) were less than 20 years old with 15.1 per cent (16 of 106) unsure of their age. Sixty-five per cent of patients (69 of 106) were female and 35 per cent (37 of 106) were male. Eighty-three per cent (88 of 106) were from Nepal and 17 per cent (18 of 106) were from India, with the median estimated distance travelled being 35 km (range, 1–500 km). The mode for completed years of education was 0 (17.9 per cent), and the mean was 7.75 years (range, 0–18 years), which is displayed in Figure 1.
Histogram of completed years of education.

Demographic information

*n = 106
The most common work status was self-employed including owning a business or subsistence farming (44.3 per cent). Occupations included student (34 per cent) and farmer, most of whom were subsistence farmers (31.3 per cent). Presenting symptoms included deafness (93 per cent; 99 of 106) and otorrhoea (96 per cent; 102 of 106) with 49 of 106 patients having bilateral symptoms (46 per cent).
Mean audiogram results (bilateral) were 41.9 db HL (standard deviation (SD), 11.2 db HL; range, 24.6–78.3 db HL) and 34.6 db HL for the better hearing ear. Thirty-three per cent (35 of 106) met the WHO criteria for disabling deafness with mean thresholds in the better hearing ear greater than 40 db HL. There was no difference between mean audiogram results by country of origin (India, 47.7 db HL and Nepal, 46 db HL).
Diagnoses included cholesteatoma (16 per cent; 17 of 106) and CSOM without cholesteatoma (84 per cent; 89 of 106). A total of 106 operations included 87 myringoplasty procedures (82.1 per cent), 11 modified radical mastoidectomy procedures (10.4 per cent), 6 atticotomy procedures (5.7 per cent), 2 tympanoplasty procedures (1.9 per cent) and 11 patients (10.4 per cent) underwent revision surgery. Mean days of household work missed in the 30 days preceding surgery was 8 days, and for paid work was 7.4 days. Most patients stated they had to work at a lower level because of their health condition (95.3 per cent (101 of 106)) and 79.2 per cent (84 of 106) stated they earnt less money because of their condition.
Disability Assessment Schedule 2.0
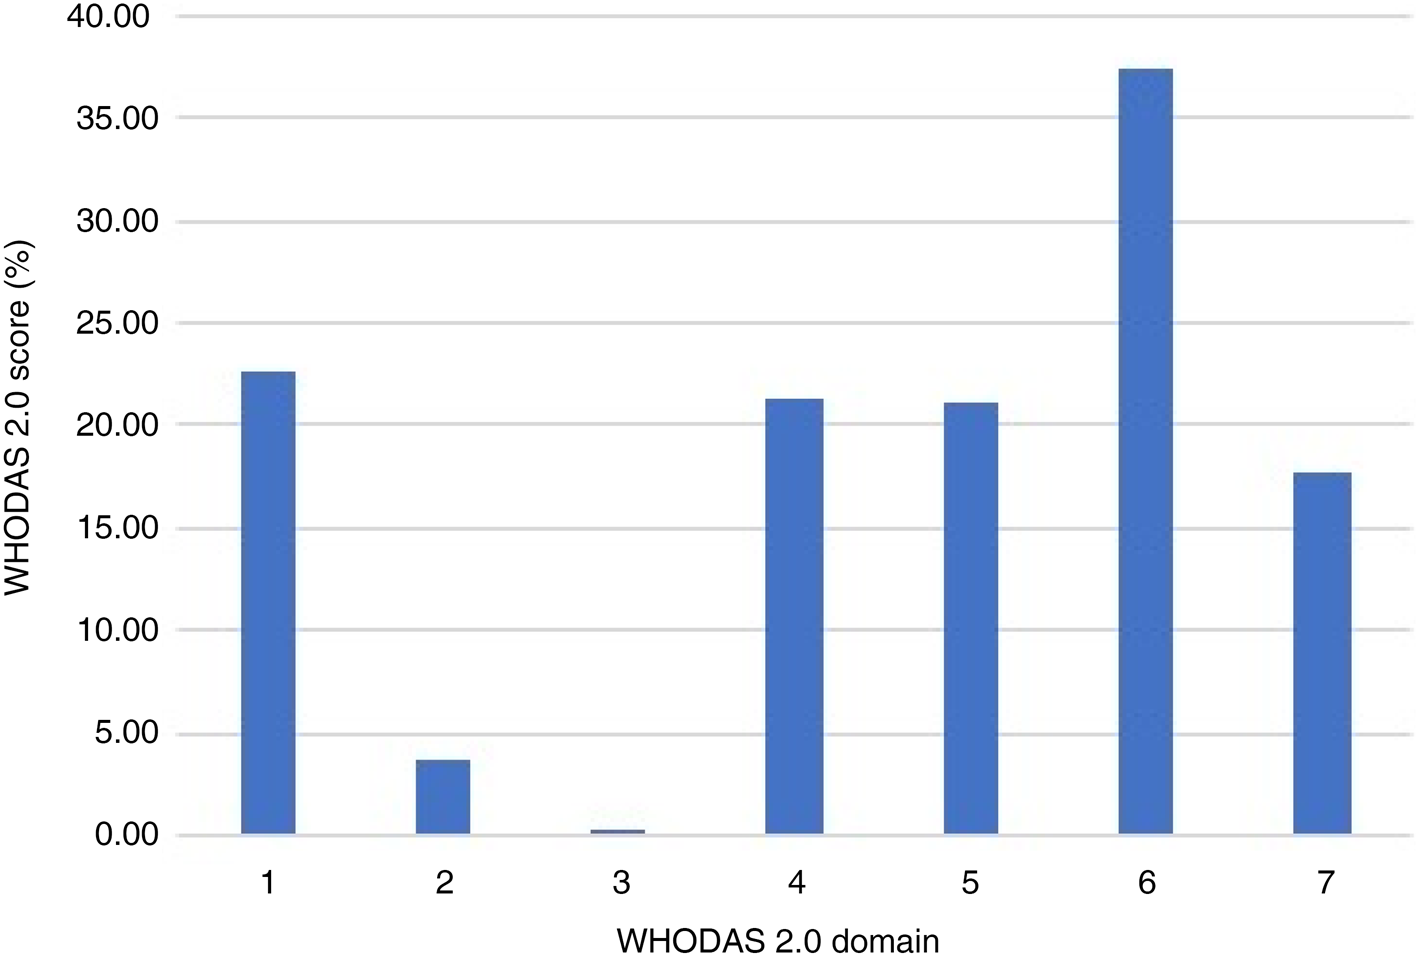
Overall mean WHO Disability Assessment Schedule 2.0 result was 17.7 per cent (SD, 8.9 per cent; range 0.5–45.1 per cent). The 6th domain, ‘participation in society’, had the highest median (37.35 per cent) and mean domain scores (34.38 per cent) as displayed in Figure 2.
Graph showing mean World Health Organization Disability Assessment Schedule 2.0 (WHODAS 2.0) domain scores.

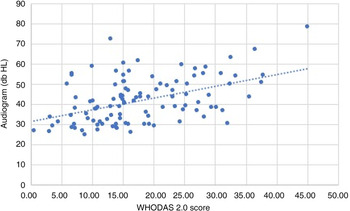
Mean WHO Disability Assessment Schedule 2.0 scores by country were 19.31 per cent for India and 17.47 per cent for Nepal. When grouped into mild, moderate and severe hearing loss, mean WHO Disability Assessment Schedule 2.0 scores were 14.08 per cent, 19.74 per cent and 21.1 per cent, respectively. Mean hearing level showed a moderate positive correlation (r = 0.46; p < 0.05) with the WHO Disability Assessment Schedule 2.0 score (Figure 3).
Graph showing mean audiogram versus World Health Organization Disability Assessment Schedule 2.0 (WHODAS 2.0) score.

The WHO Disability Assessment Schedule 2.0 score showed a weak negative correlation (r = −0.24; p < 0.05) with years of education, whereas age showed no correlation with the WHO Disability Assessment Schedule 2.0 score. Similarly, ‘participation’ (domain 6) versus mean hearing level showed a weak positive correlation (r = 0.44; p < 0.05), weak negative correlation with years of study (r = −0.24; p < 0.05) and showed no correlation against age. The patterns were similar for domains 1, 4 and 5 as well. Highest mean scores in the highest scoring domain were for questions D6.3 (1.71), D6.4 (2.03) and D6.5 (1.78), which related to ‘living with dignity, time spent on health condition and the emotional effect of the condition’, respectively.
An ANOVA between patients was conducted to compare the effect of hearing loss on disability for mild, moderate and severe hearing loss; there was a significant effect of hearing loss on disability at the p < 0.05 level for mild, moderate and severe hearing loss (F (2, 103) = 9.548; p = 0.000) (Figure 4). An independent-samples t-test was conducted to compare disability in mild-to-moderate and then moderate-to-severe hearing loss. There was a significant difference (t (99 degrees of freedom) = −3.7; p = 0.0) in the scores for mild (mean ± SD, 20.0 ± 10.7) and moderate (mean ± SD, 31.3 ± 13.7) hearing loss but not for moderate and severe (mean ± SD, 43.8 ± 21.1; t (80 degrees of freedom) = −1.9; p = 0.60) hearing loss. Taken together, these results suggest that hearing loss has an effect on disability as measured by the WHO Disability Assessment Schedule 2.0 score in moderate versus mild hearing loss but not moderate versus severe hearing loss.
Boxplot of median World Health Organization Disability Assessment Schedule 2.0 (WHODAS 2.0) score versus grade of hearing loss.

Following surgery, 82 of 106 (77 per cent) patients returned for follow up; 88 per cent (n = 72) had an intact tympanic membrane and a 10 db HL mean improvement in hearing.
Discussion
This study aimed to describe disability in a cohort of patients undergoing ear surgery in an area where there is an unmet need for ear care and hearing rehabilitation. It has been shown that there is an association between chronic ear disease and disability as measured with the WHO Disability Assessment Schedule 2.0 (mean, 17.7 per cent) in a cohort undergoing ear surgery at an ear camp run by the Britain Nepal Otology Service. This is at the 75th percentile when compared with population norms of WHO Disability Assessment Schedule 2.0 summary scores. Comparisons with studies of other conditions should be made with caution given the different methodologies in collecting data, but a study of veterans with adult onset hearing loss in the USA showed baseline WHO Disability Assessment Schedule 2.0 scores of 15.8 per cent at mean hearing levels of 34 db HL (500, 1000 and 2000 Hz).Reference Chisolm, Abrams, McArdle, Wilson and Doyle12
The demand for the service which is only available twice a year for 10 days is demonstrated by the users who were relatively young and of working age (mean age, 20 years old) with a median distance travelled of 35 km (maximum, 500 km), but with some users travelling from much further afield indicating the lack of availability locally. Work status questions indicated that a large proportion of users (31.3 per cent) were subsistence farmers, an occupation that has an association with poverty, although with development, livelihoods are progressively delinked from farming and land.Reference Rigg14 Of note in this study are the other relative indicators of poverty, including the mode for years of completed education being 0 years (mean, 7.75 years) with the average for Nepal being 12.2 years in 2017.15
Mean pre-operative hearing levels were 41.9 dB with 33 per cent of patients meeting the definition of disabling deafness as defined by the WHO.Reference Chadha, Cieza and Reyes2 There was a positive correlation between WHO Disability Assessment Schedule 2.0 score and hearing level measured in decibels. This correlation between worse hearing level and disability has not previously been demonstrated in low- and middle-income countries.
Taken together, these results suggest that hearing loss has an effect on disability as measured by the WHO Disability Assessment Schedule 2.0 score in mild versus moderate hearing loss but not moderate versus severe hearing loss. This may mean that moderate and severe hearing loss have similar impacts on disability or that the WHO Disability Assessment Schedule 2.0 is not sensitive enough to differentiate differences between moderate and severe hearing loss.
There was a weak inverse correlation of WHO Disability Assessment Schedule 2.0 versus years of completed education. There may be multiple reasons for this including error, but there is a possible protective effect of education against disability in this context. Deafness is associated with reduced cognitive function, but further work would be required to demonstrate if there is any effect as described above.Reference Lin, Ferrucci, Metter, An, Zonderman and Resnick16
The highest domain scores were for domain 6 (participation in society), domain 1 (cognition), domain 4 (getting along with people) and domain 5 (life activities) in that order, with low scoring for ‘mobility’ and ‘self-care’.Reference Chisolm, Abrams, McArdle, Wilson and Doyle12 This provides an insight into the disability experienced by this population. An example illustrating domain 6, ‘participation’, is the patient with a tympanic membrane perforation and deafness who could not participate in religious festivals involving submersion in water which would precipitate infection and discharge. These findings corroborate the literature regarding hearing loss and social isolation and fits with findings of other studies validating the WHO Disability Assessment Schedule 2.0.Reference Wilson, Tucci, Merson and O'Donoghue8,Reference Chisolm, Abrams, McArdle, Wilson and Doyle12 A further example is the female patient whose husband works abroad. Deafness from CSOM has affected her relationship with her husband's parents with whom she now cohabits because of communication difficulties regarding household duties. Another is a soldier who is prevented from joining the army because of deafness.
The highest domain scores give an insight into the effects of CSOM on patients, in particular living with dignity, time spent on the condition and emotional effects of the disease. Patients reported that their ear condition causes them to work at a lower level than they otherwise would (95.3 per cent), which may be a result of the known effects of stigma or psychological effects.Reference Wilson, Tucci, Merson and O'Donoghue8 A total of 79.2 per cent of patients also reported earning less money as a result of their condition with the financial implications of ear disease already well established.Reference Wilson, Tucci, Merson and O'Donoghue8,17
• World Health Organization Disability Assessment Schedule 2.0 was used to assess disability in chronic middle-ear disease
• There is a previously unreported correlation between disability and hearing loss in patients with chronic middle-ear disease
• The associated disability affects ‘participation in society’ more than other domains
• Health interventions in the UK and with outreach projects can be informed by measuring and quantifying health-related quality of life and associated disability
We did not complete follow-up questionnaires as a result of resource limitations and did not capture responses from all patients attending for the same reasons. Pre- and post-operative questionnaires would help standardise data collection in future and improve sample size to demonstrate significant effects of surgical intervention. Furthermore, there was no control group to internally validate the results, but the instrument has been shown to have good test–retest reliability in previous studies.Reference Ustün, Kostanksek, Chatterji and Rehm11,Reference Chisolm, Abrams, McArdle, Wilson and Doyle12
Conclusion
This study assesses and shows the impact of chronic ear disease on disability and helps characterise the users of the Britain Nepal Otology Service in Nepal. It demonstrates the need for further research into the impact of interventions in this population, highlighting the unmet need in the provision of ear care, surgical and non-surgical, with over 300 patients presenting for assessment but with capacity for only 120 to undergo surgery. Most of these cases will have been assessed by the community ear assistants as likely to benefit from surgery. Surgery or hearing aids can limit further deterioration of hearing from disease. This paper highlights and explores the disability from ear disease of an under-served group.17
Data availability statement
Data available on request.
Competing interests
None declared