Introduction
An epidemiological transition hypothesis has been developed to explain, simultaneously, cross-national variations in elderly suicide rates, trends over time for elderly suicide rates and age-associated trends in suicides rates reported in the literature (Shah and Bhat, in press). A developmental model of epidemiological transition for elderly suicide rates with four sequential stages was proposed (Shah and Bhat, in press). Although different countries will be at different stages of development within this model, it was proposed that each country would progress sequentially through the four stages over time. This model assumes that both socioeconomic status and suicide rates can be dichotomized into two groups: high and low. As this was the first study to test this hypothesis, the figures for high and low for both socioeconomic status and suicide rates were not defined and this definition was not needed for conducting the data analysis which used continuous variables. This model was adapted from similar epidemiological transition models for dementia (Suh and Shah, Reference Suh and Shah2001) and other mental disorders in old age (Shah, Reference Shah2007). This hypothesis refers to the prevailing long-term socioeconomic status of countries rather than temporary economic instability as both may influence suicide rates differently.
Low elderly suicide rate – low socioeconomic society stage
Low socioeconomic status has been associated with low rates of suicide in the general population (Simpson and Conklin, Reference Simpson and Conklin1989; Zhang, Reference Zhang1998) and in elderly men (Shah et al., Reference Shah, Bhat, MacKenzie and Koen2008a). Higher income inequality was also associated with lower suicide rates in the general population (Kowalski et al., Reference Kowalski, Faupel and Starr1987; Vijayakumar et al., Reference Vijayakumar, Nagaraj, Pirkis and Whiteford2005) and in the elderly (Shah et al., Reference Shah, Bhat, MacKenzie and Koen2008a). Other markers of economic adversity, including higher housing loan interest rates, have been associated with lower elderly suicide rates (Berk et al., Reference Berk, Dodd and Henry2006), although this is difficult to understand as the elderly in Australia rarely have mortages. Societies with low socioeconomic status have poorly developed healthcare services (Shah, Reference Shah2007; Reference Shah2009a; Jacob et al., Reference Jacob2007; Shah et al., Reference Shah, Bhat, MacKenzie and Koen2008a; Shah and Bhat, Reference Shah and Bhat2008a; Reference Shah and Bhat2008b). Poorly developed healthcare services may mediate an increase in child mortality rates by being unable to provide primary preventative measures for diseases in childhood (e.g. immunization programs) and treatment for diseases that are directly related to low socioeconomic status (e.g. infectious diseases) (Suh and Shah, Reference Suh and Shah2001). Child mortality rates are higher in countries with low socioeconomic status and higher income inequality (Zhang, Reference Zhang1998; Shah, Reference Shah2007; Shah et al., Reference Shah, Bhat, MacKenzie and Koen2008a). Increased child mortality rates will, in turn, reduce life expectancy (Zhang, Reference Zhang1998; Shah, Reference Shah2007; Shah et al., Reference Shah, Bhat, MacKenzie and Koen2008a). Given that suicide rates generally increase with age (Shah and De, Reference Shah and De1998), reduced life expectancy will result in fewer people reaching the age of increased risk for suicide in societies with low socioeconomic status. This, in turn, will result in a reduced number of elderly suicides in countries with low socioeconomic status because there is a positive correlation between elderly suicide rates and elderly population size (Kiemo, Reference Kiemo2004; Shah et al., Reference Shah, Bhat, MacKenzie and Koen2008a) and elderly dependency ratios (Shah et al., Reference Shah, Padayatchi and Das2008b). Selective survival of those at reduced risk of suicide in old age due to genetic or constitutional factors may further compound this trend (Suh and Shah, Reference Suh and Shah2001). Moreover, in societies with low socioeconomic status, those who do survive into old age may be at reduced risk of suicide because they may be better able to tolerate additional hardship in old age due to life-long exposure to adversity (Seiden, Reference Seiden1981; McIntosh, Reference McIntosh1984; Lindesay, Reference Lindesay1991).
The above approach is consistent with a previously demonstrated model with five sequential stages (Shah et al., Reference Shah, Bhat, MacKenzie and Koen2008a): (i) presence of low socioeconomic status; (ii) low socioeconomic status leading to poorly developed healthcare services; (iii) poorly developed healthcare services may interact, mediate and modify other factors and contribute to increased child mortality rates; (iv) increased child mortality rates then lead to reduced life expectancy; and, (v) reduced life expectancy results in fewer people reaching the age of increased risk of suicide, and in low elderly suicide rates in societies with low socioeconomic status. This can be labeled as the stage of low elderly suicide rates and a low socioeconomic society.
High elderly suicide rate – low socioeconomic society stage
With improvement in the socioeconomic status of countries, the development of healthcare services will also improve (Zhang, Reference Zhang1998; Shah, Reference Shah2007; Reference Shah2009a; Jacob et al., Reference Jacob2007; Shah et al., Reference Shah, Bhat, MacKenzie and Koen2008a; Shah and Bhat, 2008). Improvement in healthcare services may facilitate reduction in child mortality rates because of improved ability to provide primary preventative measures for diseases in childhood (e.g. immunization programs) and treatment for diseases that are directly related to low socioeconomic status (e.g. infectious diseases) (Suh and Shah, Reference Suh and Shah2001). Reduction in child mortality rates will, in turn, increase life expectancy (Zhang, Reference Zhang1998; Kiemo, Reference Kiemo2005; Shah, Reference Shah2007; Shah et al., Reference Shah, Bhat, MacKenzie and Koen2008a). This, in turn, will result in greater numbers of people reaching the age of increased risk of suicide and an increase in elderly suicide rates (Shah et al., Reference Shah, Bhat, MacKenzie and Koen2008a). This approach is also consistent with the five-stage sequential model described above in the section on low elderly suicide rates – low socioeconomic society stage (Shah et al., Reference Shah, Bhat, MacKenzie and Koen2008a). This will lead to a gradual transition from the low elderly suicide rate–low socioeconomic society stage to a high elderly suicide rate–low socioeconomic society stage.
High elderly suicide rate – high socioeconomic society stage
As societies develop they are likely to change from being socioeconomically less developed to being socioeconomically more developed (Zhang, Reference Zhang1998; Shah, Reference Shah2007, Reference Shah2009a; Jacob et al., Reference Jacob2007; Shah and Bhat, 2008; Shah et al., Reference Shah, Bhat, MacKenzie and Koen2008a). Further improvement in healthcare services may facilitate further reductions in child mortality rates because of improved ability to provide primary preventative measures for diseases in childhood (e.g. immunization programs) and treatment for diseases that are directly related to low socioeconomic status (e.g. infectious diseases) (Suh and Shah, Reference Suh and Shah2001). Further reductions in child mortality rates will, in turn, further increase life expectancy (Zhang, Reference Zhang1998; Kiemo, Reference Kiemo2004; Shah, Reference Shah2007; Shah et al., Reference Shah, Bhat, MacKenzie and Koen2008a). This, in turn, will result in increasing numbers of people reaching the age of increased risk of suicide (Shah et al., Reference Shah, Bhat, MacKenzie and Koen2008a). Reduced child mortality rates and increased life expectancy will also lead to reduction in selective survival of those at reduced risk of suicide in old age due to constitutional or genetic factors. Furthermore, the protective effects of life-long adversity on elderly suicide rates (McIntosh, Reference McIntosh1984; Seiden, Reference Seiden1981; Lindesay, Reference Lindesay1991) may be absent in countries with higher socioeconomic status. The composite effect of these changes would be an increase in the number of individuals at increased risk of suicide in old age in socioeconomically more developed societies. This approach is also consistent with the five stage sequential model described above in the section on Low elderly suicide rates – low socio-economic society stage (Shah et al., Reference Shah, Bhat, MacKenzie and Koen2008a). This will lead to a gradual transition from the high elderly suicide rate–low socioeconomic society stage to a high elderly suicide rate–high socioeconomic society stage.
Low elderly suicide rate – high socioeconomic society stage
Theoretically, in socioeconomically well-developed societies, due to further reduction in child mortality rates and an increase in life expectancy, a greater number of people would reach the age of increased risk of suicide, resulting in higher elderly suicide rates. However, in many socioeconomically well-developed countries (e.g. Italy, Netherlands, Norway, U.K. and U.S.A.) elderly suicide rates are comparatively low (Shah et al., Reference Shah, Bhat, MacKenzie and Koen2007) and have declined over time (Shah et al., Reference Shah, Bhat, MacKenzie and Koen2008c). The five-stage sequential model described above in the section on “low elderly suicide rates – low socioeconomic status society stage” (Shah et al., Reference Shah, Bhat, MacKenzie and Koen2008a) may not apply to socioeconomically very well-developed societies. Here, elderly suicide rates may progressively decline over many years due to improved efforts to control the risk factors for elderly suicides, enhanced protective factors for elderly suicides, advances in medical care, prompt resuscitation of those who attempt suicide, better provision of healthcare (including mental health) services and public health initiatives to reduce suicide rates (Gunnell et al., Reference Gunnell, Middleston, Whitley, Dorling and Frankel2003; Kua et al., Reference Kua, Ko and Ng2003; Lodhi and Shah, Reference Lodhi and Shah2004; Reference Lodhi and Shah2005; Yip et al., Reference Yip, Liu, Hu and Song2005; Shah and Coupe, Reference Shah and Coupe2009; Shah, Reference Shah2009b). Ultimately, this will lead to a gradual transition from a high elderly suicide rate–high socioeconomic society stage to a low elderly suicide rate–high socioeconomic society stage.
The epidemiological transition model proposed above would follow an inverted U-shaped curve with a quadratic pattern (y = a + bx − cx2, where a, b and c are constants, y is the elderly suicide rates and x is the measure of socioeconomic status). Therefore, this model was tested using the latest available data on elderly suicide rates (the data set used in this study is different from all previous published work from our group) from the World Health Organization (WHO).
Methods
Suicide rates
Data on suicide rates for males and females in the age-bands 65–74 and 75+ years were ascertained from the WHO (http://www.who.int/whosis/database/mort/table1.cfm). For a small number of countries only the raw figures for the number of suicides were available from the WHO website. Suicide rates for such countries were calculated by dividing the number of reported suicides by the population size in the relevant age-band and sex group available on the same website. Data were ascertained for the latest year. The median (range) for the year of the suicide rate data was 2005 (1970–2007); the total number of countries with this data was 127.
Data on socioeconomic status and other variables
Gross domestic product (GDP) has been used as a proxy measure for socioeconomic status of countries in previous studies of suicide rates (Zhang, Reference Zhang1998; Gunnell et al., Reference Gunnell, Middleston, Whitley, Dorling and Frankel2003; Shah et al., Reference Shah, Bhat, MacKenzie and Koen2008a). Data on per capita expenditure on healthcare, the proportion of GDP spent on healthcare and child mortality rates have collectively been used as proxy measures of the quality and quantity of healthcare services (Shah, Reference Shah2007; Shah et al., Reference Shah, Bhat, MacKenzie and Koen2008a). Data on GDP, per capita expenditure on healthcare and the proportion of GDP spent on healthcare, life expectancy and child mortality rates were ascertained from the WHO website (http://www.who.int/countries/afg/en/) for the year 2006.
Data analysis
Normal distribution for suicide rates in both sexes in both elderly age-bands and GDP was examined using a quantile-quantile (Q-Q) plot. This is a scatter plot with the quantiles of the scores on the x-axis and the expected normal scores on the y-axis. These plots for suicide rates in both sexes in both elderly age-bands and for GDP were a near straight line, suggesting normal distribution.
Initially, the relationship between suicide rates and GDP was examined using linear regression models. The relationship between suicide rates and GDP was subsequently examined with a curve estimation regression model in order to test the a priori hypothesis of a curvilinear relationship (inverted U-shaped curve) fitting the quadratic equation y = a + bx – cx2 (as defined above). The regression model was evaluated against the assumptions of regression analysis including evaluation of residuals distributions (using Q-Q plots to establish normal distribution), heteroscedasticity/homoscedasticity (by plotting standardized residuals and predicted values) and outliers (using leverage and Cook's distance). Heteroscedasticity is a situation in which the variance of the dependent variable varies across the data and complicates regression analysis as it is based on the assumption of equal variance. Homoscedasticity is a situation in which the variance of the dependent variable is the same for the whole data and this facilitates regression analysis as it is based on the assumption of equal variance. Outliers have an unusual y-axis value relative to their predicted values. High leverage points have unusual combinations of x-values relative to general data set patterns. Cook's distance is a composite measure of outlyingness and leverage. Observations with Cook's distance values of greater than one are generally thought to be sufficiently influential to affect the findings in regression analysis.
The relationships between suicide rates and per capita expenditure on healthcare, the proportion of GDP spent on healthcare, life expectancy and child mortality rates were examined with Pearson's correlation coefficient. The inter-relationships between GDP and per capita expenditure on healthcare, the proportion of GDP spent on healthcare, life expectancy and child mortality rates were also examined with Pearson's correlation coefficient.
The SPSS version 16 statistics package was used for the analyses.
Sensitivity of the data analysis
Two methods of sensitivity were employed. First, although the median for the year of the suicide rate data was 2005, the range was very wide (1970–2007). Therefore, the curvilinear relationship between elderly suicide rates and GDP was re-examined with a curve estimation regression model for countries with recent data (for the year 2000 or later) for elderly suicide rates; this analysis included 92 countries. Second, the curve regression analyses were repeated by removing countries with a Cook's distance greater than one.
Results
Linear and curve regression analyses
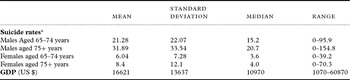
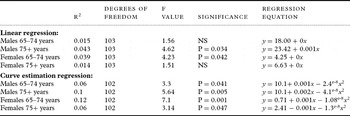
Data on both elderly suicide rates and GDP were available for 105 countries from the WHO website. Table 1 shows the descriptive characteristics for elderly suicide rates in both sexes in both elderly age-bands and for GDP. Table 2 illustrates the characteristics of the linear regression and curve estimation regression models for males and females in both elderly age-bands. There was a significant linear relationship only between suicide rates in males aged 75+ years and females aged 65–74 years and GDP. The relationship between suicide rates in males and females in the age-bands 65–74 years and 75+ years and the GDP was curvilinear (inverted U-shaped curve) and fitted the quadratic equation y = a + bx − cx2; this relationship was statistically significant (at least p < 0.05) in all four groups. Curve regression models were thought to be better because: (i) linear regression analyses were significant in only two of the four elderly age and sex bands (males aged 75+ and females aged 65–74 years) compared to the curve regression analysis being significant for all four groups; (ii) the variance in suicide rates explained by GDP was lower with linear regression; (iii) the curve regression model confirmed the a priori study hypothesis; (iv) the scatter plots of suicide rates against GDP suggested an inverted U-shaped curve rather than a straight line; (v) the Q-Q plot of residuals was a near straight line suggesting normal distribution; and (vi) scatter plots of residuals against fit values from the curve regression analysis for suicide rates in both sexes for both the elderly age-bands did not show any pattern, suggesting that the quadratic equation is acceptable because the residuals were independent of the predictive values.
Basic characteristics of suicide rates and GDP

*Suicide rates were per 100,000 of the relevant age and sex groups in the general population
Linear and curve estimation regression models for the relationship between elderly suicide rates and GDP

y = Suicide rates
x = GDP
a, b and c are constants
Sensitivity analyses
By only including the 92 countries with recent data (for the year 2000 or later), the findings from the first sensitive analysis on suicide rates were similar to the curve regression analysis.
The plot of standardized residuals against predicted values in both sexes in both elderly age-bands suggested homoscedasticity. The second sensitivity analysis of the curve regression analysis, conducted by excluding countries with a Cook's distance greater than one, revealed the same quadratic pattern for males aged 65–74 years, males aged 75+ years and females aged 65–74 years, which was significant at the 0.05 level; the same quadratic pattern was observed for females 75+ years, but the p-value was 0.12.
Other correlations
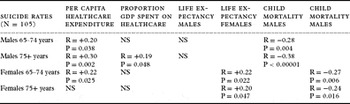
Table 3 illustrates the correlations between elderly suicide rates and per capita expenditure on healthcare, the proportion of GDP spent on healthcare, life expectancy and child mortality rates. There were significant positive correlations between suicide rates in males in both elderly age-bands, females aged 65–74 years and per capita expenditure on healthcare. There was a significant positive correlation between suicide rates in males in the age-band 75+ years and the proportion of GDP spent on healthcare. There were significant positive correlations between suicide rates in females aged 65–74 years and 75+ years and life expectancy. There were significant negative correlations between suicide rates in both sexes in both elderly age-bands and child mortality rates.
The relationship between elderly suicide rates and other measured variables

NS = Not significant
GDP was significantly positively correlated with per capita expenditure on healthcare (r = +0.81, P < 0.00001), the proportion of GDP spent on healthcare (r = +0.23, P = 0.017) and life expectancy for males (r = +0.70, P < 0.00001) and females (r = +0.65, P < 0.00001), and significantly negatively correlated with male child mortality rates (r = −0.60, P<0.00001) and female child mortality rates (r = −0.57, P < 0.00001). The per capita expenditure on healthcare was significantly positively correlated with the proportion of GDP spent on healthcare (r = +0.59, P < 0.00001), life expectancy for males (r = +0.62, P < 0.00001) and females (r = +0.60, P < 0.00001), and significantly negatively correlated with male (r = −0.51, P < 0.00001) and female (r = −0.49, P < 0.00001) child mortality rates. The proportion of GDP spent on healthcare was significantly positively correlated with life expectancy for males (r = +0.24, P = 0.014) and females (r = +0.20, P = 0.038), but not significantly correlated with male and female child mortality rates. There was a significant negative correlation between life expectancy and child mortality rates for males (r = −0.75, P<0.00001) and females (r = −0.86, P < 0.0001).
Discussion
Some methodological issues need consideration. Cross-national data on suicide rates should be viewed cautiously for the following reasons: data were not available from all countries (Moscicki, Reference Moscicki1995; Wasserman et al., Reference Wasserman, Cheng and Jiang2005); the validity of this data was unclear (Diekstra, Reference Diekstra1989; Wasserman et al., Reference Wasserman, Cheng and Jiang2005); the legal criteria for the proof of suicide vary between countries and within different regions of the same country (Shah and Ganesvaran, Reference Shah, Ganesvaran, Chiu and Ames1994; Wasserman et al., Reference Wasserman, Cheng and Jiang2005); some countries, particularly low-income countries, may have poor death registration facilities (Shah and Ganesvaran, Reference Shah, Ganesvaran, Chiu and Ames1994); and, cultural and religious factors and stigma attached to suicide may lead to under-reporting of suicides (Wasserman et al., Reference Wasserman, Cheng and Jiang2005; Abrahams et al., Reference Abrahams, Abrahams and Jacob2005). Data on socioeconomic status and health-related measures should also be viewed with caution because: the validity of this data is unclear; some countries may have poor registration facilities for data on health-related measures; some countries may have poor infrastructure for providing accurate financial data (Shah et al., Reference Shah, Bhat, MacKenzie and Koen2008a); and, their influence on social distribution of risk factors may be complex (Lynch et al., Reference Lynch2004). These latter concerns are more likely to be observed in low-income countries. Also, the influence of other variables was not controlled for in the curve regression analysis because this is not possible with curve regression models where only the relationship between two variables can be examined. Income inequality is an important variable in this context because socioeconomic status measured by GDP and income inequality measured by the Gini coefficient are inversely correlated (Shah et al., Reference Shah, Bhat, MacKenzie and Koen2008a), but it was not possible to control for this variable. However, data were gathered from the WHO data bank and were the latest and best available data set. Moreover, in the sensitivity analysis the findings of the curve estimation regression models were similar for the entire data set and for countries with more recent data (for the year 2000 or later) on suicide rates. Furthermore, similar findings have been published for the relationship between elderly suicides rates and urbanization using WHO data on suicide rates for different years supporting the validity of using WHO suicide rate data in ecological studies (Shah, Reference Shah2009c). Also, the relationship between elderly suicide rates and data on psychiatric funding, policy and service provision from two sources several years apart were identical, again supporting the validity of using WHO suicide rate data in ecological studies (Shah and Bhat, Reference Shah and Bhat2008a).
The findings of significant curvilinear (inverted U-shaped curve) relationships between suicide rates in both sexes in both elderly age-bands and the GDP fitting the quadratic equation y = a + bx − cx2 confirmed the a priori study hypothesis. This may be an artifact of the methodological issues described. However, there is supporting evidence, consistent with the literature, suggesting that the finding may be genuine and is examined below.
The inter-correlations between per capita expenditure on healthcare, the proportion of GDP spent on health, life expectancy and child mortality rates, and between these variables and both elderly suicide rates and GDP were consistent with the literature and supported the theoretical background used in developing the epidemiological transition hypothesis – both described above. First, the positive correlations between GDP and both per capita expenditure on healthcare and the proportion of GDP spent on healthcare suggests that health care services may be poorly developed in countries with low socioeconomic status, and is consistent with the literature (Shah, Reference Shah2007; Reference Shah2009a; Jacob et al., Reference Jacob2007; Shah et al., Reference Shah, Bhat, MacKenzie and Koen2008a; Shah and Bhat, Reference Shah and Bhat2008a; Reference Shah and Bhat2008b). Second, both per capita expenditure on healthcare and the proportion of GDP spent on healthcare were significantly and negatively correlated with child mortality rates, which is consistent with the literature (Zhang, Reference Zhang1998; Shah, Reference Shah2007; Shah et al., Reference Shah, Bhat, MacKenzie and Koen2008a). Poorly developed healthcare services may mediate an increase in child mortality rates by being unable to provide primary preventative measures for diseases in childhood (e.g. immunization programs) and treatment for diseases that are directly related to low socioeconomic status (e.g. infectious diseases) (Suh and Shah, Reference Suh and Shah2001). Third, child mortality rates were significantly and negatively correlated with life expectancy, which is consistent with the literature (Zhang, Reference Zhang1998; Shah et al., Reference Shah, Bhat, MacKenzie and Koen2008a; Shah, Reference Shah2007). This observation also supports each of the four stages of the epidemiological transition hypothesis of elderly suicide rates. Given that suicide rates generally increase with age (Shah and De, Reference Shah and De1998), reduced life expectancy will result in fewer people reaching the age of increased risk for suicide in societies with low socioeconomic status. Finally, there were generally significant and positive correlations between life expectancy and elderly suicide rates, which is also consistent with the literature (Shah et al., Reference Shah, Bhat, MacKenzie and Koen2008a). Collectively, these observations support each of the first three stages of the epidemiological transition hypothesis of elderly suicide rates and they also partly support the fourth stage. Furthermore, the generally significant correlations between elderly suicide rates and per capita expenditure on healthcare (positive), the proportion of GDP spent on health (positive), child mortality rates (negative) and life expectancy (positive) also support each of the first three stages of the epidemiological transition hypothesis of elderly suicide rates and they also partly support the fourth stage.
Caution should be exercised in accepting this model of the epidemiological transition hypothesis for elderly suicide rates because it has been generated from cross-sectional data using an ecological design and is subject to ecological fallacy. It is, therefore, difficult to be conclusive about the etiological implications and the findings may merely be an association. Moreover, the variance in suicide rates explained by this inverted U-shaped curvilinear relationship is small and other additional explanatory models therefore require investigation. Furthermore, the influence of socioeconomic status on elderly suicide rates may interact with, mediate or modify the effect of other factors not examined in this study. These factors include cross-national differences in rural/urban location, the distribution of protective and risk factors in the prevalence of mental illness in different age and sex groups (Shah et al., Reference Shah, Bhat, MacKenzie and Koen2007), genetic factors that differentially predispose different age and sex groups to mental illness or directly to suicidal behavior (Shah et al., Reference Shah, Bhat, MacKenzie and Koen2007), cultural factors with differential influence on different age and sex groups (Kua et al., Reference Kua, Ko and Ng2003; Yip et al., Reference Yip, Liu, Hu and Song2005), and cohort effects with differential influence on different age and sex groups (Woodbury et al., Reference Woodbury, Manton and Blazer1987; Gunnell et al., Reference Gunnell, Middleston, Whitley, Dorling and Frankel2004). Ideally, this model requires rigorous testing by following the development of selected countries of low socioeconomic status over time; if this model is accurate then such countries would go through all four stages and the changes would follow the predicted curvilinear (inverted U-shaped) relationship.
Conflict of interest
None.
Acknowledgments
The comments of three anonymous reviewers were greatly appreciated.