Introduction
Prostate cancer is the second highest cause of cancer death in males in developed countries, and the incidence and death rates have been steadily increased in developing countries.Reference Torre, Bray, Siegel, Ferlay, Lortet-Tieulent and Jemal1, Reference Mottet, Bellmunt and Bolla2 External beam radiation therapy (EBRT) is one of the primary treatments options, nevertheless, radiotherapy of prostate tumors can be toxic due to the high dose to the surrounding organs-at-risk (OARs) such as rectum and bladder.
Volumetric modulated arc therapy (VMAT) is a radiation technique, which can reach highly conformal dose distributions with enhanced target volume coverage, sparing of normal tissues compared to conventional radiotherapy techniques.Reference Pollack, Hanlon and Horwitz3 Therefore, it has become the gold standard for EBRTReference Mottet, Bellmunt and Bolla2 in prostate cancer. In combination with image-guided radiotherapy (IGRT), it can limit the rectum and bladder to low doses allowing high doses to the target volumes including pelvic lymph node treatment, with low side effects.Reference Nguyen, Davis and Bose4
Simulation is a critical preparation step before radiation treatment. The simulated setup will be exactly reproduced by comparing the 3D on-board images to the simulation CT scan.Reference Nguyen, Davis and Bose4 In current practice, for prostate cancer radiotherapy, many centers carry out the original treatment plan to completion without accounting for anatomical changes that can occur due to weight variations and normal tissue volume alterations. This fact can lead variations in patient’s body shapeReference Rodriguez, Freedland and Deka5, Reference Bolze, Fosmire, Stryker, Chung and Flipse6 and the body region does not match exactly with the original CT.
Furthermore, these volumetric changes can have an impact on delivered doses to the normal tissues and target structures as planned from the original pretreatment plan. These changes can greatly influence the penetration depth of charged particles and modify target coverage.Reference Nguyen, Davis and Bose4, Reference Houweling, Fukata and Kubota7 Fractionated photon irradiation of prostate tumors is not robust against changes in body contour with dose coverage being highly affected. It can greatly modify target dose coverage when using bony anatomy-based position verification.Reference Choi, Jo and Chae8–Reference Chow and Jiang10 The result of dosimetric change is a discrepancy of delivered dose to the planned target volumes (PTVs) and organs at risk (OARs).
There is little information on the effect of weight change (gain or loss) to the dosimetric impact due to the change of body contour for prostate cancer. The aim of this study is to investigate the impact of anatomical changes in prostate cancer patients on the target coverage when using 6 MV beams-VMAT therapy. Therefore, accumulated dose distributions were calculated for different anatomical changes and compared to the planned dose distributions. Another purpose of the study is to propose strategies that allow us to evaluate the dose or correct it by normalization without having to perform a new simulation. Normalization is a method that is sometimes used in radiation therapy planning as a means of satisfying or obtaining acceptable dose coverage to the PTVs. The results may be transferred to other types of cancers in the pelvic area such as endometrium, rectum or anal cancer.
Material and Method
Patients
Ten patients of high-risk prostate cancer were chosen for the study. All of them were simulated with an empty rectum and a comfortably full bladder in the supine position with ankle stocks. An enema per rectum was given before simulation to empty the rectum as much as possible.
Planning CT images were acquired using a CT simulator (Aquilion™ LB, Canon Medical Systems). The structures outlined included the prostate (PTV1), seminal vesicles (PTV2), pelvic lymph nodes (PTV3), rectum (entire contents) from the ischial tuberosities to the sigmoid flexure, bladder (entire contents), right and left femoral heads and the external contour.
Each treatment was planned with a 6 MV photon beam for a Varian Clinac 21 DHX (Varian Medical System, Palo Alto, CA), and a 120-leaf Millennium MLC system was used. Treatment plans were created using inverse plan optimized by the Eclipse RapidArc algorithm v15·1·51 (Varian Medical Systems, Palo Alto, CA). Dose grid resolution was set to 0·25 cm and calculation was performed using Acuros algorithm (v15·6·03).
Mimicking weight gain or loss
The expansion and contraction of body contours due to size changes were mimicked by increasing and decreasing the body contour with depths of −2, −1·5, −1, −0·5, 0, 0·5, 1, 1·5 and 2 cm, in the anterior, and both lateral directions of the patient based on our clinical experience and in a similar way (only for reduced depths) as in Chow and Jiang.Reference Chow and Jiang11 For expansion, we used in the new contour, the mean value of Hounsfield units that were measured for the abdominal fat in each patient. For contraction, the external volume was evaluated by cutting. The missing tissue was assigned a density of air equivalent.
Dose-volume histogram statistics
All test plans were delivered using the same isocenter and monitor units as the original plan and compared against the original unedited plan. A total of 90 plans were evaluated, 9 for each patient. Dose-volume histogram statistics were extracted from each plan and normalized to prescription dose.
Normalize
The evolution of all items mentioned (PTVs and OARs) was studied by least squares data fitting. For the target volumes (PTVs), we focused on the maximum, minimum and medium doses. For OAR’s (rectum, bladder and femoral heads), we focused on the maximum and median dosages. Then, we evaluated the mean slope of the evolution forms of data fitting that was computed as the value of normalization.
To evaluate the value of normalization computed previously as an alternative to re-simulation, dosimetric effects of the modified plan were compared to the original plan. The dose differences between the plans were determined by comparing dose-volume histograms and analyzing the 3D-gamma index between them. To do this, dose matrices were exported from the treatment planning system.
The use of the gamma index evaluation has become a standard technique to contrast measured distributions against the ones predicted by commercial treatment planning systems.Reference Low, Harms, Mutic and Purdy12 The comparison between plans and dose distributions was performed with the software Verisoft 5·1 (PTW). Measured dose was compared with the 3D dose distribution from the treatment planification system using a 3D global gamma analysis.Reference Low, Harms, Mutic and Purdy13 For the VMAT plans, the gamma pass rates were calculated using gamma parameters 3 mm and 3%,Reference Low, Harms, Mutic and Purdy13, Reference Mans, Schuring and Arends14 a dose threshold of 10% of the measured maximum dose and a pass criterion of 95% or higher was used. To avoid close skin tissue, what obviously will not match, we performed the analysis in a cube of 18 cm × 20 cm × 20 cm (height × length × width) centered in the isocenter of the treatment.
Results
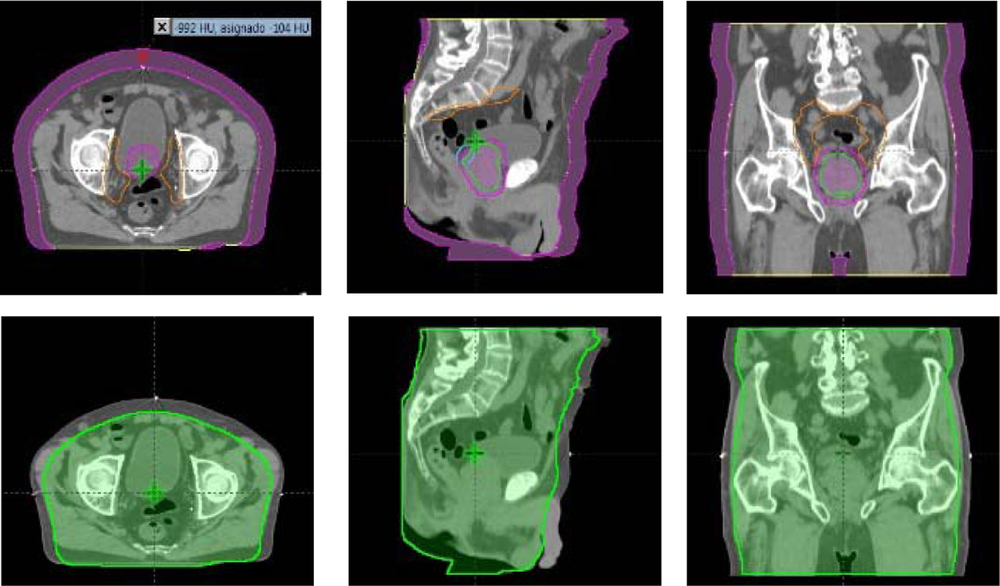
Size expansions or reductions used to modify patient’s body contour were performed while the bone anatomy remained unchanged. Figure 1 shows a typical patient anatomy in the axial, coronal and sagittal view after the body contour was expanded (purple) or contracted (green) for a thickness of 2 cm.
CT images of the axial, sagittal and coronal views for a patient with magnified (purple) and reduced (green) depths (anterior, left and right direction) of 2 cm.

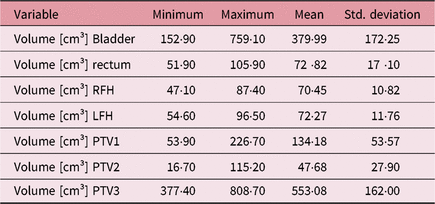
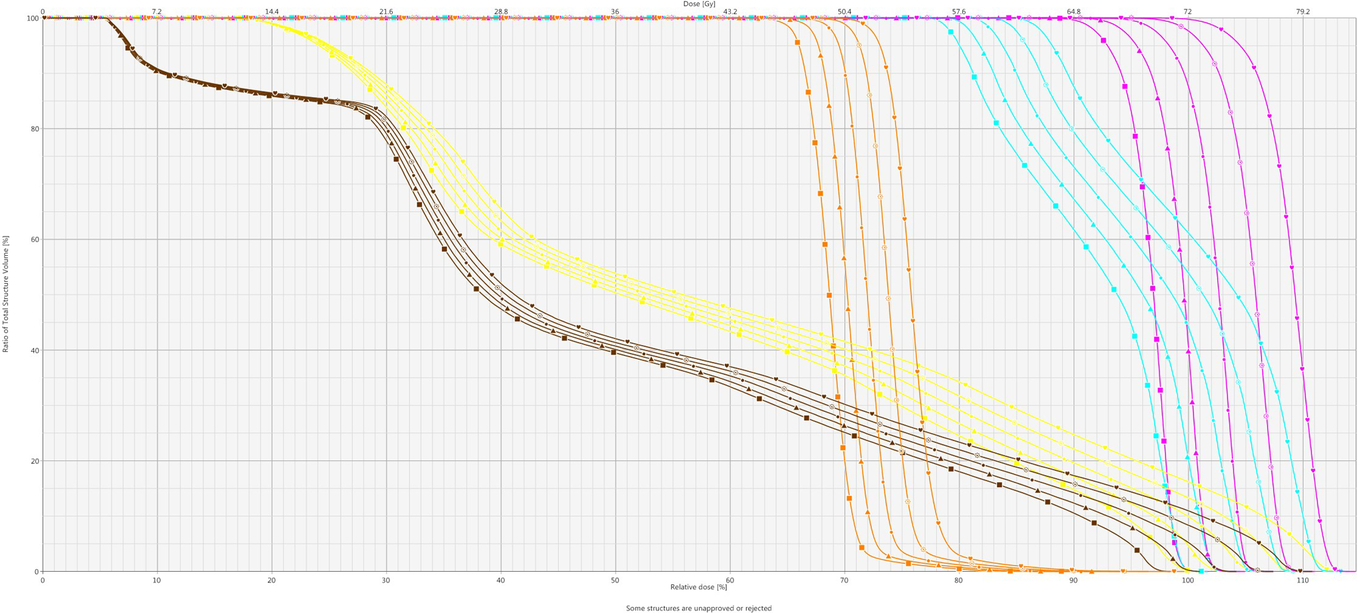
Table 1 shows volumes features of the PTV1, PV2, PTV3, rectum, bladder, and left and right femoral heads for 10 patients of the study. Weight changes resulted in considerable dose modifications to the target and critical structures. Plans with simulated weight gain had significantly reduced doses. Figure 2 is an example of dose-volume histogram (DVH) plots for the patient with a prostate volume of 61 cm3 and a PTV1 volume of 141 cm3, which is close to the median volume value of PTV1 in our patient group. For PTVs, rectum and bladder (femoral heads have been omitted for the sake of simplicity) DVH curves vary with the patient’s fat layer thickness from −2 to +2 cm with a 1 cm step. This pattern is maintained for all patients analyzed.
Volumes features of the PTV1, PV2, PTV3, rectum, bladder, and left and right femoral heads for 10 patients

Comparison of the initial VMAT plan (square) with the final plans after mimicking weight gain or loss. Triangle (−2 cm), solid dot (−1 cm), not solid dot (+1 cm), heart (+2 cm) were DVH for the recalculated plans.

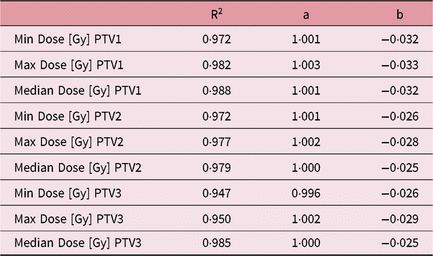
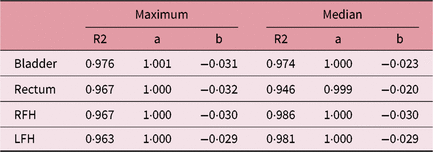
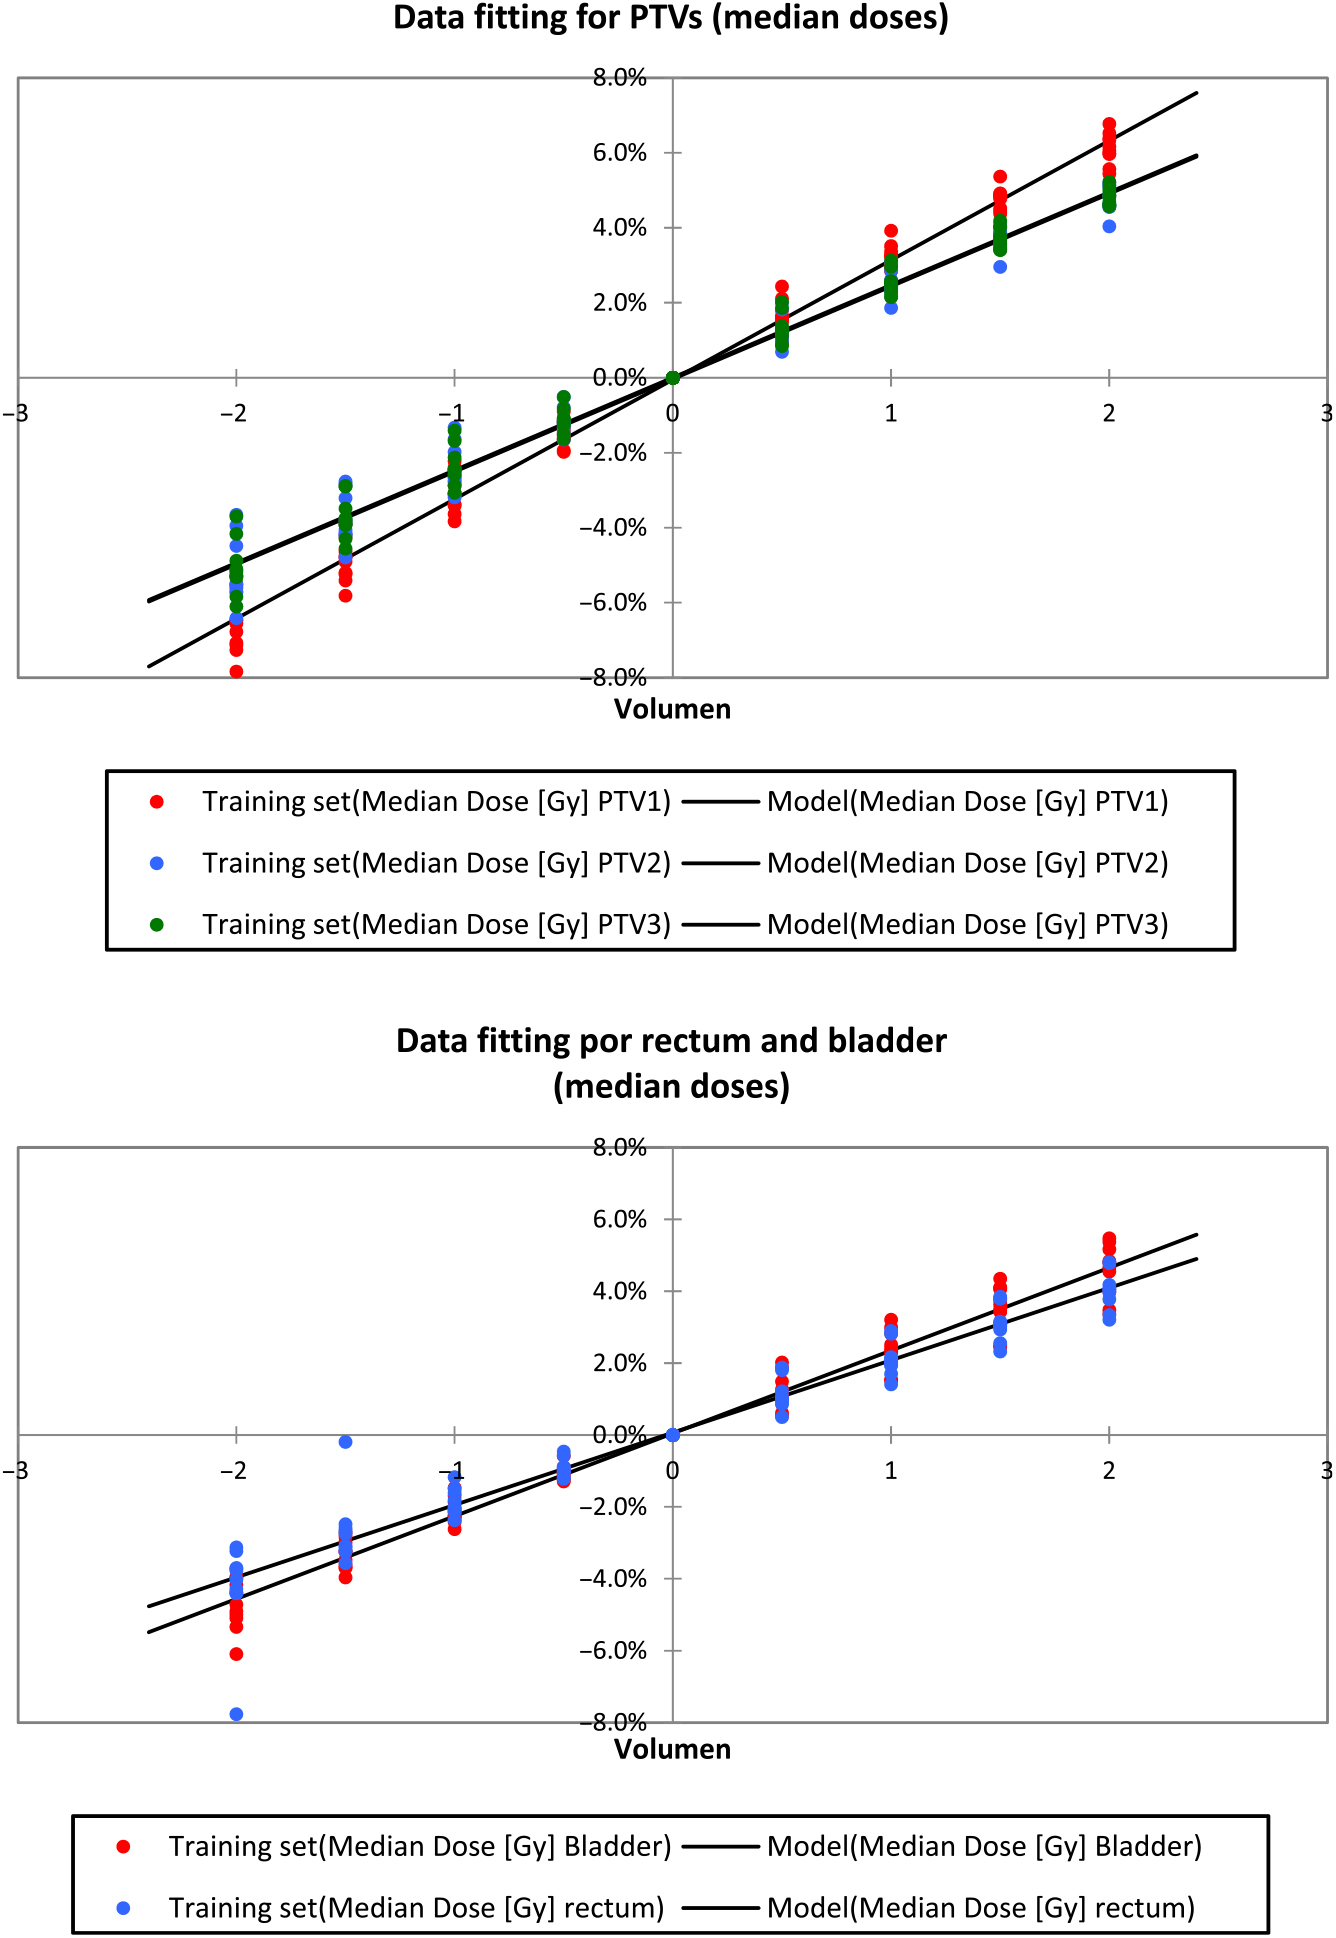
The data fitting of the points of interest from DVH curves can be found in Tables 2 and 3 and Figure 3. Slopes of curves are found to be varied with 2·9% ± 0·3% per cm with a correlation index close to one. Therefore, doses variations were linear to the changes of depth.
Minimum, maximum and median doses for PTV1, PTV2, PTV3. Data fitting y = a + bx and correlation index R2

Data fitting for maximum and median doses for OARs for 10 patients. Y = a + bx

Data fitting for PTVs, rectum and bladder (median doses).

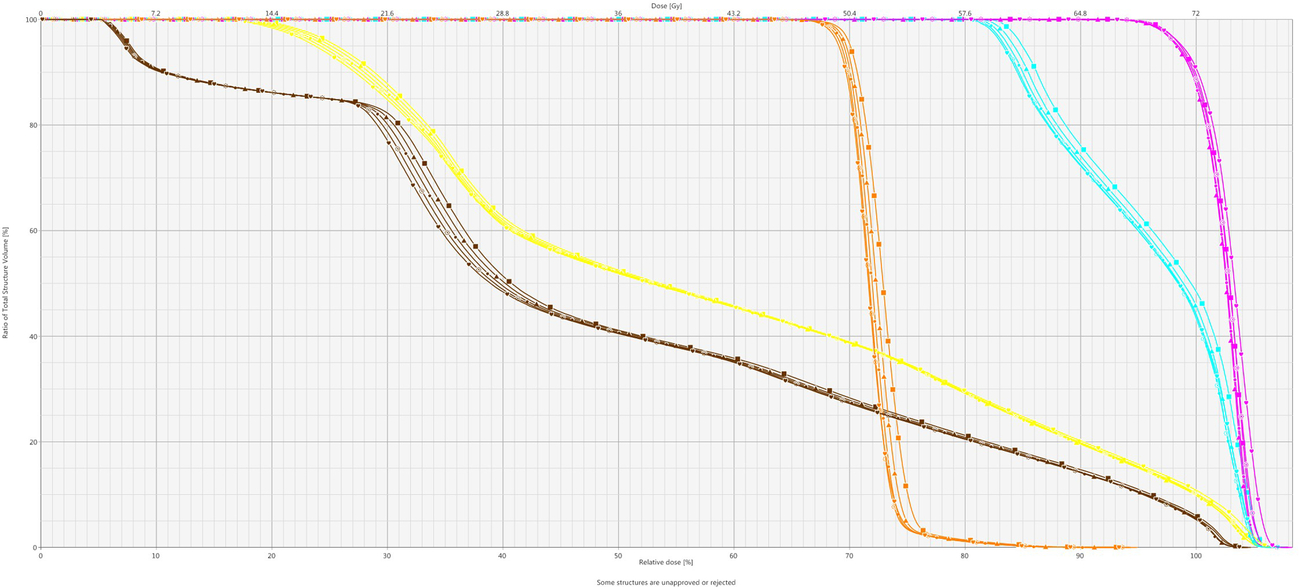
To evaluate the effect of application of normalization for VMAT planning, the normalization value was applied to treatment plans. The DVH curves of the patient after normalization are shown in Figure 4.
DVHs of the PTV1, PTV2, PTV3, rectum and bladder for a patient varying with reduced depths of −2 cm to +2 cm after normalization a value of 2·9% per centimeter.

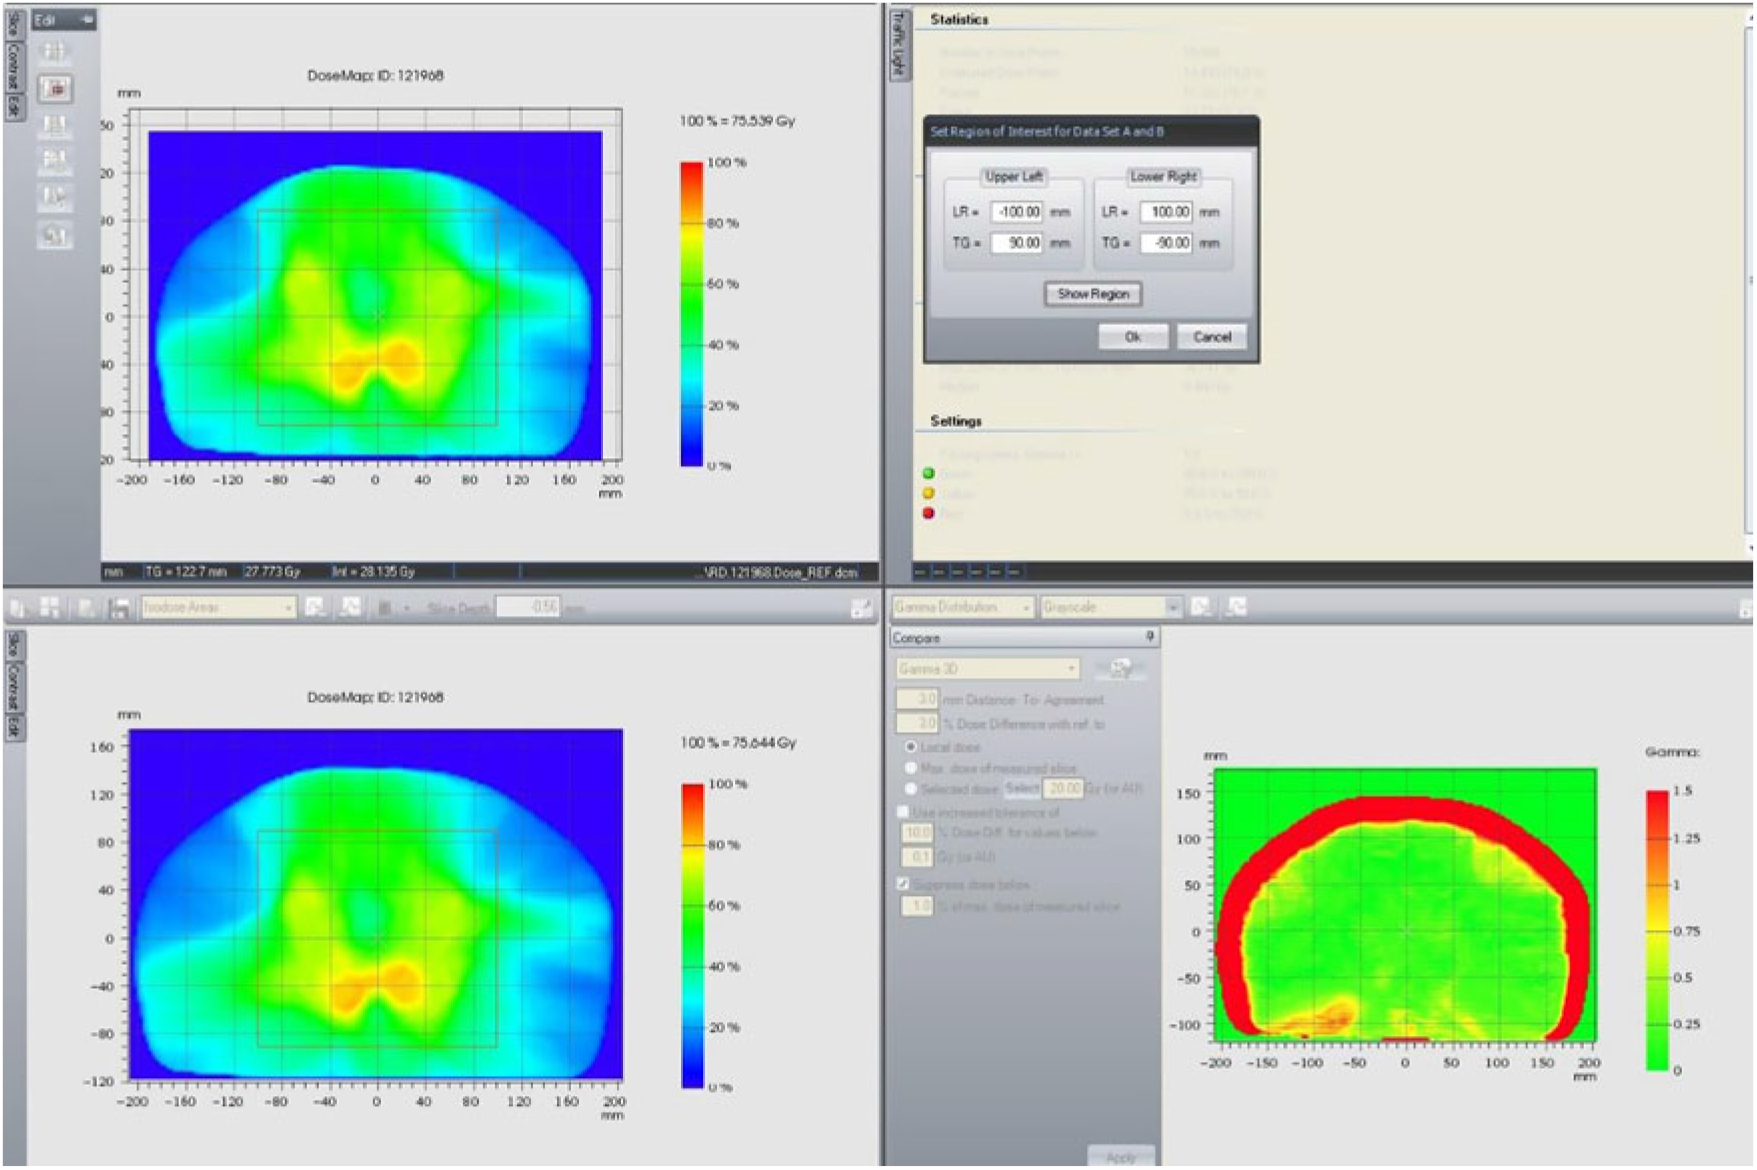
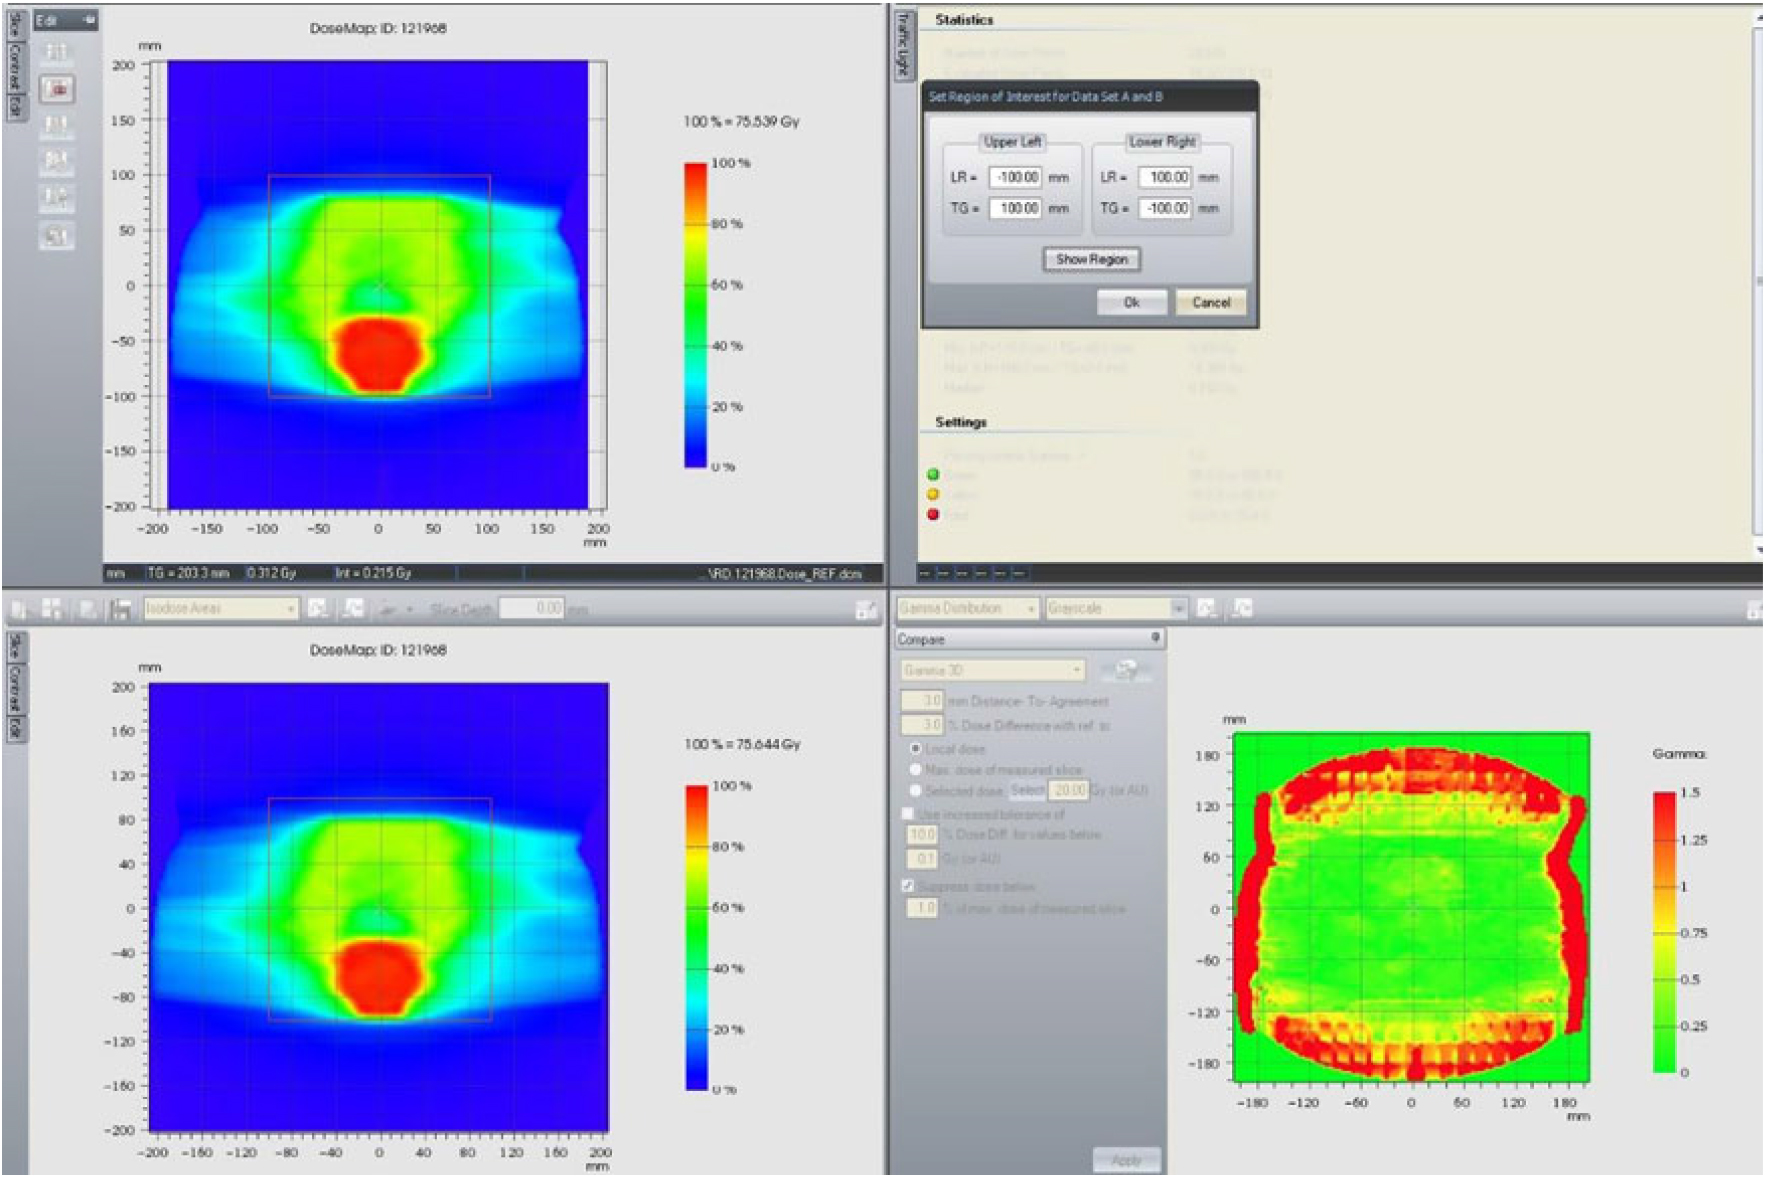
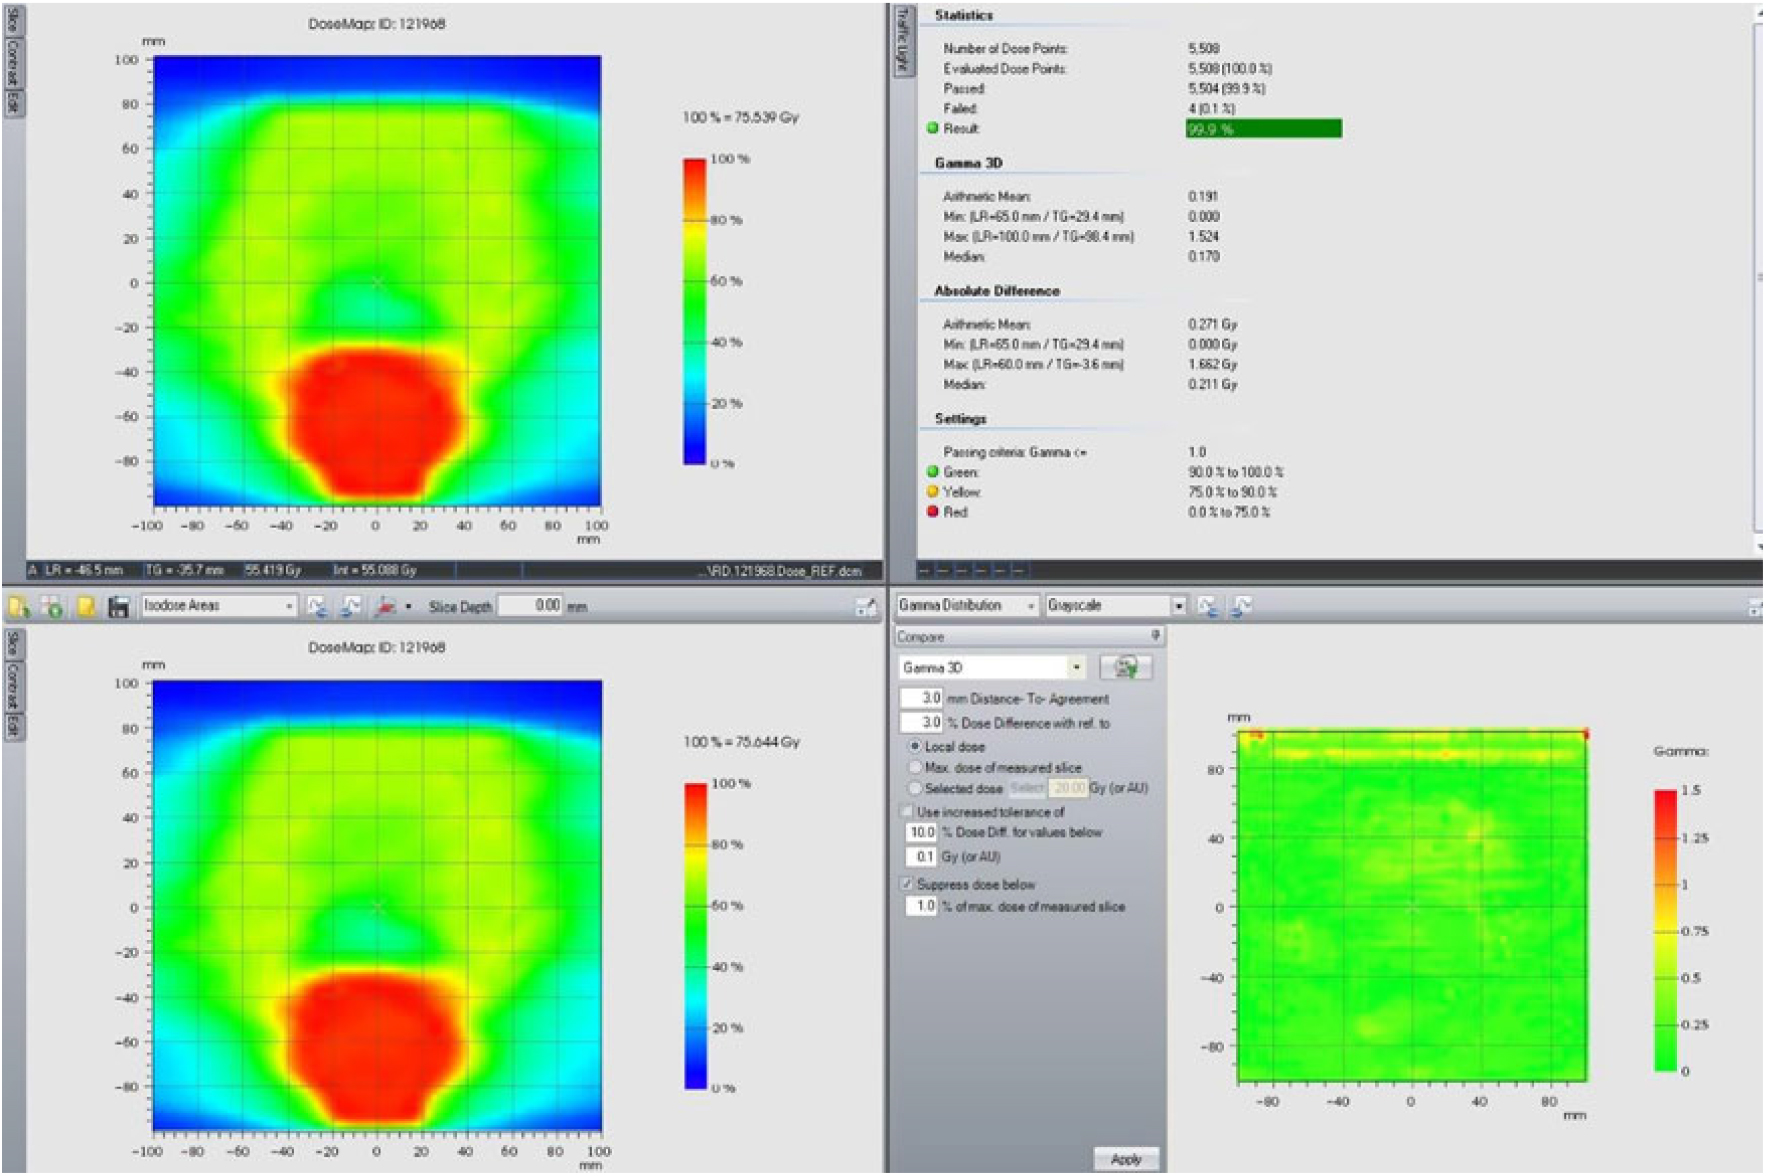
Figures 5–7 show the evaluation of gamma index for 10 patient plans. All of them passed criteria of 3%/3 mm in at least 98.2% of points. Eight of them passed criteria in 99% points. Gamma index 4%/4 mm passed 100% points in all patients for the chosen region of interest.
Region of interest in transversal plan to perform the 3D-gamma index evaluation.

Region of interest in sagital plan to perform the 3D-gamma index evaluation.

An example of 3 mm/3% 3D-gamma analysis for a patient of the study.

Discussion
Although this is a relatively small study, the cohort of 10 patients allows the study of individual data, thus enabling recognition of important outcomes. A total of 90 plans have been evaluated. Anatomical changes were associated with significant dosimetric differences.
Anatomical alterations should have a critical impact in VMAT plans due to the sharp dose gradient between the edges of target volumes and critical OARs.Reference Cutright, Gopalakrishnan, Roy, Panchal and Mittal15 These changes could potentially lead to overdosing of normal tissues and under dosing or marginal geographical misses of target volumes during a course of treatment based on a single planning data set.
Evaluation of treatment plans in radiation oncology is heavily dependent on DVHs. However, such evaluations typically are limited to a small set of points from the DVH.Reference Cutright, Gopalakrishnan, Roy, Panchal and Mittal15 In this study, we conclude that it is possible to use the plots to illustrate the trend and agreement of different DVHs against the independent predicted SSD changes.
Normalization for VMAT plans should be used with caution to avoid potential pitfalls that may occur. Normalizations help meet the volume coverage goals may result in avoidable delivery of additional doses to the normal tissues. Although this is a widely utilized technique to aid in achieving volume coverage, recommendations would favor re-optimization over normalization in most planning situations.Reference Williams, Tobler and Leavitt16
Finally, renormalized plans passed gamma index criteria of 3%/3 mm by almost all cases. Furthermore, all plans passed 4%/4 mm criteria. Therefore, there was statistically a good agreement between the predicted gamma between original plans and the renormalized ones. One final important fact, normalization does not allow us to predict the dose close to skin. From our measurements, it is considered to be approximately 20% of prescription dose in the first 1·5 cm (15 Gy) for a 6 MV beam.
Resimulation, replanning and performing quality assurance are usually unnecessary when the SSD changes by a small amount. Replanning is clearly resource and time intensive. When discrepancies between real dose and planned dose were >5%, which is the limit of the treatment delivery tolerance,Reference Kouloulias17 doctors and medical physicists should rescan the patient. Based on the results of our study, 2·9% ± 0·3% per cm, 1·7 cm of difference in external contour in the anterior and both lateral directions of the patient, must be the maximum discrepancy value. For lesser difference, it can be considered normalization in order to preserve planned DVH.
These results match with those of Chow and Jiang.Reference Chow and Jiang11 (only for patient’s weight loss and low-risk prostate cancer), where D99% for the PTV was found to have increased 2·86% ± 0·34% per centimeter of reduced depth. Otherwise, Pair et al.Reference Pair, Du and Rojas9 (for low-risk prostate cancer) found a value of 3·6% ± 0·2% per centimeter. On the other hand, Klein et al.Reference Klein, Drzymala, Purdy and Michalski18 recommend using both optical distance indicator values and vertical couch settings to avoid treatment distance setup errors because dose difference is about 2% change per centimeter.
Therefore, the tendency found by the previous authors is maintained for the case of high-risk prostate cancer patients, such as those analyzed in this study. The values found, not only for the volumes of interest, but for all the points, are corroborated with the gamma index evaluation carried out.
The study presents two main limitations. First, the model used to simulate the fattening or thinning of patients is an approximation, changes in volume may be slightly different from those assumed here. Second, to carry out the treatment plans by means of inverse calculation, no irradiation angle has been restricted; it is probable that plans with prohibited sectors of irradiation will produce different results.
Conclusions
Patient setup should be verified using SSD measurements before and during the radiotherapy course to ensure that patient dimensions remain stable because it should have an important dosimetry impact.
The dosimetry estimation presented in this study shows important data for the radiation oncology staff to justify whether a CT rescan is necessary or not when a patient experiences weight changes during treatment.
Author ORCiD
David Miguel 0000-0001-7573-2642
Acknowledgment
The authors would like to thank the referees for the valuable comments on our manuscript.
Conflict of interest
The authors declare that they have no conflict of interest.