1. INTRODUCTION
Magnetic fields play an important role in astrophysics (Gregori et al., Reference Gregori, Ravasio, Murphy, Schaar, Baird, Bell, Benuzzi-Mounaix, Bingham, Constantin, Drake, Edwards, Everson, Gregory, Kuramitsu, Lau, Mithen, Niemann, Park, Remington, Reville, Robinson, Ryutov, Sakawa, Yang, Woolsey, Koenig and Miniati2012; Marocchino et al., Reference Marocchino, Atzeni and Schiavi2015) and may affect the transport properties of high-energy-density plasmas in laboratory conditions (Clark et al., Reference Clark, Krushelnick, Davies, Zepf, Tatarakis, Beg, Machacek, Norreys, Santala, Watts and Dangor2000; Stamper et al., Reference Stamper, Papadopoulos, Sudan, Dean, McLean and Dawson1971).
In laser-produced plasmas, magnetic fields can be self-generated (Kingham & Bell, Reference Kingham and Bell2002) or externally imposed (Froula et al., Reference Froula, Ross, Pollock, Davis, James, Divol, Edwards, Offenberger, Price and Town2007). In the inertial confinement fusion context, external magnetic fields may limit energy losses from the central hot spot or guide the energy flux to the central part of the target (Cuneo et al., Reference Cuneo, Herrmann, Sinars, Slutz, Stygar, Vesey, Sefkow, Rochau, Chandler, Bailey, Porter, McBride, Rovang, Mazarakis, Yu, Lamppa, Peterson, Nakhleh, Hansen, Lopez, Savage, Jennings, Martin, Lemke, Atherton, Smith, Rambo, Jones, Lopez, Christenson, Sweeney, Jones, McPherson, Harding, Gomez, Knapp, Awe, Leeper, Ruiz, Cooper, Hahn, McKenney, Owen, McKee, Leifeste, Ampleford, Waisman, Harvey-Thompson, Kaye, Hess, Rosenthal and Matzen2012; Strozzi et al., Reference Strozzi, Tabak, Larson, Divol, Kemp, Bellei, Marinak and Key2012). External fields could also modify the target symmetry during implosion, as well as the energy transfer through heat conduction zone. The electron conduction model implemented in the majority of radiation hydrodynamic codes is based on the assumption of a small deviation from the local thermodynamic equilibrium (Spitzer & Härm, Reference Spitzer and Härm1953; Braginskii, Reference Braginskii1965). But, if the electron mean free path (MFP) exceeds a fraction of the temperature gradient length, this assumption is no more valid and a nonlocal theory is required (Malone et al., Reference Malone, McCrory and Morse1975). This is a common case in the inertial confinement fusion context.
Kinetic codes (Bell et al., Reference Bell, Robinson, Sherlock, Kingham and Rozmus2006; Tzoufras et al., Reference Tzoufras, Bell, Norreys and Tsung2011) are able to describe nonlocal transport, even in magnetized plasmas. However, they are too computationally expensive to provide results in the time scale of interest for hydrodynamics, either by a direct computation or by coupling them with hydrodynamic codes. For this reason, simplified descriptions, which capture the main features of nonlocal transport, have been derived (Bell, Reference Bell1985; Manheimer et al., Reference Manheimer, Colombant and Goncharov2008). We refer to them as nonlocal models.
The description of magnetic field effects on the electron heat transport is complicated (Braginskii, Reference Braginskii1965; Epperlein & Haines, Reference Epperlein and Haines1986). It involves tensor transport coefficients, which account for flux limitation effects and flux rotation. One of the most frequently used nonlocal electron transport model (Meezan et al., Reference Meezan, Divol, Marinak, Kerbel, Suter, Stevenson, Slark and Oades2004; Hu et al., Reference Hu, Smalyuk, Goncharov, Skupsky, Sangster, Meyerhofer and Shvarts2008; Marocchino et al., Reference Marocchino, Tzoufras, Atzeni, Schiavi, Mallet, Tikhonchuk and Feugeas2013; Craxton et al., Reference Craxton, Anderson, Boehly, Goncharov, Harding, Knauer, McCrory, McKenty, Meyerhofer, Myatt, Schmitt, Sethian, Short, Skupsky, Theobald, Kruer, Tanaka, Betti, Collins, Delettre, Hu, Marozas, Maximov, Michel, Radha, Regan, Sangster, Seka, Solodov, Soures, Stoeckl and Zuegel2015), proposed by Schurtz, Nicolaï and Busquet (SNB) (Schurtz et al., Reference Schurtz, Nicoaï and Busquet2000), is based on a simplified kinetic approach: the nonlocal electron contribution is computed using a diffusion equation, resolved with a multigroup scheme on energy. It has been generalized to the magnetized nonlocal regime, thanks to a phenomenological modeling of the induced electric field (Nicolaï et al., Reference Nicolaï, Feugeas and Schurtz2006). Nevertheless, despite this simplification, the model remains too complex and not reliable to be used in practice.
In this paper, we propose to approach the problem in a different way, by using a first-principles model, already tested in the nonlocal regime (Del Sorbo et al., Reference Del Sorbo, Feugeas, Nicolaï, Olazabal-Loumé, Dubroca, Guisset, Touati and Tikhonchuk2015b ), without magnetic fields. This model, the so-called M1, is based on a simplified Fokker–Planck (FP) equation, developed on angular moments and closed with the local angular entropy maximization principle, which is different from the standard spherical harmonic development. Such a closure has already been tested for strongly anisotropic beams of particles (Touati et al., Reference Touati, Feugeas, Nicolaï, Santos, Gremillet and Tikhonchuk2014) in domains of fast ignition (Del Sorbo et al., Reference Del Sorbo, Arikawa, Batani, Beg, Breil, Chen, Feugeas, Fujioka, Hulin, Koga, MacLean, Morace, Namimoto, Nazarov, Nicolai, Nishimura, Ozaki, Sakaki, Santos, Spindloe, Tanaka, Vaisseau, Veltcheva, Yabuchi and Zhang2015a ) and radiotherapy (Caron et al., Reference Caron, Feugeas, Dubroca, Kantor, Dejean, Birindelli, Pichard, Nicolaï, d'Humières, Frank and Tikhonchuk2015). The M1 model presents the best properties to be generalized for the study of the magnetized nonlocal transport due to its simple and numerically stable mathematical structure.
The M1 predictions for a magnetized electron energy transport are studied in a broad range of parameters covering the local as well as nonlocal regime. It is shown that the model results agree with known asymptotic expressions. The model is applied to studying the evolution of a thermal wave in the magnetized nonlocal regime.
The paper is organized as follows. In Section 2, an overview of unmagnetized and magnetized local transport models is presented. In Section 3, we derive the entropic model using the induced electric field response developed in Section 4. The model is applied in Section 5, to recover the local limit and compare it with known theoretical results. The nonlocal limit is presented in Section 6. In Section 7, the model is applied for studying of evolution of magnetized thermal waves. The conclusions are presented in Section 8.
2. LOCAL ELECTRON TRANSPORT THEORIES
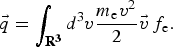
The electron heat flux can be calculated knowing the electron distribution function (EDF):
 $$\vec q = \int_{{{\bf R}^{\bf 3}}} {d^3}v\displaystyle{{{m_{\rm e}}{v^2}} \over 2}\vec v{\,f_{\rm e}}.$$
The EDF temporal evolution is given by the Landau–FP equation (Landau & Lifshitz, Reference Landau and Lifshitz1981)
 $$\left( {\displaystyle{\partial \over {\partial t}} + \vec v \cdot \vec \nabla + \vec a \cdot {{\vec \nabla} _v}} \right){\,f_{\rm e}} = {\left( {\displaystyle{{\partial {\,f_{\rm e}}} \over {\partial t}}} \right)_{{\rm coll}}}, $$
where t is the time,
 $\vec v$
is the velocity,
 $\vec a = e/{m_{\rm e}}(\vec E + \vec v/c \times \vec B)$
is the Lorentz acceleration, function of the electric
 $\vec E$
, and magnetic
 $\vec B$
fields. The elementary charge is e, the electron mass is m
e, the light speed is c, and
 ${(\partial {\,f_{\rm e}}/\partial t)_{{\rm coll}}} $
is a term accounting for collision modeling.
The classical theory of electron transport is based on the assumption of a small deviation from the local thermodynamic equilibrium, that is, the EDF is composed of the Maxwellian distribution
 $f_{\rm e}^{\rm m} = {n_{\rm e}}/(2{\rm \pi} v_{{\rm th}}^2 {)^{3/2}}\,{e^{ - {v^2}/(2v_{{\rm th}}^2 )}}$
and a linear anisotropic perturbation, in the velocity direction
 $\vec {\rm \Omega} = \vec v/v$
. Here, n
e is the electron density, T
e is the electron temperature, and
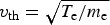 ${v_{{\rm th}}} = \sqrt {{T_{\rm e}}/{m_{\rm e}}} $
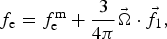
is the thermal velocity. In this approximation, the EDF reads
 $${\,f_{\rm e}} = f_{\rm e}^{\rm m} + \displaystyle{3 \over {4{\rm \pi}}} \vec {\rm \Omega} \cdot {\vec f_1},$$
where
 ${\vec f_1}$
is the first angular moment of the EDF, such that
 $\Vert {\vec f_1}\Vert {\rm \ll} \,f_{\rm e}^{\rm m} $
.
The Maxwellian hypothesis for main part of EDF, yields to the so-called local transport theory.
A local theory of the magnetized electron transport has been derived by Braginskii (Reference Braginskii1965) and further corrected by Epperlein and Haines (Reference Epperlein and Haines1986). Approximate solutions of the local FP equation allowed us to calculate thermoelectric coefficients for all magnetohydrodynamic processes. These coefficients provide a relation between the electric field, the temperature gradient, the current, and the electron heat flux. They read respectively (Braginskii, Reference Braginskii1965; Epperlein & Haines, Reference Epperlein and Haines1986; Nicolaï et al., Reference Nicolaï, Feugeas and Schurtz2006):
 $${\vec E} = - \displaystyle{{{\vec \nabla} {p_{\rm e}}} \over {e{n_{\rm e}}}} + \displaystyle{{{{\vec j}_{\rm e}} \times \vec B} \over {ce{n_{\rm e}}}} + {\bar {\bar {\rm \alpha}}} \cdot \displaystyle{{{{\vec j}_{\rm e}}} \over {{e^2}n_{\rm e}^2 }} - {\bar {\bar {\rm \beta}}} \cdot \displaystyle{{{\vec \nabla} {T_{\rm e}}} \over e}$$
and
 $${{\vec q}_{\rm B}} = - {\bar {\bar k}} \cdot {\vec \nabla} {T_{\rm e}} - {\bar {\bar {\rm \beta}}} \cdot {{\vec j}_{\rm e}}\displaystyle{{{T_{\rm e}}} \over e},$$
where the current is provided by the stationary Ampere's law
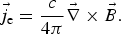 $${{\vec j}_{\rm e}} = \displaystyle{c \over {4{\rm \pi}}} {\vec \nabla} \times {\vec B}.$$
In Eqs (4) and (5),
 ${\bar {\bar {\rm \alpha}}} $
,
 ${\bar {\bar {\rm \beta}}} $
, and
 ${\bar {\bar k}}$
are second-order tensors, which respectively account for the electrical resistivity, thermoelectric, and thermal conductivity. Applied to a generic vector
 $\vec V$
, this tensor quantities (generically denoted by
 ${\bar {\bar {\rm \Psi}}} $
) can be expressed in terms of components relative to the magnetic field unitary vector
 $\hat b = \vec B/B$
, as
 $${\bar {\bar {\rm \Psi}}} \cdot {\vec V} = {{\rm \Psi} _{\rm \parallel}} {\hat b} \cdot ({\hat b} \cdot {\vec V}) - {{\rm \Psi} _ \bot} {\hat b} \times ({\hat b} \times {\vec V}) \pm {{\rm \Psi} _ \wedge} {\hat b} \times {\vec V},$$
where the negative sign applies only to the case
 ${\bar {\bar {\rm \Psi}}} = {\bar {\bar {\rm \alpha}}} $
. The symbols
 ${\rm \parallel} $
, ⊥ mean parallel and perpendicular to the magnetic field, while
 $ \wedge $
means the direction perpendicular to the magnetic field and the generic vector.
The Braginskii's transport theory is a practical way to account for magnetic effects in hydrodynamic codes. The numerical value for the transport coefficients has been later improved by Epperlein & Haines (Reference Epperlein and Haines1986). They have reduced the error on Braginskii's coefficients up to 15%, deducing them numerically.
The role of magnetic fields in electron transport is characterized by a magnetization parameter (the Hall parameter), which is a product of the electron collision time
 ${{\rm \tau} _{\rm e}} = {\rm \nu} _{\rm e}^{ - 1} = 3\sqrt {{m_{\rm e}}T_{\rm e}^3} /(4\sqrt {2{\rm \pi}} {n_{\rm e}}Z{e^4}{\Lambda _{{\rm ei}}})$
, where Λei is the Coulomb logarithm, and the electron gyrofrequency ωB = eB/(m
e
c).
In the limit ωBτe = 0, the Braginskii's theory reduces to the Spitzer and Härm (SH) theory (Spitzer & Härm, Reference Spitzer and Härm1953). The Ampere's law Eq. (6) is replaced by the zero current condition
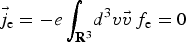 ${\vec j_{\rm e}} = - e\int_{{{\bf R}^3}}\! {d^3}v\vec v{\,f_{\rm e}} = 0$
, so the electric field Eq. (4) becomes
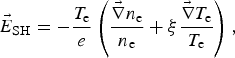 $${{\vec E}_{{\rm SH}}} = - \displaystyle{{{T_{\rm e}}} \over e}\left( {\displaystyle{{{\vec \nabla} {n_{\rm e}}} \over {{n_{\rm e}}}} + {\rm \xi} \displaystyle{{{\vec \nabla} {T_{\rm e}}} \over {{T_{\rm e}}}}} \right),$$
with ξ(Z) = 1 + β = 1 + 3/2(Z + 0.477)/(Z + 2.15). For simplicity we consider electrons as a perfect gas with p e = n e T e. Then, the electron heat flux (5) contains only one term, with the thermal conductivity.
3. REDUCED ENTROPIC MODEL
The purpose of this paper is to describe the combined effect of nonlocal transport and of magnetic fields on the heat flux.
The SH theory predicts that the heat is transported by suprathermal electrons having the velocity ~3.7 times higher than the thermal velocity (Schurtz et al., Reference Schurtz, Nicoaï and Busquet2000). Since the MFP varies as ∝ v 4, the heat is transported by electrons having the collision length 187 times larger than the thermal MFP. These electrons can penetrate deeply into the plasma and can deposit their energy far away from where they have been originated. In this case, the local thermodynamic equilibrium cannot be reached. In particular, if the MFP is long compared with the temperature gradient length (λe >2 × 10⁻³ L T), the local theory is no more valid and the heat transport becomes nonlocal, requiring a kinetic treatment (Bell et al., Reference Bell, Robinson, Sherlock, Kingham and Rozmus2006; Tzoufras et al., Reference Tzoufras, Bell, Norreys and Tsung2011).
Using kinetic codes, the complexity of combining nonlocal and magnetic effects mainly limits the analysis to kinetic temporal scales (few tenths of collision times) and to a reduced number of dimensions. The entropic model M1 (Del Sorbo et al., Reference Del Sorbo, Feugeas, Nicolaï, Olazabal-Loumé, Dubroca, Guisset, Touati and Tikhonchuk2015b ), based on a reduced FP equation has been modified in such a way that it can be coupled with magnetohydrodynamic codes, thus extending the analysis to long hydrodynamic times and to multidimensional geometries. In particular, our purpose is to test the validity of this improved version of the entropic model, in the magnetized nonlocal regime.
Since the electrons transporting the heat are suprathermal, following (Albritton et al., Reference Albritton, Williams, Bernstein and Swartz1986; Del Sorbo et al., Reference Del Sorbo, Feugeas, Nicolaï, Olazabal-Loumé, Dubroca, Guisset, Touati and Tikhonchuk2015b ), we limit our analysis to fast electrons colliding with thermal ions and electrons. The collision integral is taken in a simplified form, proposed by Albritton et al. (Albritton, Reference Albritton1983; Albritton et al., Reference Albritton, Williams, Bernstein and Swartz1986) and applied in (Del Sorbo et al., Reference Del Sorbo, Feugeas, Nicolaï, Olazabal-Loumé, Dubroca, Guisset, Touati and Tikhonchuk2015b ) to unmagnetized plasmas. Moreover, following to (Dubroca et al., Reference Dubroca, Feugeas and Frank2010; Touati et al., Reference Touati, Feugeas, Nicolaï, Santos, Gremillet and Tikhonchuk2014), we developed the EDF in angular moments and retain the first two moments in the M1 approximation. As the electron collision time is short compared with the characteristic hydrodynamic time, we solve a stationary kinetic equation at each hydrodynamic time step. Then the system of kinetic equations for two angular moments of the EDF writes:
 $$\left( {\matrix{{v{\vec \nabla} \cdot {{\vec f}_1} - \displaystyle{{e{\vec E}} \over {{m_{\rm e}}{v^2}}} \cdot \displaystyle{\partial \over {\partial v}}\left( {{v^2}{{\vec f}_1}} \right) = {{\rm \nu} _{{\rm ee}}}v\displaystyle{\partial \over {\partial v}}\left( {{\,f_0} - f_0^{\rm m}} \right)} \hfill \cr {v{\vec \nabla} \cdot {{{\bar {\bar f}}}_2} - \displaystyle{e \over {{m_{\rm e}}{v^2}}}\displaystyle{\partial \over {\partial v}}\left( {{v^2}{{{\bar {\bar f}}}_2} \cdot {\vec E}} \right) + \displaystyle{e \over {{m_{\rm e}}v}}\left( {{\,f_0}{\bar {\bar I}} - {{{\bar {\bar f}}}_2}} \right) \cdot {\vec E} + \displaystyle{e \over {{m_{\rm e}}c}}{{\vec f}_1} \times {\vec B} = {{\rm \nu} _{{\rm ee}}}v\displaystyle{\partial \over {\partial v}}{{\vec f}_1} - ({{\rm \nu} _{{\rm ee}}} + {{\rm \nu} _{{\rm ei}}}){{\vec f}_1}} \hfill \cr {{{{\bar {\bar f}}}_2} = \left[ {\displaystyle{1 \over 3}{\bar {\bar I}} + \displaystyle{{{\vec {\rm \Omega}} _v^2} \over 2}\left( {1 + {\vec {\rm \Omega}} _v^2} \right)\left( {\displaystyle{{{{\vec f}_1} \otimes {{\vec f}_1}} \over {{\vec f}_1^{2}}} - \displaystyle{1 \over 3}{\bar {\bar I}}} \right)} \right]{\,f_0}.} \hfill \cr}} \right..$$
Third equation presents a closure relation of the second angular moment. It is derived by maximizing the local angular entropy
 $${H_\Omega} (\vec x,v) = - \int_{{S^2}} \!{d^2}\Omega ({\,f_{\rm e}}\log {\,f_{\rm e}} - {\,f_{\rm e}})\;\forall (\vec x,v),$$
imposing the dependence on the first two moments. Here
 ${\bar {\bar I}}$
is the second-order identity tensor, and
 ${\vec {\rm \Omega} _v} = {\vec f_1}/{\,f_0}$
.
Starting from the kinetic point of view, the hydrodynamics can be constructed from the maximization of the local entropy
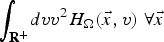 $\int_{{{\bf R}^ +}} \!dv{v^2}{H_\Omega} (\vec x,v)\;\forall \vec x$
. The maximization of the local angular entropy Eq. (10) is less restrictive, it presents a compromise which allows us to account for kinetic effects in a mesoscopic way.
The M1 model can be coupled to a multidimensional magnetohydrodynamic code as follows: at every time step of a magnetohydrodynamic simulation it is initialized by the hydrodynamic parameters (temperature, density, and magnetic field) which are used to compute the EDF. The latter can be easily integrated to obtain the heat flux. We stress that the M1 model does not perform any distinction between local and nonlocal populations, but it computes the EDF of the plasma as a whole with the constraint of the hydrodynamic temperature. For more details, see also Section 4 of (Del Sorbo et al., Reference Dubroca, Feugeas and Frank2015b ).
Only one other attempt to describe the nonlocal magnetized regime on the multidimensional hydrodynamic scale has been published: the generalization of the SNB model to magnetized plasmas (Nicolaï et al., Reference Nicolaï, Feugeas and Schurtz2006). This model, however, presents many limitations. In fact, the SNB model resolves a diffusion equation, which, in the magnetized regime, is complicated due to the spatial anisotropy and the appearance of many new terms. These terms are treated phenomenologically, still remaining very complex: the energy-diffusion matrix for the numerical solution is non-symmetric and so difficult to invert. On the contrary, the M1 model, which is based on a system of convective equations, remains as simple as in the unmagnetized case, described in (Del Sorbo et al., Reference Del Sorbo, Feugeas, Nicolaï, Olazabal-Loumé, Dubroca, Guisset, Touati and Tikhonchuk2015b ), presenting an easier mathematical form, which is numerically solved explicitly on energy.
In addition to the temperature gradient, magnetic fields add a new direction of anisotropy to the thermal transport. Being a first moment model, the M1 model is limited to the description of one direction of anisotropy; hence it is valid if thermoelectric effects are negligible. Fortunately, this occurs frequently in laser–matter interactions.
4. ELECTRIC AND MAGNETIC FIELD CALCULATIONS
The EDF strongly depends on the electric and magnetic fields. The electric field
 $\vec E$
needs to be evaluated self-consistently while solving the kinetic Eq. (9).
The inputs of the M1 model are the hydrodynamic variables. Once they are acquired (from the previous temporal step of a hydrodynamic simulation or externally imposed), the electric field can be computed by iterating the solution of the system (9), starting from the zero or local value. The iteration process can be summarized as follows:
-
•
 $\vec E$
is evaluated from the previous iteration step;
-
• Equation (9) are solved for f 0 and
${\vec f_1}$
by using the evaluated
$\vec E$
field; -
• f 0 and
${\vec f_1}$
are used to calculate macroscopic quantities, such as
$\vec q$
and
${\vec j_{\rm e}}$
, from which we deduce
$\vec E$
.


The process is stopped when the electric field converges.
The reader should be careful to do not confuse the time step of a hydrodynamic simulation from the iteration step in the resolution of system (9). Note also that the latter is formally stationary.
The magnetic field
 $\vec B$
is considered in the system (9) as an external source, which is assumed constant at the kinetic temporal scale (~ τe).
4.1. Unmagnetized Plasmas
In case of unmagnetized plasmas, without external sources, Eq. (6) reduces to
 ${\vec j_{\rm e}} = 0$
. This condition implies that there are two opposite electron fluxes: suprathermal electrons which transport the heat and a slower return current flux. Since the second flux involves lower velocities, it is less susceptible to nonlocal effects (Nicolaï et al., Reference Nicolaï, Feugeas and Schurtz2006). Thus, for weakly nonlocal conditions, the electric fields could be determined from the local Eq. (8).
In the case of strong temperature gradients, the model needs to account for nonlocal corrections to the electric field. Under the assumption of a Lorentz gas and of a weak anisotropy (P1 approximation), the second equation of the system (9) reads
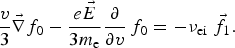 $$\displaystyle{v \over 3}\vec \nabla {f_0} - \displaystyle{{e\vec E} \over {3{m_{\rm e}}}}\displaystyle{\partial \over {\partial v}}{\,f_0} = - {{\rm \nu} _{{\rm ei}}}\;{\vec f_1}.$$
A nonlocal electric field can be derived by applying the zero current condition. It has been extended to low-Z plasmas (Del Sorbo et al., Reference Del Sorbo, Feugeas, Nicolaï, Olazabal-Loumé, Dubroca, Guisset, Touati and Tikhonchuk2015b ):
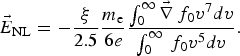 $${\vec E_{{\rm NL}}} = - \displaystyle{{\rm \xi} \over {2.5}}\displaystyle{{{m_{\rm e}}} \over {6e}}\displaystyle{{\int_0^\infty \vec \nabla {\,f_0}{v^7}dv} \over {\int_0^\infty {\,f_0}{v^5}dv}}.$$
As shown in (Del Sorbo et al., Reference Del Sorbo, Feugeas, Nicolaï, Olazabal-Loumé, Dubroca, Guisset, Touati and Tikhonchuk2015b
), for low-Z plasmas, the last expression is valid in the limit
 $\vec \nabla {T_{\rm e}}/{T_{\rm e}}\,{\rm \gg} \vec \nabla {n_{\rm e}}/{n_{\rm e}}$
. This condition is often respected in practice. In the extreme case of Z = 1 and
 $\vec \nabla {T_{\rm e}}/{T_{\rm e}}{\rm \ll} \vec \nabla {n_{\rm e}}/{n_{\rm e}}$
, the error is ~30%, smaller than the one committed by models which assume local electric fields.
4.2. Magnetized Plasmas
In magnetized plasmas, the zero-current condition is replaced by the stationary Ampere's law (6). Unfortunately, it is not anymore possible to find an analytic expression for the electric field from Eqs. (9).
Magnetic fields tend to localize the transport (Brantov et al., Reference Brantov, Yu Bychenkov, Rozmus, Capjack and Sydora2003; Nicolaï et al., Reference Nicolaï, Feugeas and Schurtz2006). Following the example of unmagnetized plasma, one may calculate electric fields in the local approximation, given by Eq. (4). However, it is not sufficient in the nonlocal regime. We improve this relation by using the plasma parameters updated from solution of the kinetic equation: the electron density
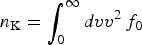 ${n_{\rm K}} = \int_0^\infty dv{v^2}{\,f_0}$
and the electron pressure
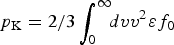 ${\,p_{\rm K}} = 2/3\int_0^\infty \!\!dv{v^2}{\varepsilon} {f_0}$
. These quantities differ from classical hydrodynamic ones because they are computed by averaging the EDF and not by solving the hydrodynamic equations. According to the perfect gas equation of state, the kinetic electron temperature reads T
K = p
K/n
K. Using these definitions in Eq. (4), the expression for the local-kinetic electric field reads
 $${{\vec E}_{{\rm Lk}}} = - \displaystyle{{{\vec \nabla} {p_{\rm K}}} \over {e{n_{\rm K}}}} + \displaystyle{{{{\vec j}_{\rm e}} \times {\vec B}} \over {ce{n_{\rm K}}}} + {{{\bar {\bar {\rm \alpha}}}} _{\rm K}} \cdot \displaystyle{{{{\vec j}_{\rm e}}} \over {{e^2}n_{\rm K}^2}} - {{\bar {\bar {\rm \beta}}} _{\rm K}} \cdot \displaystyle{{{\vec \nabla} {T_{\rm K}}} \over e}.$$
The kinetic electrical resistivity is defined in function of the kinetic–hydrodynamic quantities (Del Sorbo, Reference Del Sorbo2015):
 ${{\bar {\bar {\rm \alpha}}} _{\rm K}} = {\bar {\bar {\rm \alpha}}} ({n_{\rm K}},{T_{\rm K}}) = {m_{\rm e}}{n_{\rm K}}/{{\rm \tau} _{\rm e}}({T_{\rm K}},{n_{\rm K}}){\bar {\bar {\rm \alpha}}} _{\rm K}^c $
, where
 ${\bar {\bar {\rm \alpha}}} _{\rm K}^c $
is the dimensionless electric resistivity (Epperlein & Haines, Reference Epperlein and Haines1986).
While solving the kinetic system (9), the electric field as a function of f
0 and
 ${\vec f_1}$
is computed by iterations, according to Eq. (13), till convergence. Note that this new formulation does not add any degree of complexity with respect to Eq. (12): both are integrals of the EDF and both can be computed by iterating the solution of the system (9) till the field convergence.
The electric field (13) is the one that will be used along the paper.
For the treatment of magnetic fields, we consider two time scales: the hydrodynamic scale, much longer than the kinetic one. At the kinetic scale, magnetic fields are considered constant, while they vary at the hydrodynamic temporal scale according to the magnetohydrodynamic equations. In the M1 model, they can be externally imposed or provided from the magnetohydrodynamic simulation to which it should be coupled. This treatment is the same used in the SNB model (Nicolaï et al., Reference Nicolaï, Feugeas and Schurtz2006) and in the Braginskii's theory (Braginskii, Reference Braginskii1965). Note that the addition of these fields does not require any modification to the numerical structure developed in (Del Sorbo et al., Reference Del Sorbo, Arikawa, Batani, Beg, Breil, Chen, Feugeas, Fujioka, Hulin, Koga, MacLean, Morace, Namimoto, Nazarov, Nicolai, Nishimura, Ozaki, Sakaki, Santos, Spindloe, Tanaka, Vaisseau, Veltcheva, Yabuchi and Zhang2015a ).
5. LOCAL REGIME OF MAGNETIZED PLASMAS
The M1 model, as well as the Braginskii's theory, has been presented in a multidimensional formalism. However, in what follows the analysis will be limited to one and two dimensions because our aim is to couple transport models to the CHIC code (Breil & Maire, Reference Breil and Maire2007), a two-dimensional hydrodynamic code. Nevertheless, no modifications are required in order to generalize the M1 model to three dimensions.
Let us first study the local regime of magnetized plasmas. We consider a fully ionized plasma, with a constant density, characterized by a steep temperature gradient
 $${T_{\rm e}}(x) = \displaystyle{{ \vert {T_0} - {T_1} \vert} \over 2}\left[ {\displaystyle{2 \over {\rm \pi}} \arctan \left( {\displaystyle{x \over {{{\rm \delta} _{{\rm NL}}}}}} \right) + 1} \right] + {T_1},$$
with T 0 = 5 keV, T 1 = 0.5 keV, and δNL = 500 μm. The system is simulated in one dimension (x-direction) with a perpendicular magnetic field (z-direction). For reasons of comparison with theory, we consider the Hall parameter ωBτe constant along the plasma; thus the magnetic field varies along with the electron collision time:
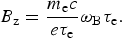 $${B_{\rm z}} = \displaystyle{{{m_{\rm e}}c} \over {e{{\rm \tau} _{\rm e}}}}{{\rm \omega} _{\rm B}}{{\rm \tau} _{\rm e}}.$$
We consider two perfect gas plasmas, one with Z = 1 and n e = 1023 cm−3 and the second with Z ≫ 1 (Z = 79) and n e = 4 × 1022 cm−3.
The thermal conductivities are compared with the theoretical predictions (Braginskii, Reference Braginskii1965; Epperlein & Haines, Reference Epperlein and Haines1986) in the central plasma region. This comparison is performed in the limit of temperature gradient dominance, as it is demonstrated in Appendix A. The heat flux has the following form:
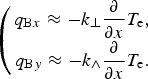 $$\left( {\matrix{{{q_{{\rm B}x}} \approx - {k_ \bot} \displaystyle{\partial \over {\partial x}}{T_{\rm e}},} \cr {{q_{{\rm B}y}} \approx - {k_ \wedge} \displaystyle{\partial \over {\partial x}}{T_{\rm e}}.} \cr}} \right.$$
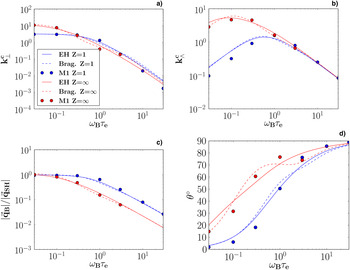
Figure 1a presents a dependence of the normalized thermal conductivity
 $k_ \bot ^c = {k_ \bot} {m_{\rm e}}/{n_{\rm e}}{T_{\rm e}}{{\rm \tau} _{\rm e}}$
versus the Hall parameter, for different values of the ion charge Z. As ωBτe increases,
 $k_ \bot ^c $
decreases. In accordance to Eq. (16), this corresponds to a decrease of the heat flux in the x-direction. In the crossed direction (y-axis), shown in Figure 1b, the flux (as the conductivity) increases with the magnetization, till a maximum at ωBτe ≈ 0.1 − 1 (depending on the ion charge) and decreases for larger values of the Hall parameter.
Dependence of dimensionless local thermal conductivities, on the Hall parameter. The M1 model (points) is compared with the Braginskii's (Braginskii, Reference Braginskii1965) (continuous line) and the EH theory (Epperlein & Haines, Reference Epperlein and Haines1986) (dashed line), for the conductivity in the direction perpendicular to the magnetic field (a), crossed between the temperature gradient and the magnetic field (b), for the flux reduction (c), and for the flux rotation (d). Comparison is presented for Z = 1 (blue) and Z ≫ 1 (red),
 ${{\bar {\bar k}}^c} = {\bar {\bar k}}{m_{\rm e}}/({n_{\rm e}}{T_{\rm e}}{{\rm \tau} _{\rm e}})$
is normalized to local quantities.

A description of the flux rotation and limitation, induced by magnetic fields, can be provided by using a simplified FP model. Using the Krook collision operator (Bhatnagar et al., Reference Bhatnagar, Gross and Krook1954), under the assumption of a Lorentz gas and a P1 approximation, the first two angular moments in the system (9) read
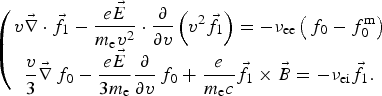 $$\left( {\matrix{{v\vec \nabla \cdot {{\vec f}_1} - \displaystyle{{e\vec E} \over {{m_{\rm e}}{v^2}}} \cdot \displaystyle{\partial \over {\partial v}}\left( {{v^2}{{\vec f}_1}} \right) = - {{\rm \nu} _{{\rm ee}}}\left( {{\,f_0} - f_0^{\rm m}} \right)} \cr {\displaystyle{v \over 3}\vec \nabla {\,f_0} - \displaystyle{{e\vec E} \over {3{m_{\rm e}}}}\displaystyle{\partial \over {\partial v}}{\,f_0} + \displaystyle{e \over {{m_{\rm e}}c}}{{\vec f}_1} \times \vec B = - {{\rm \nu} _{{\rm ei}}}{{\vec f}_1}.} \cr}} \right.$$
Inverting the system we recover the first moment (Nicolaï et al., Reference Nicolaï, Feugeas and Schurtz2006):
 $${\vec f_1} = \displaystyle{{ - {\rm \lambda} _{{\rm ei}}^*} \over {1 + {{\left( {\displaystyle{{{{\rm \omega} _{\rm B}}{\rm \lambda} _{{\rm ei}}^*} \over v}} \right)}^2}}}\left( {1 + \displaystyle{{{{\rm \omega} _{\rm B}}{\rm \lambda} _{{\rm ei}}^*} \over v}\hat b \times} \right)\left( {\vec \nabla - \displaystyle{{e\vec E} \over {{m_{\rm e}}v}}\displaystyle{\partial \over {\partial v}}} \right){\,f_0}.$$
In the latter equation, the electron–ion MFP λei = v th/νei has been replaced with the interpolation (Nicolaï et al., Reference Nicolaï, Feugeas and Schurtz2006; Del Sorbo et al., Reference Del Sorbo, Feugeas, Nicolaï, Olazabal-Loumé, Dubroca, Guisset, Touati and Tikhonchuk2015b )
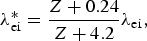 $${\rm \lambda} _{{\rm ei}}^* = \displaystyle{{Z + 0.24} \over {Z + 4.2}}{{\rm \lambda} _{{\rm ei}}},$$
in order to account for low ionization number plasmas. We interpret
 ${{\rm \omega} _{\rm B}}{\rm \lambda} _{{\rm ei}}^* /v$
as a kinetic version of the Hall parameter and assume
 ${{\rm \omega} _{\rm B}}{\rm \lambda} _{{\rm ei}}^* /v\,{\rm \sim}\, {{\rm \omega} _{\rm B}}{{\rm \tau} _{\rm e}}$
, as a leading term in the local limit. According to Eq. (1), Eq. (18) asserts that the heat flux is reduced by a factor 1 + (ωBτe)2, in the direction of the temperature gradient, while, by a factor ωBτe/[1 + (ωBτe)2], in the crossed direction, between the temperature gradient and the magnetic field. Thus, the flux is always reduced by the magnetization, in the direction of the temperature gradient, and it is increased for ωBτe ≤ 1 and reduced for ωBτe ≥ 1, in the crossed direction.
Figure 1a shows that the model M1 agrees with the theory (Epperlein & Haines, Reference Epperlein and Haines1986), in the prediction of a flux limitation along the x-direction, due to a magnetic field. In the high-Z limit, the electron–electron collisions become negligible and the M1 model agrees with the Braginskii's and EH theory.
In the low-Z limit, the M1 model weakly departs from the Braginskii's theory for
 ${{\rm \omega} _{\rm B}}{{\rm \tau} _{\rm e}}{\rm \mathbin{\lower.3ex\hbox{$\buildrel\gt\over {\smash{\scriptstyle\sim}\vphantom{_x}}$}}} 10$
. However, for such a strong Hall parameter, the magnetic field already strongly reduces the heat flux and this difference is not too important.
Also in the y-direction, shown in Figure 1b, the M1 model agrees with the Braginskii's theory in the high-Z limit. In the low-Z limit, it presents some differences when the effect of magnetic fields is weak. They are due to the inaccuracies of our collision operator, which are more visible for low-Z values. However, in this limit, the effect of the crossed heat transport is small.
Figures 1 demonstrate that magnetic fields are responsible for two effects: flux limitation and flux rotation. By presenting the heat flux in the form of Eq. (16), we define the heat flux limitation due to magnetic fields as
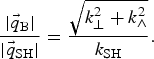 $$\displaystyle{{ \vert {{\vec q}_{\rm B}} \vert} \over { \vert {{\vec q}_{{\rm SH}}} \vert}} = \displaystyle{{\sqrt {k_ \bot ^2 + k_ \wedge ^2}} \over {{k_{{\rm SH}}}}}.$$
The rotation angle is defined as
 ${\rm \theta} = \arctan \left( {{q_{{\rm B}y}}/{q_{{\rm B}x}}} \right) =\arctan $
 $\left( {k_ \wedge ^c /k_ \bot ^c} \right)$
.
The magnetic field reduces the absolute value of the heat flux, as it is shown in Figure 1c. Our model agrees in the description of the flux limitation, also in the low-Z limit. The main differences between the model and the theory (Epperlein & Haines, Reference Epperlein and Haines1986) are in the flux rotation angle, shown in Figure 1d. The figure shows that despite of some differences, the M1 model agrees with the theoretical predictions: the magnetic field tends to rotate the flux and the rotation angle increases with the Hall parameter. For Hall parameters higher than 1, the rotation angle approaches 90°.
6. MAGNETIZED NONLOCAL HEAT TRANSPORT
The magnetized transport is studied in the nonlocal regime, for plasmas characterized by one temperature gradient and periodically modulated temperatures.
6.1. Magnetized Transport Along and Across the Temperature Gradient
In this section, we analyze a particular case, in which both magnetization and nonlocal effects influence the heat flux. We assume a magnetic field, in the z-direction, given by Eq. (15), with a constant Hall parameter ωBτe = 0.5. Periodic boundary conditions are assumed in the y-direction.
We consider a fully ionized hydrogen plasma of a constant density
 ${n_{\rm e}}= { 10^{23}} {\rm c}{{\rm m}^{ - 3}}$
. The temperature profile is given by Eq. (14) where T
0 = 5 keV, T
1 = 0.5 keV, and δNL = 5 μm. The fluxes are normalized to the modulus of the maximum SH flux q
0 = 86 PW/cm2 and the length to the maximum MFP
 ${{\rm \lambda} _0} = 3(\sqrt {{\rm \pi} /2} )(T_0^2 /4{\rm \pi} {n_{\rm e}}Z{e^4}{\Lambda _{{\rm ei}}}) \approx 5.98 \,{\rm \mu} {\rm m}$
. The degree of non-locality of the system is λ0/L
T = 0.67 and the thermoelectric conduction is negligible.
In order to demonstrate the magnetic field effect on the nonlocal transport, we compare the local and nonlocal models with several magnetization parameters.
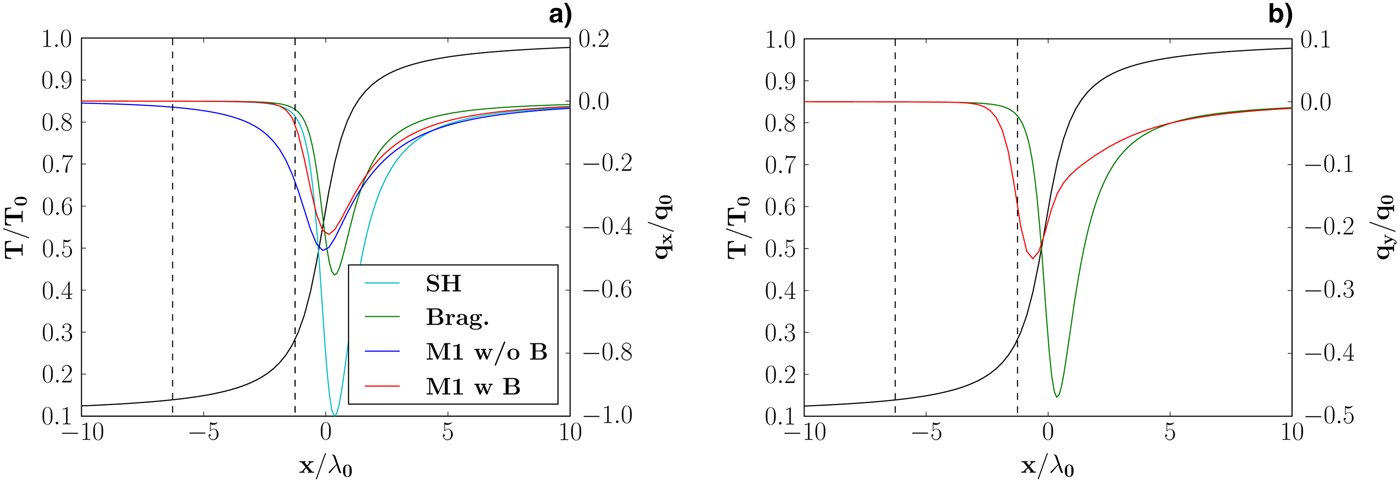
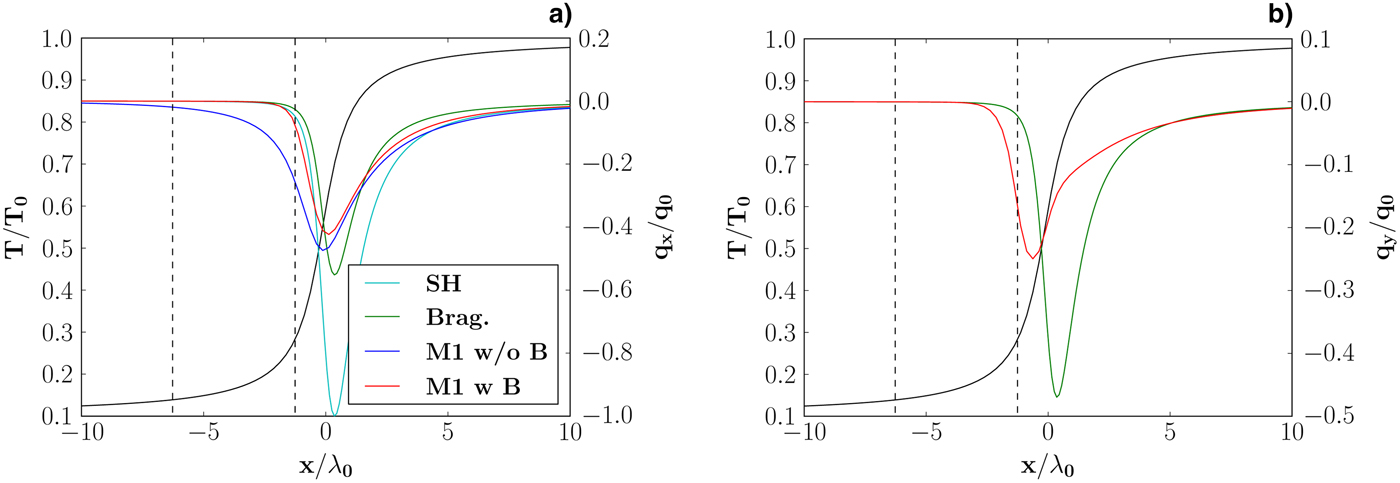
Figure 2a shows the heat flux along the temperature gradient. The difference between the local and nonlocal models is larger for small ωBτe: the SH result is farther from the unmagnetized M1 result than the Braginskii's flux from the magnetized M1, which almost coincide. The magnetic fields in the direction of temperature gradient reduce the nonlocal effect. On the contrary, the nonlocal effects are stronger in the perpendicular direction, as shown in Figure 2b. In this case, they limit the heat flux and displace it toward the colder region. So, the nonlocal transport reduces the flux rotation due to the magnetic field.
Nonlocal heat fluxes, versus the x-coordinate, for a plasma with a temperature gradient in the x-direction, magnetic fields in the z-direction, and periodic boundary conditions in the y-direction. The flux x-component is plotted in (a) and the y-component in (b). In black is shown the temperature profile, in cyan the local unmagnetized theory (ωBτe = 0), in green the local magnetized one (ωBτe = 0.5), in blue the nonlocal M1 model for ωBτe = 0, and in red the nonlocal M1 model for ωBτe = 0.5. Vertical lines denote regions where the kinetic analysis is performed.
We have seen that the effect of the magnetized nonlocal heat transport is to reduce both nonlocal and magnetic effects. This can be explained by considering the magnetization effectively experienced by an electron with a velocity v:
 $$\displaystyle{{{{\rm \omega} _{\rm B}}{\rm \lambda} _{{\rm ei}}^*} \over v} = \sqrt {\displaystyle{2 \over {9{\rm \pi}}}} {{\rm \omega} _{\rm B}}{{\rm \tau} _{\rm e}}{\left( {\displaystyle{v \over {{v_{{\rm th}}}}}} \right)^{\!\!3}}\displaystyle{{Z + 0.24} \over {Z + 4.2}},$$
while its effective MFP is
 ${\rm \lambda} _{{\rm ei}}^* /[1 + {({{\rm \omega} _{\rm B}}{\rm \lambda} _{{\rm ei}}^* /v)^2}]$
. The latter is reduced by magnetic fields for all velocities. A reduction of MFP implies a reduction of the nonlocal parameter λe/L
T to ~ λe/{L
T[1 + (ωBτe)2]}, which necessarily leads to the reduction of nonlocal effects.
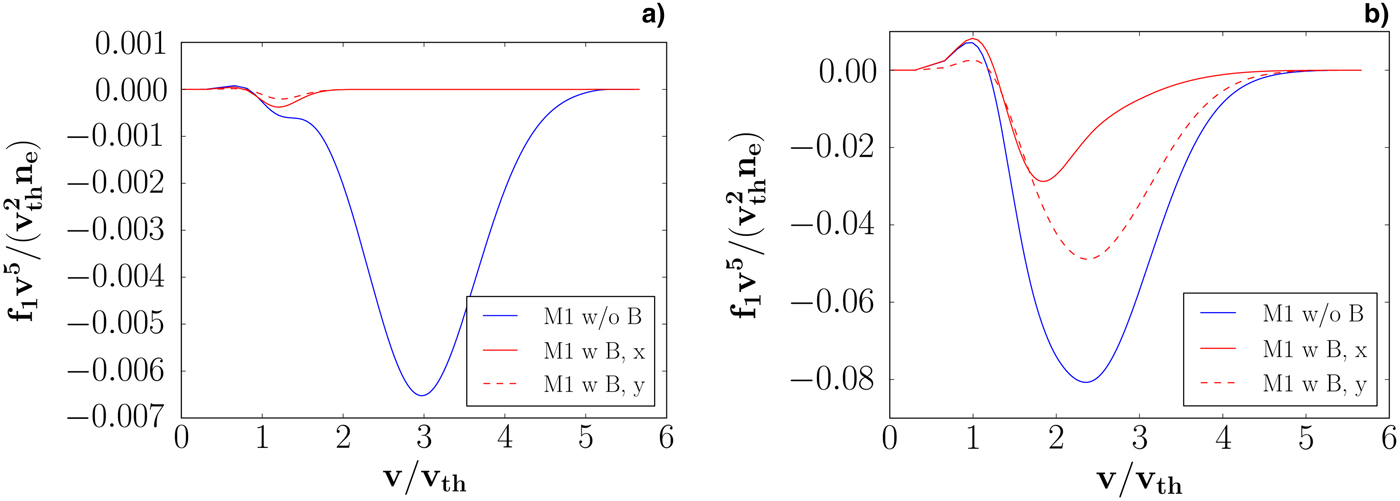
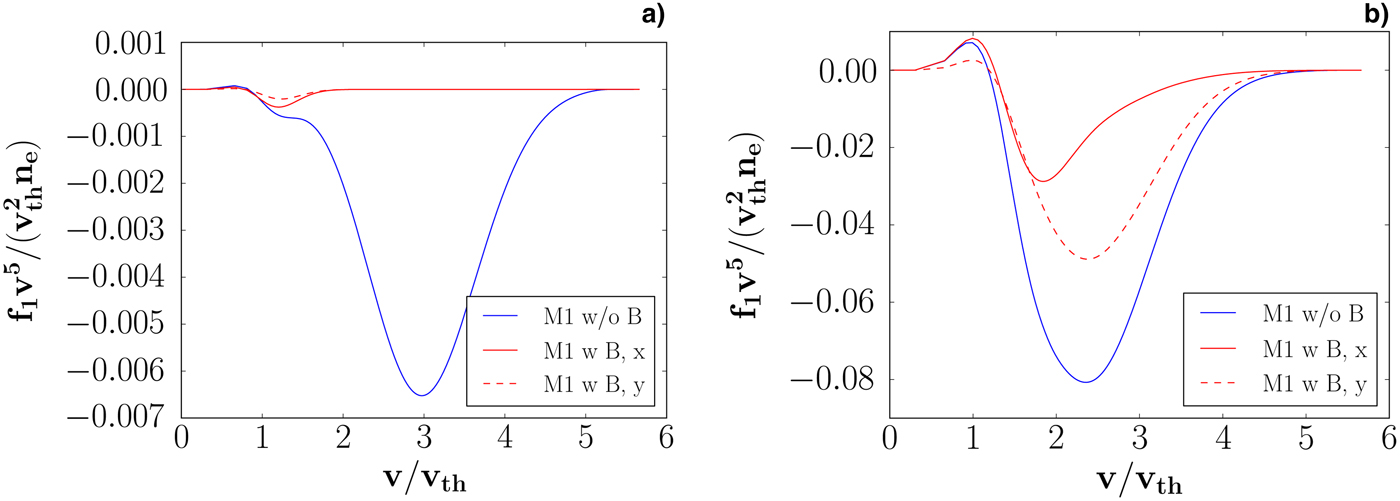
In Figures 3a and 3b, we plot the heat flux integrand functions
 $ \propto \,{v^5}{\vec f_1}$
, computed in the cold and central regions, denoted by dashed vertical lines in Figure 2a. The local theory predicts the presence of two peaks along the direction of the temperature gradient f
1x
. A positive peak at low velocities corresponds to the return current and a negative peak at higher velocities corresponds to the main heat flux. In the central region, variations of f
1x
are small corrections. In the cold region of the unmagnetized plasma a hot nonlocal flux is deposited (higher peak of Fig. 3a), inducing a strong modification of the heat flux integrand function, compared with the magnetized case, closer to local predictions. This is due to the reduction of the effective MFP by the magnetic field. The first moment EDF in the crossed direction f
1y
, plotted in Figures 3a and 3b, for the magnetized plasma, shows the flux rotation. It becomes dominant for suprathermal velocities, especially close to the central region. The maximum flux contribution is displaced to the lower velocities, in comparison with the value 3.7v
th, predicted by the SH theory.
Magnetized and unmagnetized integrand functions of the heat flux
 $ \propto {v^5}{\vec f_1}$
, in the cold (a) and central (b) regions, denoted by dashed lines in Figure 4d. They are plotted as functions of the velocity modulus. The magnetized flux is split in f
1x
, in the x-direction (continuous line) and f
1y
, in the y-direction (dotted line).
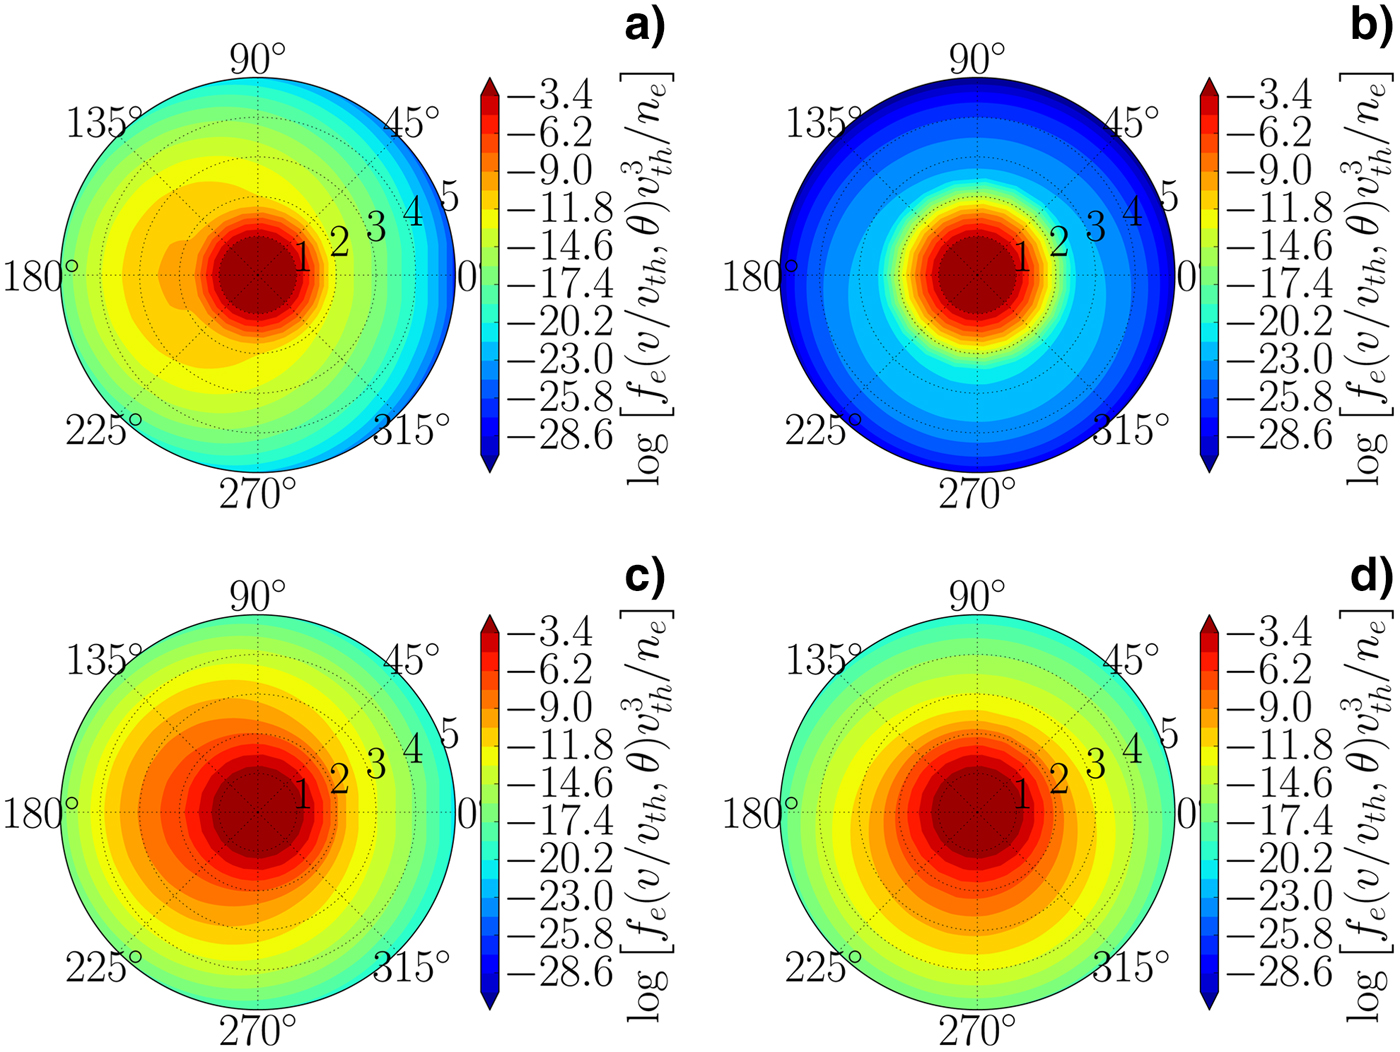
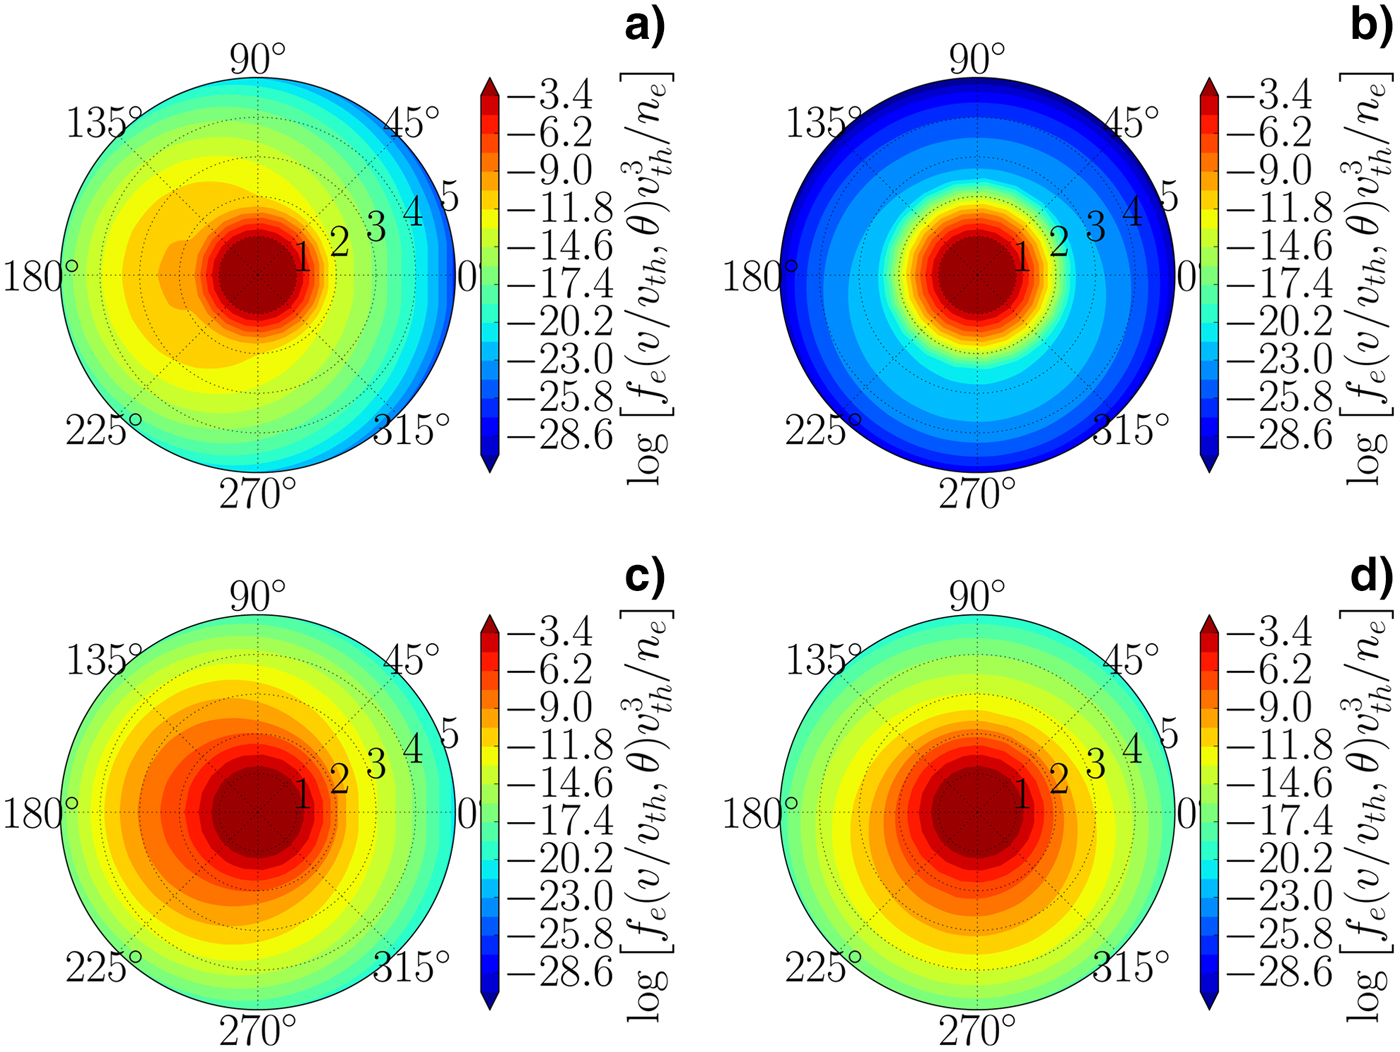
Unmagnetized (ωBτe = 0) and magnetized ωBτe = 0.5 dimensionless logarithm of the EDF, respectively plotted in (a) and (b), for the cold region of the plasma and in (c) and (d), for the central region of the plasma. The analysis is performed in function of the velocity modulus (radial direction of the xy-plane) and of the velocity angle with respect to the temperature gradient (x-axis), in the cold region and in the central region, as indicated by vertical lines, in Figures 2a and 2b.
In the local regime, electrons which transport the heat (v ≈ 3.7v
th) experience a magnetization of ≈ 3.2 ωBτe. In the nonlocal case, the characteristic velocity of these electrons decreases (Epperlein & Short, Reference Epperlein and Short1992). In fact, the heat flux is given by a product of the density of electrons d
3
vf
e in the differential volume d
3
v and their energy flux
 ${\rm \varepsilon} \vec v$
. If the gradients become sharper, more electrons with a lower MFP (lower velocities) are present in the front of the gradient. This implies a decrease of the effective Hall parameter experienced by these electrons and so a decrease of the heat flux magnetization. According to Figure 3b, in the central region, the heat flux characteristic velocity along the temperature gradient is ||(v
x
= 2v
th, v
y
= 2.5v
th)|| ≈ 3.2v
th, which implies a reduction of the experienced magnetization to ≈ 2.1ωBτe.
The EDFs in the unmagnetized and magnetized regimes, computed with the M1 model are shown in Figure 4 in the region shown in Figures 2a and 2b by the vertical lines. In the unmagnetized case the EDF presents a direction of anisotropy toward the colder region of the plasma (180°), due to electrons transporting the heat. Magnetic effects reduce this anisotropy and induce a drift of electrons in the y-direction (Hall effect), affecting the macroscopic transport. Same effects are visible in the central region, but in this case the Hall current is dominant, due to a stronger electric field. The total EDFs are the ones shown in Figures 4c (unmagnetized plasma) and 4d (magnetized plasma). Note that the Hall parameter experienced by a particle with a velocity ||(v
x
= 2.5v
th, v
y
= 2.5v
th)|| ≈ 3.5v
th is 1.4, corresponding to the rotation angle = arctan
 $[{\,f_{1y}}(2.5{v_{{\rm th}}})/{\,f_{1x}}(2.5{v_{{\rm th}}})] \approx 70{{\char176}} $
(see Fig. 1d).
6.2. Temperature Modulation in a Magnetized Plasma
Epperlein and Short (Reference Epperlein and Short1991) proposed a test for the study of nonlocal transport. We extend it to the case of a magnetized plasma.
We consider a fully ionized beryllium plasma, with a constant density
 $4.5 \times {10^{22}} {\rm c}{{\rm m}^{ - 3}}$
and the periodic temperature modulation
 $${T_{\rm e}}(x) = {T_0} + {T_1}\sin (kx),$$
with T 0 = 1 keV and T 1 = 0.1 keV. The magnetic field is applied in the perpendicular direction (z), with a constant Hall parameter. Periodic boundary conditions are applied to the x- and y-directions. The length is normalized by the MFP λ0 ≈ 0.17 μm.
According to Eq. (A3), thermoelectric effects can be neglected, because the error induced in the local regime, at x = 0, for ωBτe = 1, is only 0.04% (νe = 2.2 × 10¹³ s−1) and even lower in the nonlocal transport regime, which experiences a lower magnetization.
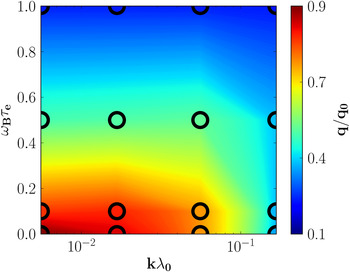
The Hall parameter is varied from the unmagnetized case (ωBτe = 0), to ωBτe = 1, for different values of kλ 0, focusing on the flux limitation, where the modulus of fluxes is maximum. The heat flux limitation is shown in Figure 5 by normalizing the heat flux on the maximum value of the SH flux.
Generalization of the ES test to magnetized plasma. Modulus of the heat flux, normalized to the maximum of the modulus of the SH flux, are given as functions of both nonlocal parameter (kλ 0) and Hall parameter ωBτe. Circles indicate the sampled points, while the color background is a linear fit among these points.

The analysis shows that the nonlocal flux limitation is reduced, increasing the Hall parameter. This confirms the reduction of nonlocal effects due to the reduction of the effective MFP, as described in the previous section. In particular, the flux magnitude is nearly unmagnetized for ωBτe = 0.1 and nearly local for ωBτe = 1.
Figure 5 provides a new and simple way to see the combined effect of nonlocal and magnetized transport.
7. THERMAL WAVE PROPAGATION IN MAGNETIZED PLASMAS
The purpose of this section is to describe a propagation of a thermal wave in a magnetized plasma, in the conditions of nonlocal transport. For that, the M1 electron transport model is coupled to the hydrodynamic code CHIC (Breil & Maire, Reference Breil and Maire2007). We consider a fully ionized beryllium plasma of constant density 4.5 × 1022 cm−3. The initial electron temperature distribution is given as
 $${T_{\rm e}}(x,y) = {T_{\rm e}}(x){e^{ - \displaystyle{{{y^4}} \over {y_{{\rm max}}^4}}}} \left[ {{\rm \theta} (x){{\left( {\displaystyle{{{x_{\max}}} \over {2x}}} \right)}^{\,p{{(y)}^{ - 1}}}} + {\rm \theta} ( - x)} \right],$$
with θ as the Heaviside function, p(y) = 3exp [y 2/(Lx max)], L = 200 μm, T 0 = 5 keV, T 1 = 1 keV, δNL = 5 μm, and x max = y max = 100 μm are the lengths of the target along x- and y-axes. The initial temperature profile is shown in the background of Figure 6, as a color plot. The plasma is simulated with symmetric conditions at the boundaries.
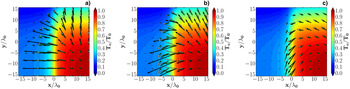
Initial distribution of the electron temperature and heat fluxes, for ωBτe = 0 (a), 0.1 (b), and 0.5 (c). The initial electron temperature profile is shown by the background colors and arrows indicate heat fluxes predicted by different models: the Braginskii's theory (in black), the M1 (in white), and the SNB model (in green).

The magnetization ωBτe is constant in space and time. The magnetic field varies according to B z (x, y, t) = m e c/[eτ e(x, y, t)]ωBτe. This choice is not an assumption of the model but just an artifice in order to simplify the analysis and to facilitate a comparison with the Braginskii's theory. In principle, the M1 model is able to deal with any magnetic field configuration.
The electron heat transport generates a thermal wave, which smoothen the temperature gradient, till to reach a constant temperature at the thermal equilibrium. A temporal evolution of the temperature is given by the heat equation for electrons
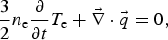 $$\displaystyle{3 \over 2}{n_{\rm e}}\displaystyle{\partial \over {\partial t}}{T_{\rm e}} + \vec \nabla \cdot \vec q = 0,$$
assuming the perfect gas approximation. In this example, the maximum gradient length is L
T ≈ 11 μm. So the characteristic hydrodynamic time is τhydro ~ L
T/c
s ≈ 24 ns, where the acoustic velocity is
 ${c_{\rm s}} = \sqrt {Z{T_0}/{m_{\rm i}}} = 0.46\,{\rm \mu} {\rm m/ps}$
. On the other hand, the characteristic time of thermal diffusion is
 ${{\rm \tau} _{{\rm diff}}}\,{\rm \sim} \,{n_{\rm e}}L_{\rm T}^2 /{\rm \chi} \approx 1.3\,{\rm ps}$
, where
 ${\rm \chi} \,{\rm \sim}\, {n_{\rm e}}v_{{\rm th}}^2 {{\rm \tau} _{\rm e}}$
is an effective thermal conductivity, with
 ${{\rm \tau} _{\rm e}} = 3\sqrt {\displaystyle{{\rm \pi} \over 2}} \displaystyle{{m_{\rm e}^{1/2} T_0^{3/2}} \over {4{\rm \pi} {n_{\rm e}}Z{e^4}{\Lambda _{{\rm ei}}}}} \approx 0.11\, {\rm ps}$
and
 ${v_{{\rm th}}} = \sqrt {{T_{\rm e}}/{m_{\rm e}}} \approx 30\,{\rm \mu} {\rm m/ps}$
. Since τhydro > τdiff, the hydrodynamic motion can be neglected.
According to Eq. (A3), thermoelectric effects can be neglected, making an error of ~0.3% for ωBτe = 10.
In what follows we compare the time evolution of the system, using three models for the heat flux
 $\vec q$
: the Braginskii's theory, the M1 and the SNB model, in different regimes of magnetization. Equation (24) is solved for the temperature, injecting at each temporal step the heat flux
 $\vec q$
predicted by the corresponding transport model. The analysis is performed for dimensionless quantities. The temperature is normalized by the initial maximum of the temperature profile T
0 = 5 keV, the space by the maximum MFP λ0 ≈ 3.15 μm and the heat fluxes over the maximum of the magnitude of the initial SH heat flux q
0 = 40 PW/cm2.
7.1. Analysis of Initial Conditions
Figures 6 show electron heat fluxes induced by the initial electron temperature profile, appearing in background, as a color plot. Fluxes are computed for increasing values of the Hall parameter (constant in space) and are represented as arrows. The Braginskii's, the M1 and the SNB models are respectively represented in black, white and green.
Figure 6a, corresponding to the case ωBτe = 0, shows that the local heat flux is always perpendicular to the temperature gradient. The case of a weak magnetization (ωBτe = 0.1), reported in Figure 6b, shows a local flux rotation, respect to the unmagnetized case. Increasing the magnetization (ωBτe > 0.1), we can see another effect: a reduction of the local flux. These two effects become dominant in Figure 6c, for ωBτe = 0.5. Finally, for a high degree of magnetization (ωBτe ≫ 1), the flux is suppressed.
Figure 6a shows the main effects of unmagnetized nonlocal transport, described in the previous chapter. A flux limitation can be seen near x ≈ 0, the preheating near x ≈ −5 and the rotation is negligible. The M1 and the SNB models quite well agree in the description of nonlocal fluxes.
When a small magnetization is imposed (ωBτe = 0.1), the direction of heat flux deviates from the direction of the temperature gradient, due to magnetic fields. The flux rotation, in nonlocal models, appears weaker compared with the local case. This qualitative effect can be seen in both M1 and SNB models; however, they slightly differ in the value of this rotation. The M1 model corresponds to a smaller one, compared with the SNB model. For both models, the flux reduction, due to magnetic fields, becomes important for ωBτe = 0.5. This confirms that nonlocal fluxes are less affected by magnetic fields, compared with their local counterparts. This conclusion is in accordance with the studies presented in Figure 6 of (Brantov et al., Reference Brantov, Yu Bychenkov, Rozmus, Capjack and Sydora2003).
For a strong magnetization (ωBτe = 0.5), nonlocal models approach the local predictions. These models superpose in the case of flux suppression (Del Sorbo, Reference Del Sorbo2015) (ωBτe ≫ 1). This is in accordance with the results plotted in Figure 5, where λ0/L T = 0.1 kλ 0. This behavior is due to a reduction of the MFP, induced by magnetic fields (Nicolaï et al., Reference Nicolaï, Feugeas and Schurtz2006).
7.2. Temporal Evolution
Equation (24) conserves the total energy in the simulation box, regardless of the model used.
Electrons, in the hot region, have a velocity
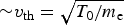 ${\rm \sim} {v_{{\rm th}}} = \sqrt {{T_0}/{m_{\rm e}}}$
 $\approx 3 \times {10^9}\,{\rm cm/s}$
. The maximum distance of the simulation box is 45 λ0 (diagonal direction). In the unmagnetized regime, electrons take 45 τe ≈ 5 ps to travel along the simulation box. At this time, the differences between models are maximum. In subsequent times, they are reduced, since temperature gradients become smoother.
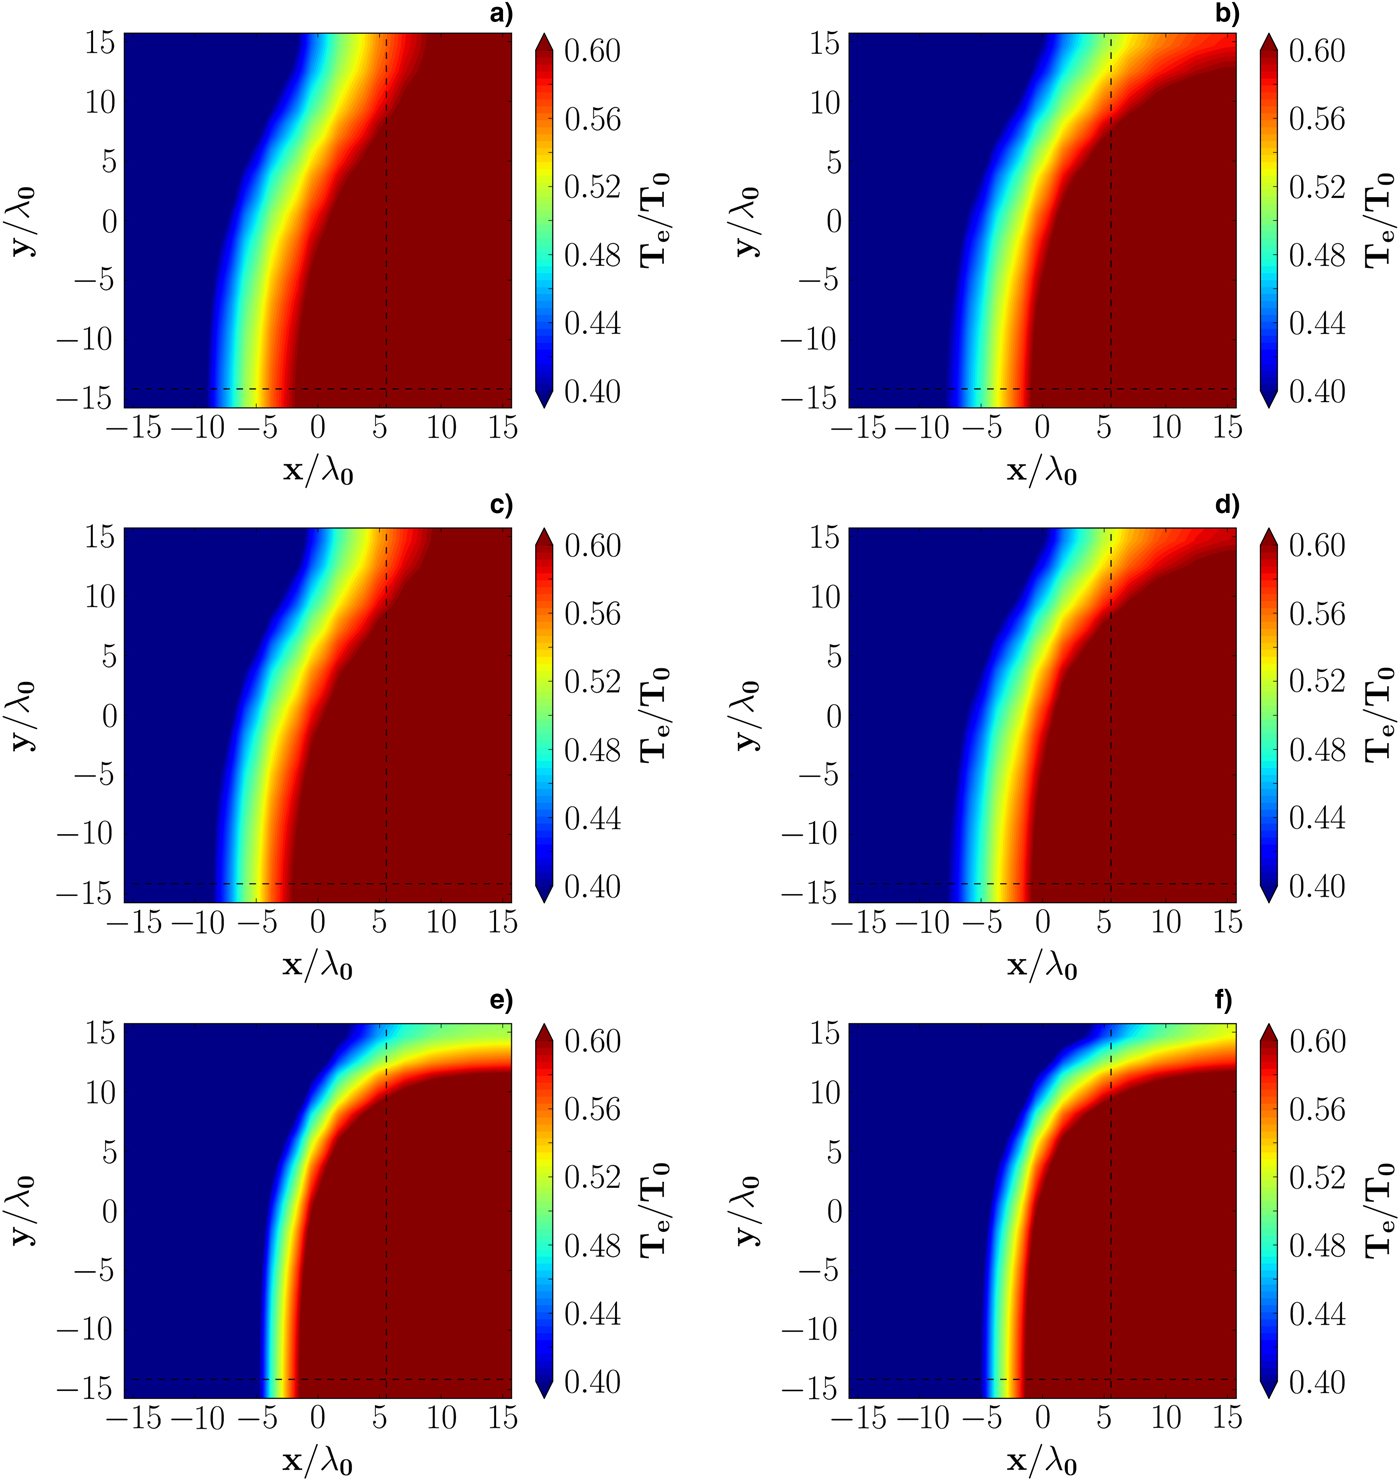
Figures 7a and 7b show respectively the Braginskii's and the M1 temperature predictions, after 45 τe, in the unmagnetized regime. The local heating is more efficient, because of the flux limitation which characterizes nonlocal models. The local flux smoothens the temperature gradients more than in nonlocal case. The SNB model provides results very close to M1.
Plasma electron temperature distribution, after 45 τe. Dashed lines indicate the regions where line-outs have been performed. Panels (a) and (b) correspond to the case without magnetic field, respectively using SH and M1 models. Panels (c) and (d) correspond to ωBτe = 0.1, respectively, using Braginskii's and M1 models. Panels (e) and (f) to ωBτe = 0.5, respectively using the Braginskii's and M1 models. The SNB model has not been reported since, in this case, the differences from the M1 model are small and not easily visible in two dimensions.
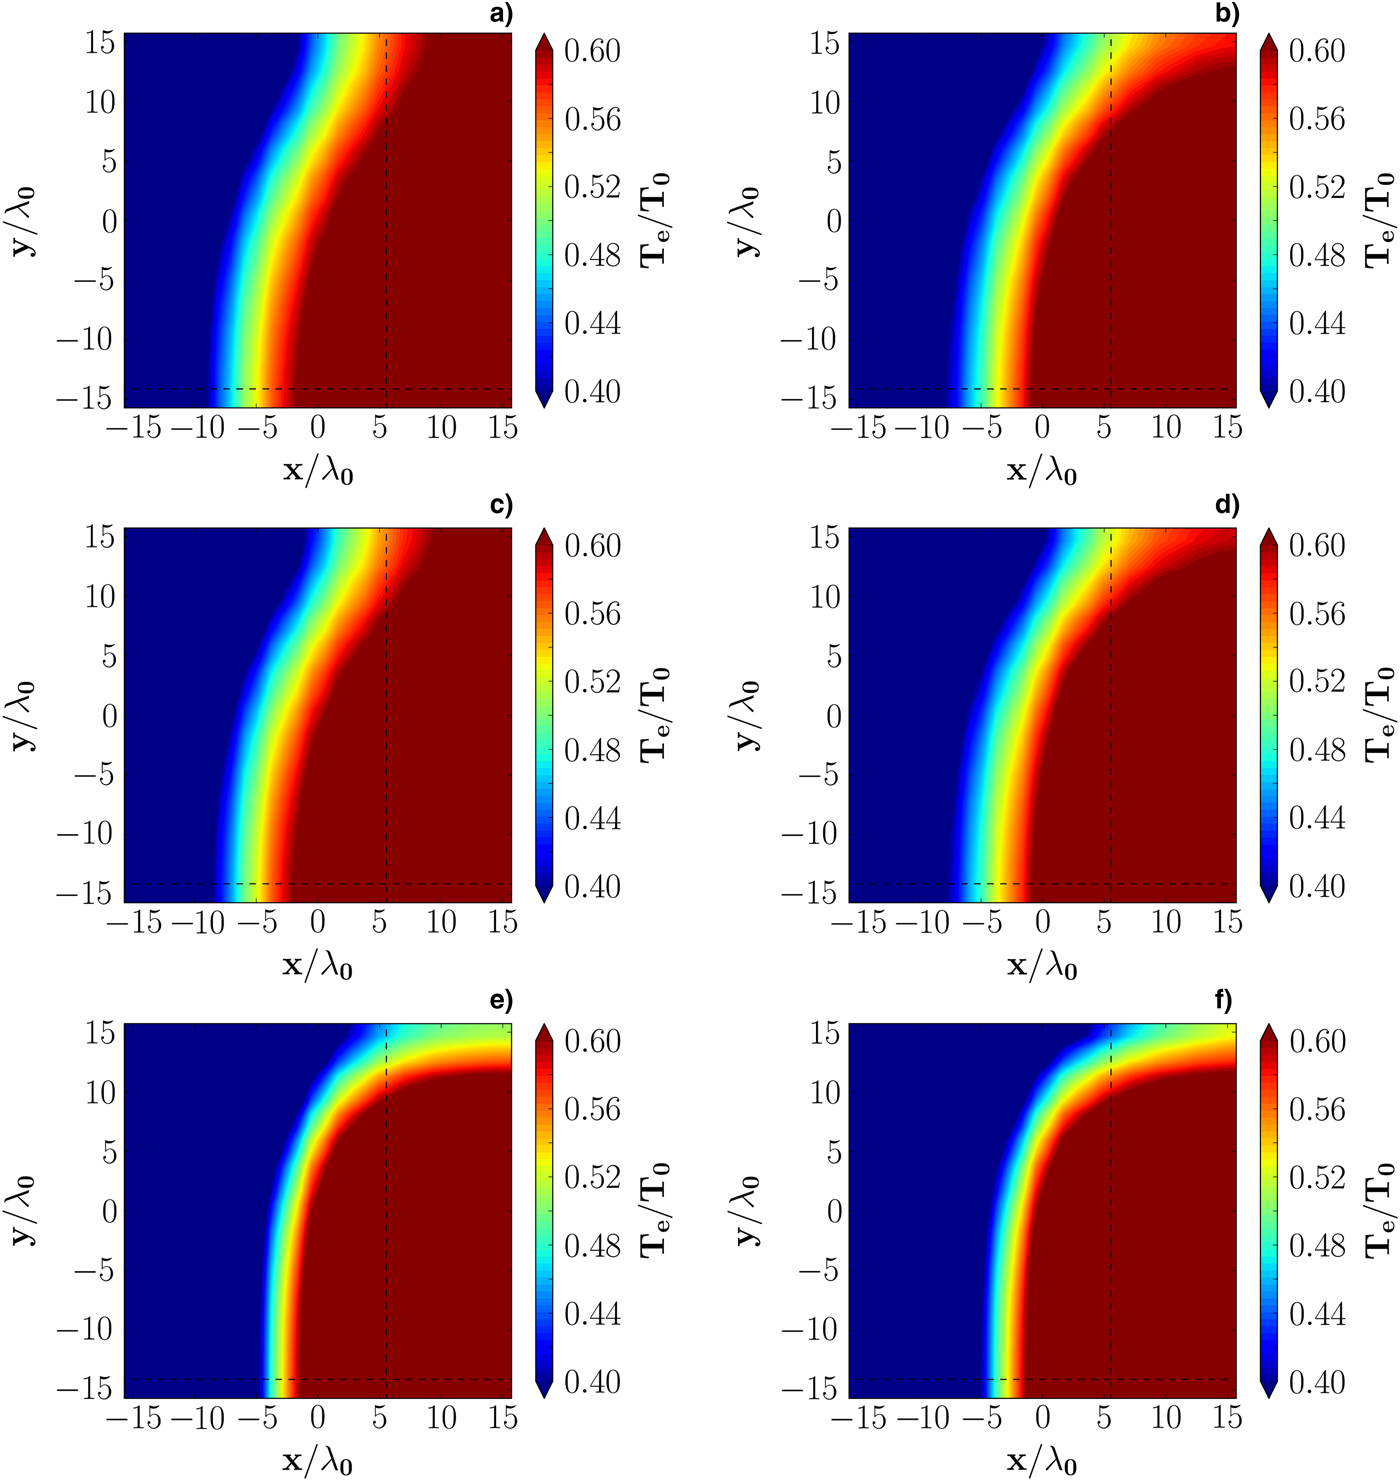
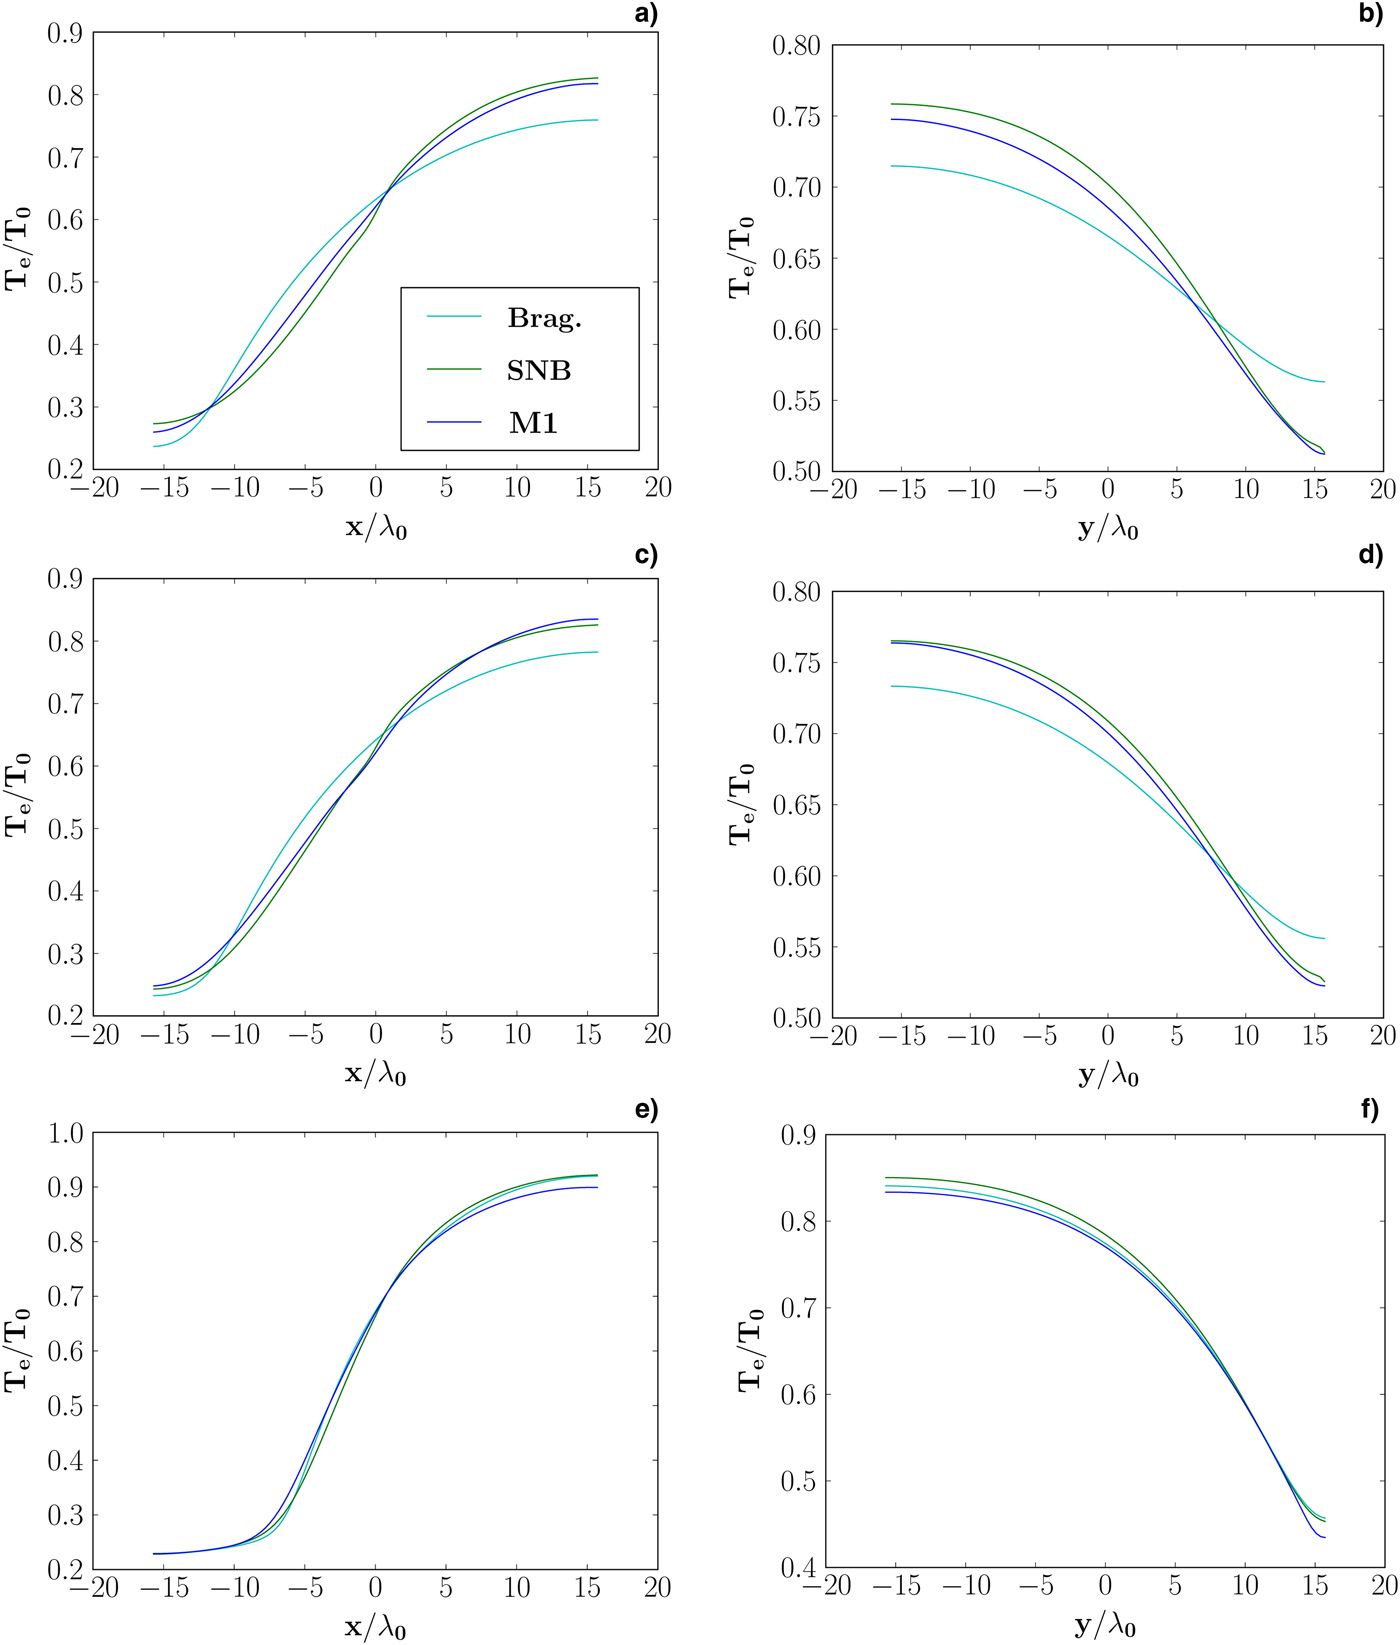
Dashed lines in Figure 7 indicate the regions where line-outs have been performed. Cuts for an unmagnetized plasma along the x-direction are shown in Figure 8a, while that along the y-direction in Figure 8b. They show a general gradient smoothing, while a weak preheating is visible in front of the temperature gradient, along the x-direction, induced by nonlocal transport. The SNB model, also shown in the plot, agrees with M1 predictions.
Cuts along the x- (a,c,e) and y-directions (b,d,f) of the temperature profiles shown in Figure 7, with ωBτe = 0 (a) and (b), ωBτe = 0.1 (c) and (d). The case ωBτe = 0.5 has not been shown since no sensible variations between models appear yet. The temperature is predicted by the local (cyan lines), the SNB (green lines) and the M1 (blue lines) models.
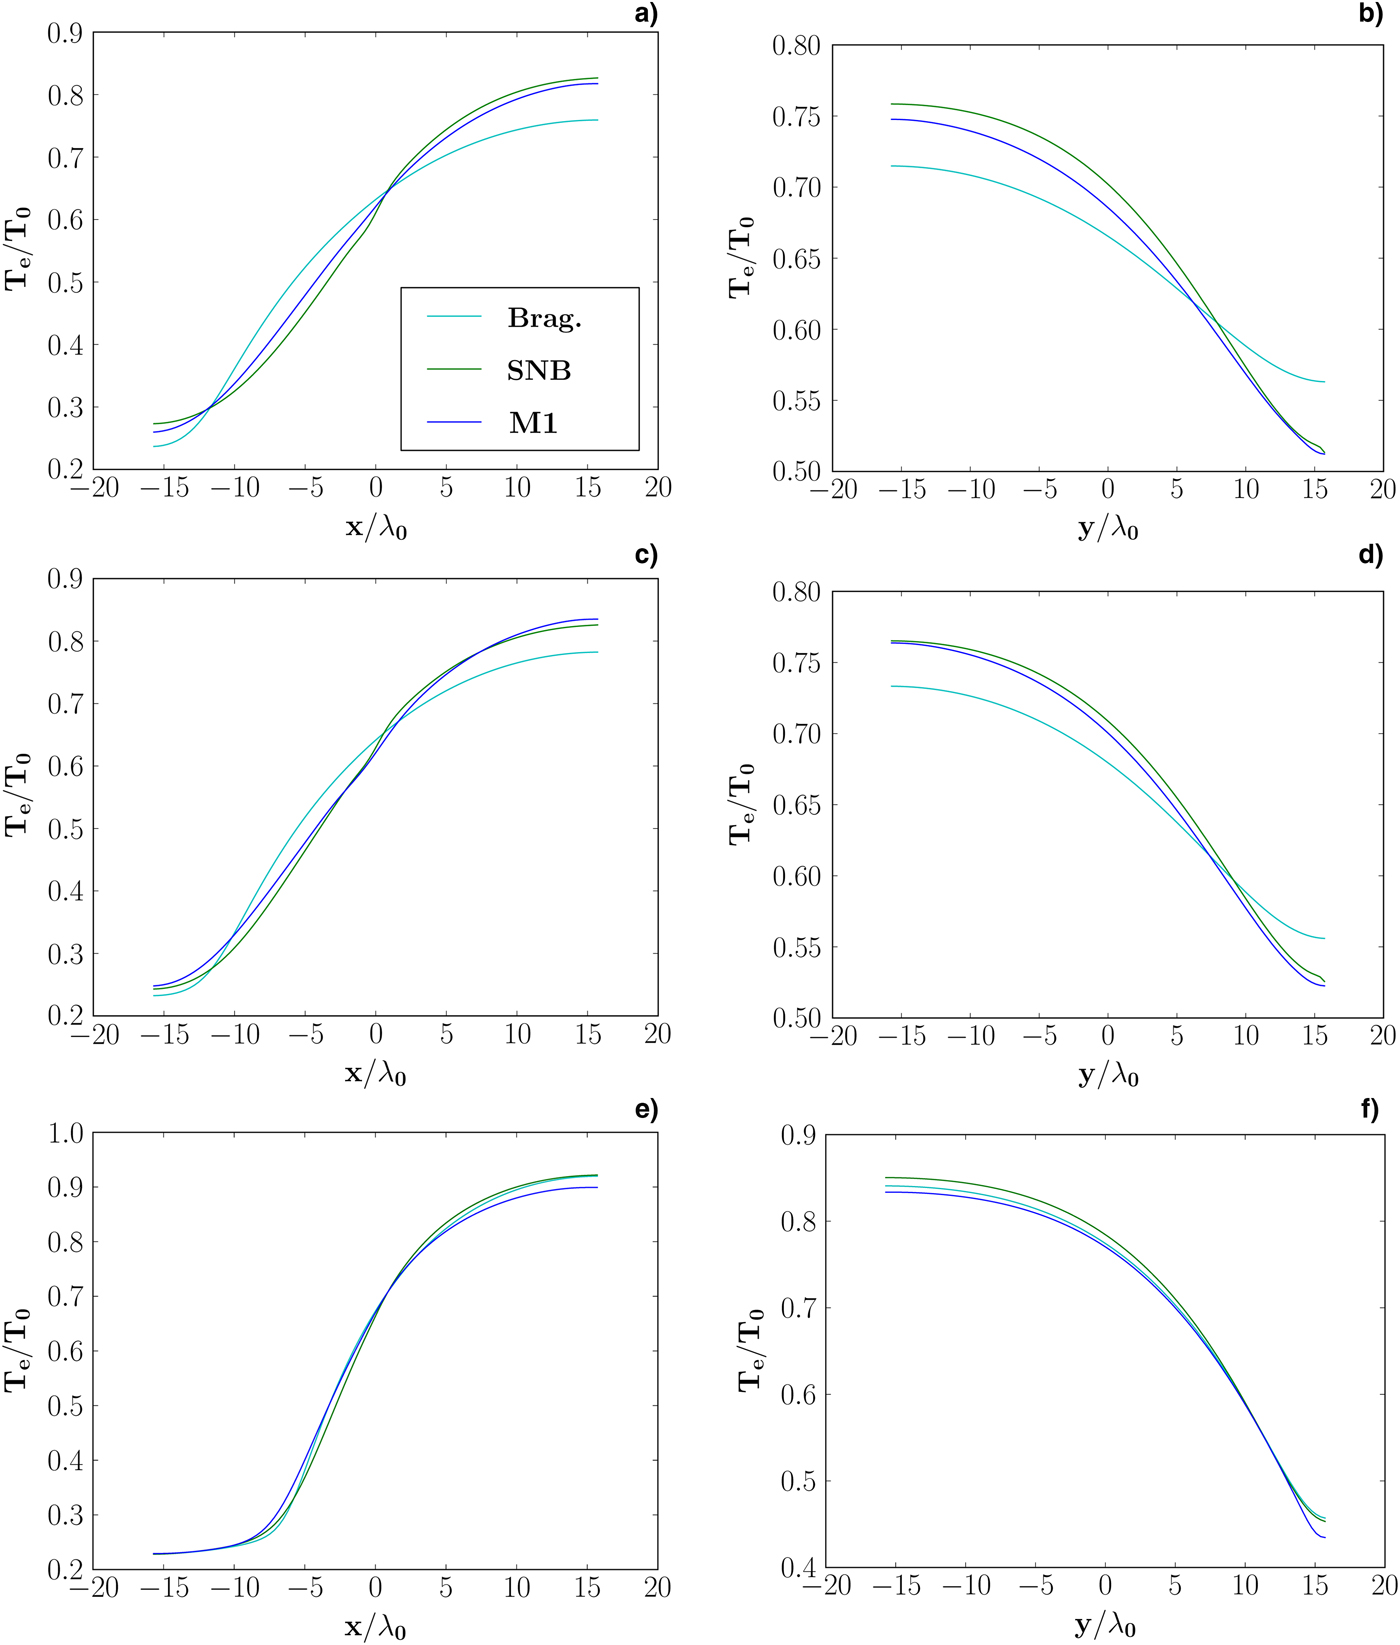
Adding a weak degree of magnetization (ωBτe = 0.1) to the system, we observe the effect of flux rotation (~ 5° − 10°, in the local case), related to magnetic fields. Temperature predictions are shown in Figures 7c (Braginskii's predictions) and 7d (M1 predictions). The SNB model provides results close to M1. Figures 8c and 8d show the horizontal and vertical cuts of the temperature profile. The Braginskii's theory predicts that the gradients are less smoothed than in the magnetized case. On the contrary, nonlocal models (M1, SNB) are not affected by such a weak magnetization. The nonlocal electrons behave as if they do not experience any magnetization. The SNB and M1 models give very similar results.
With ωBτe = 0.5, the effective MFP is reduced by a factor
 ${\rm \sim} 1/(1 + C{\rm \omega} _{\rm B}^2 {\rm \tau} _{\rm e}^2 )$
, with C ~ 1, thus fluxes are reduced: the temperature gradients are less smoothed by the heat transport, as shown in Figure 7e. Despite a high degree of nonlocality, no differences can be found between Braginskii's, SNB and M1 predictions. The latter are shown in Figure 7f. Because of the flux reduction, heating effects require a longer time to appear.
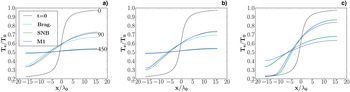
Figures 9a, 9b and 9c show a temporal evolution of the temperature profile, in the x-direction (y ≈ 14 λ0), at 0, 90 τe (10 ps) and 450 τe (50 ps). As expected, temperature gradients decrease with time leading to a homogeneous temperature at the equilibrium. Considering the temperature difference evolution with time, ΔT e(t) = max[T e(t)] − min [T e(t)], for ωBτe = 0, the local theory predicts a faster thermalization than the nonlocal model. The SNB and M1 models agree in this prediction. In the case of a weak magnetization ωBτe = 0.1, the thermalization time predicted by the Braginskii's theory is weakly reduced, while the Hall parameter is not sufficiently high to affect the nonlocal transport. So nonlocal models behave as in the case ωBτe = 0.
Temporal evolution of the temperature profiles along the x-direction, for ωBτe = 0 (a), 0.1 (b), and 0.5 (c). The black curve represents the initial condition, the subsequent curves represent at 90 τe and 450 τe, the temperature predicted by the local (cyan lines), the SNB (green lines), and the M1 (blue lines) models, for different degrees of magnetization. Black arrows have been added, in order to clarify the variation of temperature in time.

A different result is obtained with a magnetization of ωBτe = 0.5. In this case, the magnetization is strong enough to affect both local and nonlocal models. In the local simulations the thermalization time is strongly increased because the heat flux is reduced. The SNB model gives a local heat flux. On the contrary, the M1 model predicts a thermalization time longer than the local model. This result is surprising, since it is opposite to usual expectations from the nonlocal effects. Its explication is related to the heat flux rotation, shown in Figure 6c. This rotation is weaker in the M1 simulation because of nonlocal effects, leading to a configuration in which the horizontal component of the flux in x ≈ 0 (main flux) is the same for the M1 model and for the Braginskii's theory. Nevertheless, in the nonlocal case, another flux is present: the preheating at x ≈ 3λ0, which is absent in the local case. The preheating flux is responsible for the increase of heating efficiency in the horizontal direction.
Compared with the M1 model, the SNB model seems to overestimate the effects of magnetization. This difference becomes visible at long times, since magnetic effects reduce the heat transport, and so the temperature takes a longer time to be modified. It is due to the different treatments of magnetic fields, which are phenomenological for the SNB model. The system studied moves toward a lower degree of nonlocality, so differences are reduced in time. In the presence of a laser field, highly nonlocal regimes can be created. In this case, the differences, which now appear small, could become very important.
8. CONCLUSIONS
The M1 electron transport model is extended to the domain of magnetized plasmas. It is able to reproduce results given by the Braginskii's theory, in the local regime. The nonlocal limit is studied for a wide range of cases. All of them show that magnetic field reduces nonlocal effects but also that nonlocal transport reduces magnetic effects. The analysis has been also performed at the kinetic level, which demonstrates the flux rotation, in the phase space.
A thermal wave propagation through a magnetized plasma is performed. For weakly magnetized plasmas, the thermalization takes more time with the nonlocal model than with the local one because of the flux-limitation. On the contrary, in strongly magnetized plasmas, nonlocal effects are reduced.
The temporal analysis reveals a disagreement between the M1 and the SNB model, which is explained by the fact that the latter overestimates the effects of magnetization, because of an approximate evaluation of the induced electric field effects.
In conclusion, the M1 model is able to deal with magnetized plasmas. It provides an efficient and robust method of description of suprathermal electron transport in high-energy-density plasmas, remaining formally simpler than the generalization to magnetized plasmas of the SNB model.
ACKNOWLEDGEMENTS
This work has been carried out within the framework of the EUROfusion Consortium and has received funding from the Euratom research and training programme 2014–2018 under grant agreement No 633053. The views and opinions expressed herein do not necessarily reflect those of the European Commission.
APPENDIX A
DEMONSTRATION OF THERMAL CONDUCTION DOMINANCE
Here, we demonstrate the dominance of the thermal conduction, for the plasmas considered in Section 5. This procedure can be extended to other plasmas in the limit of low magnetization.
The local heat flux in Eq. (5) contains the thermal and thermoelectric components. The thermoelectric heat flux is proportional to the current which has a nonzero value in the y-direction (crossed between the temperature gradient and the magnetic field). Since ωBτe is constant,
 ${B_z} \propto {\rm \tau} _{\rm e}^{ - 1} \propto T_{\rm e}^{ - 3/2} $
and ∂B
z
/∂x = −3B
z
/(2T
e)∂T
e/∂x. So, the current can be written as
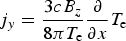 $${\,j_y} = \displaystyle{{3c{B_z}} \over {8{\rm \pi} {T_{\rm e}}}}\displaystyle{\partial \over {\partial x}}{T_{\rm e}}$$
and the y-component of the heat flux reads
 $${q_{{\rm B}y}} = - {k_ \wedge} \displaystyle{{\partial {T_{\rm e}}} \over {\partial x}}\left( {1 + \displaystyle{{{{\rm \beta} _ \bot}} \over {{k_ \wedge}}} \displaystyle{{3c{B_z}} \over {8{\rm \pi} e}}} \right).$$
The term in parenthesis can be expressed as a function of the Hall parameter and of the dimensionless thermal conductivity
 ${{\bar {\bar k}}^c} = {\bar {\bar k}}{m_{\rm e}}/({n_{\rm e}}{T_{\rm e}}{{\rm \tau} _{\rm e}})$
. Normalizing by the SH flux
 ${q_{{\rm SH}}}(x) = - k_ \bot ^c ({{\rm \omega} _{\rm B}}{{\rm \tau} _{\rm e}} = 0){n_{\rm e}}{T_{\rm e}}{{\rm \tau} _{\rm e}}/{m_{\rm e}}\partial {T_{\rm e}}/\partial x$
, we have
 $$\displaystyle{{{q_{{\rm B}y}}} \over {{q_{{\rm SH}}}}} = - \displaystyle{{k_ \wedge ^c} \over {k_ \bot ^c ({{\rm \omega} _{\rm B}}{{\rm \tau} _{\rm e}} = 0)}}\left( {1 + \displaystyle{{{{\rm \beta} _ \bot}} \over {k_ \wedge ^c}} {{\rm \omega} _{\rm B}}{{\rm \tau} _{\rm e}}\displaystyle{3 \over 2}\displaystyle{{{m_{\rm e}}{c^2}} \over {{T_{\rm e}}}}\displaystyle{{{\rm \nu} _{\rm e}^2} \over {{\rm \omega} _{{\rm pe}}^2}}} \right).$$
For the plasmas described in Section 5, at the position x = 0, T e = 2.75 keV, ωpe = 1.8 × 10¹⁶ s−1 and τe = 1.1 × 10¹³ s−1 for Z = 1, and ωpe = 1.1 × 10¹⁶ s−1 and τe = 2.9 × 10¹⁴ s−1 for Z = 79. Neglecting the thermoelectric contribution (second term in parenthesis), the error committed increases as ωBτe increases. In particular for the plasma with Z = 1 and for ωBτe = 30, the error equals 0.06%. For the case Z = 79 and for ωBτe = 3, the error is around 5.4% but for ωBτe > 3 the thermoelectric term needs to be accounted for. Thus, in the limit of our analysis (ωBτe ≤ 30 for Z = 1, and ωBτe ≤ 3 for Z ≫ 1), thermoelectric effects can be neglected and we only consider the thermal conductivity.