Introduction
Reactions in Ni/Al nanolaminates are a topic of scientific interest due to the magnitude of exothermic output and the ability to modify combustion characteristics. For example, calculations predict adiabatic combustion temperatures up to 1912 K, and experiments show ignition at temperatures below 500 K [Reference Rogachev1]. Such combustion characteristics have found industrial application in soldering microelectronic components [Reference Mukasyan, Rogachev and Aruna2] and have been proposed for military use as microinitiators in ordnance systems [Reference Zhou, Shen, Ye, Zhu, Hu and Wu3, Reference Qiu, Tang, Liu, Huang, Guo and Yu4].
The combustion characteristics of Ni/Al nanolaminates can be modified through changes to initial nanostructure. The most fundamental structural aspect is the bilayer thickness, defined as the combined length of one Ni and one Al layer. Reducing this bilayer thickness, down to ∼19 nm for samples with limited annealing and interface premixing, results in increasing combustion temperatures and wave speeds [Reference Knepper, Snyder, Fritz, Fisher, Knio and Weihs5, Reference Politano and Baras6]. Further reductions in the bilayer thickness result in decreasing wave speeds, attributed to an increased volume fraction of premixing at the Ni/Al interface, which reduces stored energy available for combustion [Reference Knepper, Snyder, Fritz, Fisher, Knio and Weihs5]. Likewise, several authors have shown that increasing this premixed region leads to decreasing combustion wave velocity across all bilayer thicknesses studied [Reference Jayaraman, Mann, Weihs and Knio7, Reference Mann, Gavens, Reiss, Van Heerden, Bao and Weihs8, Reference Gavens, Van Heerden, Mann, Reiss and Weihs9]. Increasing misfit strain along the Ni/Al interface has also been shown to reduce the ignition temperature [Reference Crone, Knap, Chung and Rice10].
The Ni/Al nanolaminate reaction has been divided into stages by various authors. Rogachev et al. used experiments and molecular dynamics (MD) simulations to identify two major stages of the self-propagating reaction in which combustion initiates at one end and traverses the sample length. The first stage is an exothermic diffusion/dissolution of Ni into Al, leading to the formation of nanograins of B2–NiAl separated by liquid Ni + Al [Reference Rogachev, Vadchenko, Baras, Politano, Rouvimov, Sachkova, Grapes, Weihs and Mukasyan11]. The second stage is exothermic growth of these B2–NiAl grains. Turlo et al. further divided stage 1 into 5 separate stages: conduction of the ignition temperature along the sample, melting of Al, dissolution of Ni into liquid Al, full dissolution/melting of Ni and mixing of liquid Ni and Al, and nucleation and initial growth of B2–NiAl grains [Reference Turlo, Politano and Baras12]. Stage 6 identified by Turlo et al. is effectively the same as stage 2 identified by Rogachev et al. Witbeck et al. evaluated a homogenous Ni/Al nanolaminate reaction, which was initiated by increasing the total system temperature [Reference Witbeck, Sink and Spearot13]. They presented four stages: (1) Ni diffusion into solid Al which heats the local region near the Ni/Al interface and forms a thin layer of Al-rich liquid, (2) simultaneous dissolution of Ni into the liquid Al and melting of the solid Al layer until the Al is fully melted, (3) increased rate of Ni dissolution into the Al-rich liquid until the temperature of the system reaches the melting point of Ni and (4) exothermic mixing of the Ni + Al melt.
Several researchers have shown that formation of the B2–NiAl phase is dependent on combustion characteristics and can be controlled through nanolaminate structure and boundary conditions. Xu et al. reported that the B2–NiAl phase formed at temperatures less than 1700 K at 0 GPa in isothermal, isobaric MD simulations. They also found that the presence of this phase increased the diffusion activation barrier of Ni into Al by as much as 3 times [Reference Xu, Falk and Weihs14]. Similarly, Turlo et al. reported that the B2–NiAl phase did not form, because it was thermodynamically unstable, during reactions in nanolaminates with relatively thin bilayer thickness at higher constant boundary temperatures [Reference Turlo, Politano and Baras15]. Allowing temperature to evolve in constant pressure and constant enthalpy (NPH) simulations, Witbeck et al. reported formation of the B2–NiAl phase only in thicker bilayer models with lower vacancy concentrations [Reference Witbeck, Sink and Spearot13]. The B2–NiAl phase did not form in models with thinner bilayers or thicker models with higher vacancy concentrations where full melting of the system occurred before the B2–NiAl phase could nucleate. Thus, nanostructure and boundary conditions can be modified in Ni/Al nanolaminates to control the phases formed during the reaction.
Investigations of Ni/Al nanolaminate combustion typically assume a perfect crystalline lattice structure with no internal defects (other than the Ni/Al interface). One study that did evaluate internal defects was by Witbeck et al. [Reference Witbeck, Sink and Spearot13], who found that increasing point vacancy concentrations in Ni/Al nanolaminates increased both the reaction rate and peak temperature during combustion. Support for studies of nanolaminate defects can be found in reports showing unreacted experimental samples containing columnar grains with grain diameters on the order of the layer thickness [Reference Kelly and Thadhani16]. In face-centered cubic (FCC) metal systems fabricated via vapor deposition, the grain boundaries (GBs) may extend across laminate interfaces [Reference Jankowski17]. Indeed, Fritz et al. identified GBs as the primary diffusion pathway in the early stages of Ni/Al nanolaminate combustion [Reference Fritz, Grzyb, Knio, Grapes and Weihs18]. Yet, the role of grain size on the different stages of Ni/Al nanolaminate combustion is not well understood.
Accordingly, the current work investigates the effect of grain size on Ni/Al nanolaminate reaction rate and peak temperature. MD simulations are designed to study the complete reaction in nanolaminate systems with limited premixing of the elemental constituents at the bimaterial interface. Supplemental MD simulations focus on stage 3 of the reaction, as defined by Witbeck et al. [Reference Witbeck, Sink and Spearot13], to investigate the role of grain size on Ni dissolution. Effective diffusion coefficients are calculated for various Ni grain sizes at a relevant stage 3 temperature to show the effects of grain size on the development of predictive thermodynamic-based models for the combustion temperature and reaction rates. All simulation models are described in detail in the Methods Section, following presentation of the results.
Results
Effects of grain size on nanocrystalline nanolaminate reactions
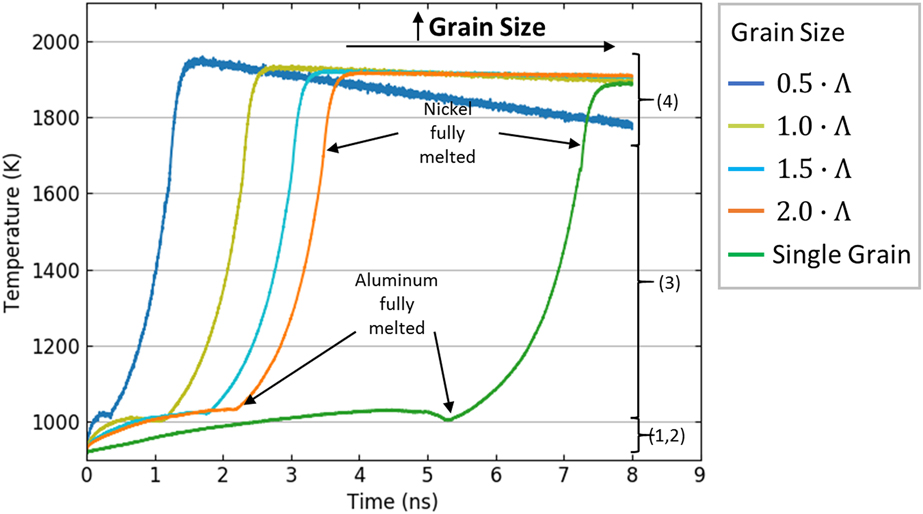
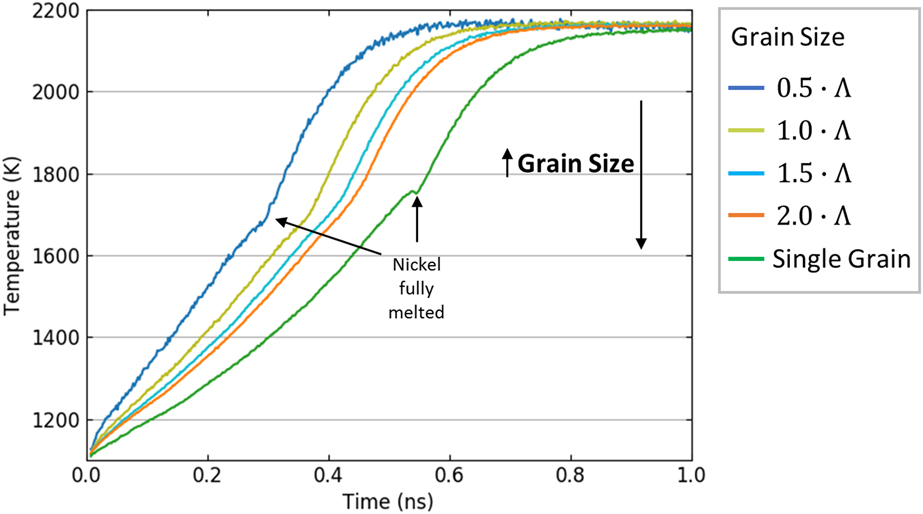
MD simulations in this work show that grain size plays a significant role on the combustion reaction rates of Ni/Al nanolaminates. Figure 1 shows decreasing time to peak temperature as grain size decreases in the 13.9 nm bilayer thickness models. Specifically, time to peak temperature decreases from 4 ns down to 1.6 ns for nanolaminates with decreasing grain diameters from 2.0 to 0.5·Λ, where Λ is the Al layer thickness. The time to peak temperature for all nanocrystalline models is less than the 8 ns required for complete reaction of the single crystal nanolaminate model. These results reveal the impact of GBs, which are often neglected in thermodynamic models of combustion temperature and wave speed [Reference Turlo, Politano and Baras19, Reference Alawieh, Weihs and Knio20]. The greatest effect on reaction rate is found during melting of the Al layer in stages 1 and 2, as shown in Fig. 1. Yet, upon complete melting of the Al layer, Fig. 1 also shows a slight decrease in the duration of stage 3 with decreasing grain size, indicating increased Ni dissolution in this stage. This will be further investigated by isolating the stage 3 reaction in the following subsection. Combined, changes in diffusion and dissolution due to reductions in grain size increase the Ni/Al nanolaminate reaction rate.
Temperature profiles for 13.9 nm models with varying grain sizes. Time to peak temperature decreases with decreasing grain size. At right, identification of reaction stages reveals the strongest influence of grain size on reaction rates in stages 1 and 2. Peak temperature also slightly increases with decreasing grain size.

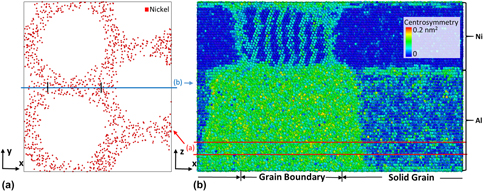
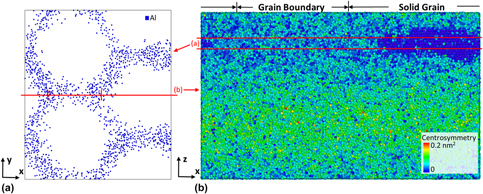
The presence of GBs in the nanolaminate model creates high-diffusion pathways for Ni to enter the Al layer, as shown by the high concentration of Ni atoms along GB regions in Fig. 2(a). This leads to preferential melting along GBs, further increasing the Ni diffusion rate. As the Ni continues to diffuse along the GBs, the GB melts through the thickness of the Al layer, as shown in Fig. 2(b), separating individual grains with an Al-rich liquid mixture. Ni is then free to diffuse into the crystalline Al grains across the original Ni/Al interface as well as through the melted GB regions, increasing the Al melting rate by effectively increasing the surface area of the Ni/Al interface and increasing the diffusion rate of Ni into Al.
Slices of the 1.5·Λ grain size model at 1.2 ns. (a) A 1.0 nm thick slice in the x–y plane, 2 nm from the base of the model, with Al atoms removed, shows Ni atoms diffusing preferentially along or near GBs. (b) A slice colored by centrosymmetry in the x–z plane along a grain boundary shows disorder due to melting along the Al GB on the left and increased order in the center of an Al grain on the right.

A secondary observation in Fig. 1 is that peak temperature slightly increases with decreasing grain size. Similar effects for point vacancy concentration were seen by Witbeck et al., as they showed that increasing vacancy concentration resulted in higher peak temperatures [Reference Witbeck, Sink and Spearot13]. These temperature increases were attributed to point vacancies destabilizing the crystal lattice structure, thereby requiring less energy to melt the Al layer, in agreement with work by Gorecki as discussed in Mei et al. [Reference Mei and Lu21]. The increase in peak temperature in the current work can similarly be attributed to an increase in vacancy concentration with increasing GB density at smaller grain sizes, because the average vacancy formation energy in GBs is lower than in the bulk material [Reference Suzuki and Mishin22]. Differences in peak temperature can be estimated by assuming any increase in initial enthalpy, H init, due to increasing GB density is converted to additional heat, Q, since the system is not performing any external work. An example calculation is performed in Appendix A for the 1.5·Λ and single crystal models, which have similar size. The calculation predicts a peak temperature increase of 26 K due to the presence of GBs. This compares well with the simulated result of 32 K shown in Fig. 1.
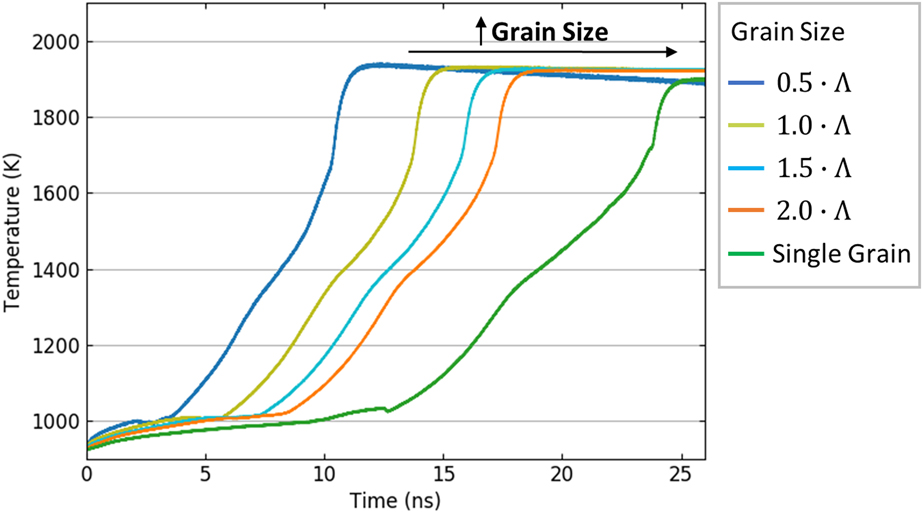
The role of GBs in nanolaminate combustion becomes more important with increasing bilayer thickness. Figure 3 shows that time to peak temperature reduces from 17.5 ns down to 15.1 ns for the 27.8 nm models as grain size decreases from 1.5 to 1.0·Λ. In the 13.9 nm models of 2.0 and 1.0·Λ, the time to peak temperature reduced from 3.8 to 2.7 ns for equivalent 8.4 nm reductions in grain diameter. Thus, the time reduction in the model with larger bilayer thickness is more than twice the reduction in the model with smaller bilayer thickness. In comparison, reducing the bilayer thickness by half in the 1.0·Λ models resulted in a 12.4 ns reduction in time to peak temperature, whereas reducing the grain diameter by half from 2.0 to 1.0·Λ in the 27.8 nm nanocrystalline models resulted in a 3.8 ns reduction. This indicates that grain size influences the Ni/Al reaction less than, but on the same order of magnitude as, the bilayer thickness for systems initiated below the melting point of Al. Additionally, all nanocrystalline nanolaminate models show significant reduction in time to peak temperature over the single crystal model. Together, Figs. 1 and 3 illustrate the importance of including GBs in thermodynamics-based models of reaction rates.
Temperature profiles for 27.8 nm models with varying grain sizes. Time to peak temperature decreases with greater magnitude for decreasing grain size than the reductions reported for the 13.9 nm models.

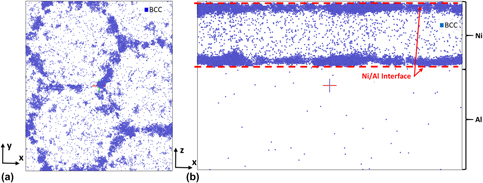
During stage 3 of the reaction, the rate of temperature increase shows a discernible change in Fig. 3. Witbeck et al. previously reported that this deviation is caused by formation of grains of B2–NiAl [Reference Witbeck, Sink and Spearot13]. This is confirmed in this work in the nanolaminate model without grains, as B2–NiAl forms at the Ni/Al interface, slowing the process of Ni dissolution into liquid Al. In the nanocrystalline nanolaminate models, the B2–NiAl phase nucleates primarily along GBs at the Ni/Al interface, as shown in Fig. 4. This heterogenous nucleation begins early in the reaction during stage 2, as the increase in Ni diffusion along GBs allows liquid Al to backfill the vacated volume and form B2–NiAl. The effects of these early formations of B2–NiAl are not readily discernable in the temperature evolution shown in Fig. 3 until the solid phase grows across the majority of the Ni/Al interface, restricting Ni diffusion into grain cores as well as GBs during stage 3.
(a) Top view and (b) side view of the 1.5·Λ grain size model with 27.8 bilayer thickness at 10.5 ns. Atoms are filtered using common neighbor analysis to show only atoms in the body-centered cubic structure of the B2–NiAl phase. Heterogenous nucleation of the B2 phase occurs along GBs at the Ni/Al interface.

Analysis of stage 3 reaction and connection to thermodynamic models
The role of grain size on stage 3 of the reaction is evaluated with two separate types of boundary conditions, as described in the Methods Section. First, 13.9 nm nanocrystalline nanolaminate models are equilibrated at 1100 K and allowed to react through stages 3 and 4. Figure 5 shows that a reduction in the grain size increases the rate of temperature increase during stage 3, reducing the time required to completely melt the Ni layer. This implies that reducing the grain size increases the dissolution rate of Ni into Al. The GBs in the Ni layer increase Ni diffusion from the bulk crystal to the solid/liquid interface. In addition, the atoms at the Ni GBs can dissolve easier into the liquid Al, due to lower binding energy. As the Ni atoms diffuse through the GBs and dissolve into Al, liquid Al flows back into the GB region vacated by the Ni atoms, increasing the surface area of the Ni/Al interface, as shown in Fig. 6. The combined effects serve to increase the reaction rate through stage 3. Thus, grain size plays a role on combustion rate for this stage and should be considered when constructing diffusion and reaction rate models.
Temperature profiles for 13.9 nm models with varying grain sizes with reaction initiated in stage 3. Time to Ni melting reduces with decreasing grain size.

Slices of the 1.5·Λ grain size model at 0.4 ns. (a) A 1.0 nm thick slice in the x–y plane, 12 nm from the base of the model, with Ni atoms removed, shows Al flowing through melted GBs into the Ni layer, increasing the Ni/Al interface area. (b) A slice colored by centrosymmetry in the x–z plane along a grain boundary shows melting of the Ni GB on the left and solid Ni on the right.

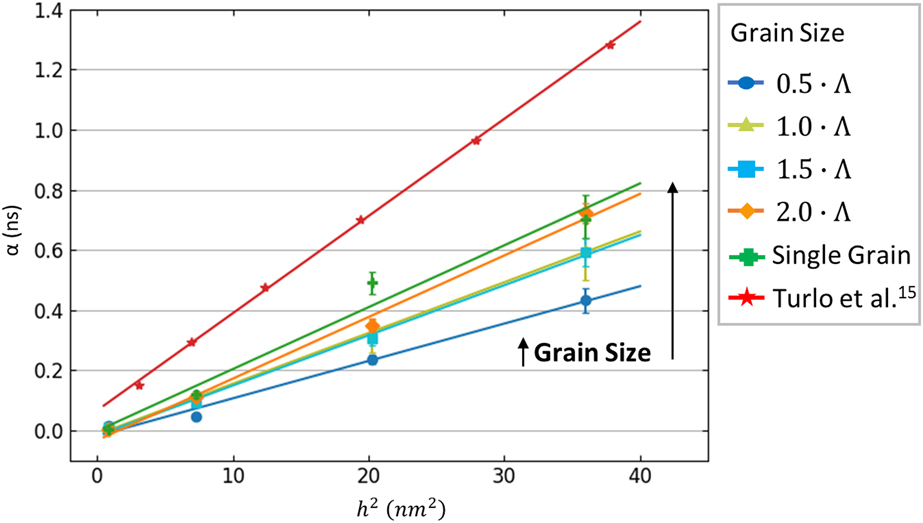
Turlo et al. [Reference Turlo, Politano and Baras15] performed MD simulations to measure diffusion during stage 3 of the Ni/Al nanolaminate reaction and developed an Arrhenius description that was used in a thermodynamic model for this stage of the reaction [Reference Mei and Lu21]. In the current work, similar MD simulations are performed to quantify the effects of grain size on diffusion and calculate an effective diffusion coefficient at 1200 K, using the methods derived by Turlo et al. [Reference Turlo, Politano and Baras15]. The MD simulation boundary conditions are described in the Methods Section. A characteristic time, α, is defined as the time required for Ni to dissolve and diffuse across the liquid Al layer. This time is determined by calculating the Ni at.%, ξ, dissolved in liquid Al as a function of reaction time and fitting the equation,
 $$\xi \left( t \right) = {n_{\rm{s}}} \cdot \left[ {{{\left( {{t \over {\pi \cdot \alpha }}} \right)}^{{1 / 2}}} \!\cdot \left( {1 - \exp \left( { - {\alpha \over t}} \right)} \right) + {\rm{erfc}}\left( {{{\left( {{\alpha \over t}} \right)}^{{1 / 2}}}} \right)} \right]\quad .$$
Here, n s is the dissolution saturation point, which is also determined from the fitting procedure. Assuming the mixing process is driven by diffusion, measuring α for multiple Al layer thicknesses, h, allows measurement of an effective diffusion coefficient,
 $${D_{{\rm{eff}}}} = {{{h^2}} \over {4 \cdot \alpha }}\quad .$$
Figure 7 shows the extracted values of α for multiple Al layer thicknesses and each grain size at 1200 K. Here, the liquid phase used to calculate the saturation concentration during the reaction is defined using common neighbor analysis. In general, decreasing the grain size results in decreased characteristic times, α, for each Al layer thickness. The characteristic times calculated by Turlo et al. [Reference Turlo, Politano and Baras15], which are also shown in Fig. 7, can be attributed to the [001] lattice orientation in the stacking direction used in their work, as compared to the [111] lattice orientation used in the current work. Supplemental calculations confirm that Ni dissolution/diffusion from a Ni/Al nanolaminate with [001] stacking is reduced in comparison to a Ni/Al nanolaminate with [111] texture.
Increasing grain size generally results in increased characteristic times, α.

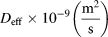
Fitting data from Fig. 7 to Eq. (2) provides an effective diffusion coefficient for each grain size, reported in Table I. The effective diffusion coefficient decreases with increasing grain size. This relationship supports the temperature profiles in Fig. 5. Thus, grain size affects diffusion in stage 3 of the Ni/Al nanolaminate reaction and will subsequently influence Arrhenius parameters of diffusion in this stage, as presented in Eqs. (14) and (15) in Turlo et al. [Reference Turlo, Politano and Baras15]. Any thermodynamic models of the dissolution/diffusion reaction should account for grain size effects on the combustion rate.
Effective diffusion coefficients measured at 1200 K decrease with increasing grain size. The [001] lattice orientation used by Turlo et al. [Reference Turlo, Politano and Baras15] also affects Ni diffusivity.

Conclusions
Ni/Al nanolaminates contain internal nanostructure in the form of columnar grains with diameters typically on the order of the nanolaminate layer thickness. The presence of these grains affects the combustion rate by providing high-diffusion pathways through the thickness of the nanolaminate, which melt preferentially to effectively increase the Ni/Al interface area. Reductions in grain size increase the combustion rate less than, but on the same order of magnitude as, reductions in bilayer thickness, which is a fundamental nanolaminate structure tied to combustion wave velocity and temperature. The effects of both grain size and bilayer thickness may be mitigated in experimental results due to premixing at the Ni/Al interface [Reference Jayaraman, Mann, Weihs and Knio7, Reference Mann, Gavens, Reiss, Van Heerden, Bao and Weihs8, Reference Gavens, Van Heerden, Mann, Reiss and Weihs9]. At the intersection with this interface, GBs act as heterogenous nucleation sites to form the B2–NiAl phase, which inhibits Ni diffusion and reduces the combustion reaction rate after growing sufficiently large across the majority of the interface. Grain size affects reaction peak temperature by increasing vacancy concentration within the nanolaminate, which reduces the energy required to melt the solid crystal in these regions and increases the energy available for enthalpic mixing of Ni and Al-rich liquids. Grain size should be considered in thermodynamic models of Ni/Al nanolaminate combustion. This is evident in Figs. 1 and 3, as stages 1 and 2 of the reaction require shorter times as the grain size is reduced. In stage 3 of the reaction, which contains grains only in the Ni layer, decreasing in grain size increases the effective diffusion coefficient at 1200 K. This relationship will influence any thermodynamic models of this stage that incorporate diffusion, and it should be accounted for when predicting combustion rates.
Methods
Nanocrystalline nanolaminate model reactions
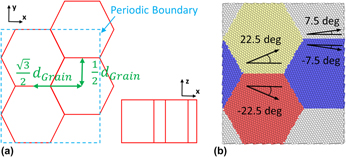
Nanocrystalline nanolaminate models are constructed using a Voronoi tessellation approach, modifying a code used in the work of Rajgarhia et al. [Reference Rajgarhia, Spearot and Saxena23]. The Voronoi tessellation method uses a set of specified or random grain centers to define GB vertices and construct grains such that every atom within a constructed grain is closer to its grain center than any other grain center. To build the Ni/Al nanolaminate, Ni and Al layers are first built separately using the lattice parameters of Ni (3.52 Å) and Al (4.05 Å), with thicknesses that provide an approximately 1:1 ratio of Ni to Al atoms for each model. In each layer, four grain centers are explicitly defined such that all grains have the same diameter, d Grain, with centers exactly d Grain from the neighboring grain or a periodic image of a neighboring grain. Sets of two grains each have the same position in the x direction, but they are separated by d Grain in the y direction. The second set of grain centers is offset in the y direction by  ${1 \over 2}{d_{{\rm{Grain}}}}$ and in the x direction by
 ${{\sqrt 3 } \over 2}{d_{{\rm{Grain}}}}$, as shown in Fig. 8(a). All grain centers are given the same position in the z direction equal to half the thickness of the material layer. These dimensions create columnar grains in both the Ni and Al models, in which all grains have the same diameter, similar to experimental samples of FCC nanolaminates [Reference Jankowski17]. The boundary conditions of each model are fully periodic. This approach creates uniform hexagonal grains, similar to the work of Yamakov et al. [Reference Yamakov, Wolf, Salazar, Phillpot and Gleiter24]. The lattice for each grain is oriented such that a 〈111〉 texture is specified in the z direction, and GB tilt angles are specified around the [111] tilt axis in 15-degree increments, as shown in Fig. 8(b). Multiple nanocrystalline nanolaminate models are built with values of d Grain equal to 0.5, 1.0, 1.5, and 2.0 times Λ, the Al layer thickness. The resulting nanocrystalline model dimensions are
 $\sqrt 3 \cdot {d_{{\rm{Grain}}}}$ in the x direction and 2·d Grain in the y direction. The z dimensions are 5.5 and 8.4 nm for the individual Ni and Al models in the 13.9 nm bilayer thickness nanolaminate, and 11.0 and 16.8 nm for the Ni and Al models in the 27.8 nm nanolaminate.
(a) Schematic of the nanocrystalline nanolaminate model. The repeating structure consists of four uniform hexagonal crystals which form columns in the z direction. (b) Image of the nanocrystalline Al model shows lattice orientations forming GB tilt angles in 15° increments.

For comparison purposes, nanolaminate models with single crystal layers are also constructed. The lattice orientation for each layer is  $\left[ {\bar{1}\bar{1}2} \right]$,
 $\left[ {1\bar{1}0} \right]$, and [111] in the x, y, and z directions, respectively. Nanolaminate models are then constructed with the x and y dimensions of 19.8 and 26.8 nm, approximately matching the 13.9 nm bilayer thickness model with d Grain = 1.5·Λ, but at dimensions for which periodic boundary conditions can be applied in each direction, based on Ni and Al lattice parameters. Dimensions in the z direction are the same as those for the nanocrystalline nanolaminate models.
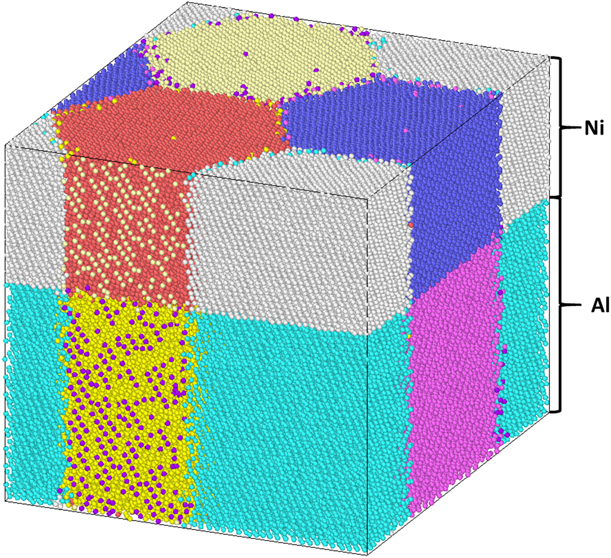
For all simulations, the 2009 Mishin Ni–Al embedded-atom method (EAM) potential [Reference Purja Pun and Mishin25] is used due to its increased accuracy for Ni and Al melting points [Reference Weingarten and Rice26] and enthalpy values [Reference Turlo, Baras and Politano27]. To equilibrate the models and simulate reactions in nanolaminate systems (with or without grains), first, the individual material layers are separately subjected to a conjugate-gradient minimization routine followed by thermodynamic equilibration in the constant pressure and constant temperature (NPT) ensemble at 0 GPa and 925 K for 20 ps. These separate equilibration routines allow each layer to reach thermodynamic equilibrium with no diffusion between the layers. While the Ni layer is allowed to expand in all directions, the x and y dimensions of the Al layer are fixed at the equilibrated dimensions of the Ni layer, ensuring that the lateral dimensions of the individual layers match when they are joined to form the nanolaminate model. The equilibrated models of Ni and Al are then combined with the Ni layer on top of the Al layer in the z direction, with a 1.25 Å gap between the layers. The z dimension of the periodic simulation cell is defined such that there is a 0.625 Å gap between the bottom boundary and the bottom of the Al, and between the top boundary and the top of the Ni, forming a 1.25 Å gap between the Ni and Al across the periodic boundary. The nanolaminate system is then equilibrated in the NPT ensemble for 5 ps. This final equilibration mitigates effects of stresses incurred by initially equilibrating the Al model at the final Ni dimensions, as stresses on the nanolaminate have been shown to affect combustion [Reference Weingarten and Rice26, Reference Weingarten, Mattson, Yau, Weihs and Rice28]. The final equilibrated model is shown in Fig. 9. Altogether, running two sets of equilibration simulations, one with separated material layers and one with integrated material layers, reduces diffusion between the layers and minimizes the thickness of the premixed layer, which has shown to affect combustion rates [Reference Jayaraman, Mann, Weihs and Knio7, Reference Mann, Gavens, Reiss, Van Heerden, Bao and Weihs8, Reference Gavens, Van Heerden, Mann, Reiss and Weihs9]. No dislocations, which could affect diffusivity, are observed in the initial system. Finally, the simulation ensemble is switched to the NPH ensemble and run for 8 ns for the 13.9 nm models and 26 ns for the 27.8 nm models to allow the Ni/Al nanolaminate to completely react.
The final, equilibrated 1.0·Λ model with 13.9 nm bilayer thickness and periodic boundary conditions. Grain diameters are the same for both the Ni and Al layers, and premixing is mitigated at the Ni/Al interface.

Stage 3 solid Ni/liquid Al model reactions
MD simulations are also performed to isolate the effect of grain size on stage 3 Ni dissolution. The same Ni and Al models used in the 13.9 nm nanolaminates are equilibrated separately under the NPT ensemble at 0 GPa. The Ni layer is equilibrated at 1100 K for 20 ps; the Al layer is initialized at 1500 K and cooled at 20 K/ps to a temperature of 1100 K, to ensure the Al layer fully melts before equilibrating at 1100 K for 20 ps. The dimensions of the Ni model are allowed to expand during NPT equilibration, but the x and y dimensions of the Al model are again fixed to match the final equilibrated dimensions of the Ni model. The solid Ni and liquid Al layers are then combined into a nanolaminate model, using the method described in the previous section. After a 5 ps equilibration under NPT, the simulation ensemble is switched to NPH to allow the system to react for 1 ns.
Additional MD simulations are performed using boundary conditions similar to that of Turlo et al. [Reference Turlo, Politano and Baras15] to study the effect of grain size on parameters necessary for a thermodynamic model of the stage 3 reaction. These simulations use the same Ni models used to build the 13.9 nm nanolaminates, with Al models of varying thicknesses. The Ni models are equilibrated at 0 GPa and 1200 K, and the final x and y dimensions are used to define the x and y dimensions of the of the Al models. Al models are built with an initial [100], [010], and [001] orientation with the z dimensions ranging from 2 to 14 unit cells in increments of 4 unit cells. The equilibration method follows the routine defined for the prior stage 3 analysis to equilibrate at 1200 K for 20 ps, resulting in a liquid Al layer. After joining the two models, the nanolaminate model is equilibrated in the NPT ensemble for 4 ns. These simulations enable a measurement of an effective diffusion coefficient at 1200 K, following the procedures outlined by Turlo et al. [Reference Turlo, Politano and Baras15].
Acknowledgments
The authors gratefully acknowledge support from the U.S. Department of Defense Science, Mathematics & Research for Transformation (SMART) Scholarship and the Munitions Directorate of the Air Force Research Laboratory. (Distribution A. Approved for public release; distribution unlimited. 96TW-2018-0407.)
Appendix A. peak temperature increase calculation
The peak temperature increase in Figs. 1 and 3 can be estimated by assuming any increase in initial enthalpy, H init, due to increasing GB density will be converted to additional heat, Q, since the system is not performing any external work. The heat capacity equation provides a conversion between additional heat and a change in system temperature,
 $$Q = m \cdot {C_{\rm{p}}} \cdot \Delta T\quad ,$$
where m represents the mass, C p, the specific heat capacity, and ΔT, the temperature change of the system. If Eq. (A.1) is rearranged and terms for both the Ni and Al layers are separated,
 $$\Delta T = {Q \over {{{\left( {m \cdot {C_{\rm{p}}}} \right)}_{{\rm{Ni}}}} + {{\left( {m \cdot {C_{\rm{p}}}} \right)}_{{\rm{Al}}}}}}\quad ,$$
which provides an estimate for the temperature increase of any single model. The relative temperature increase of the 1.5·Λ nanocrystalline (nc) and the single grain (sg) models, for example, can then be compared by subtracting the ΔT of one model from the other and substituting H init at 925 K for Q,
 $$\Delta {T_{{\rm{nc}}}} - \Delta {T_{{\rm{sg}}}} = {\left[ {{{{H_{{\rm{init}}}}} \over {{{\left( {m \cdot {C_{\rm{p}}}} \right)}_{{\rm{Ni}}}} + {{\left( {m \cdot {C_{\rm{p}}}} \right)}_{{\rm{Al}}}}}}} \right]_{{\rm{nc}}}} - {\left[ {{{{H_{{\rm{init}}}}} \over {{{\left( {m \cdot {C_{\rm{p}}}} \right)}_{{\rm{Ni}}}} + {{\left( {m \cdot {C_{\rm{p}}}} \right)}_{{\rm{Al}}}}}}} \right]_{{\rm{sg}}}}\quad .$$
This calculation results in a peak temperature increase of 26 K, which compares well with the measured result of 32 K in Fig. 1.